Figure 8 -.

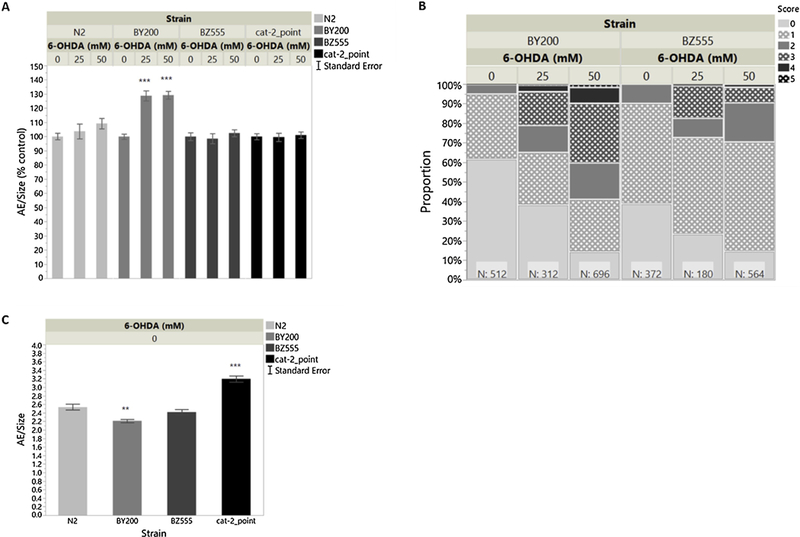
AE and neurodegeneration in adult worms after 1h L4 exposure to 6-OHDA. - (A) Area Exploration/Size normalized to strain matched 0mM 6-OHDA control. “AE/Size (% control)” shows significance in comparison to strain-matched 0mM 6-OHDA control. n= 1970 worms 2-way ANOVA Strain*6-OHDA p<0.0001; Tukey HSD [BY200,25mM vs. BY200,0mM p<0.0001; BY200,50mM vs. BY200,0mM p<0.0001]. (B) Neurodegeneration scores of BY200 and BZ555. n=2636 neurons/659 worms Ordinal Logistics Chi Squared Whole Model Test p<0.0001; Effect Likelihood Ratio Chi Squared Tests [Strain p=0.0234; 6-OHDA p<0.0001; Strain*6-OHDA p<0.0001]. (C) Basal Area Exploration/Size in N2, BY200, BZ555 and the cat-2 point mutant following 1h L4 exposure to 0mM 6-OHDA; these strain underwent the 6-OHDA protocol and were exposure to ascorbic acid only. “AE/Size” shows significance in comparison to dose-matched N2 control. n=759 worms 1-way ANOVA Strain p<0.0001; Dunnett [N2 vs. BY200 p=0.0041; N2 vs. cat-2_point p<0.0001]. Note: All graphs in this figure are a combination of 3 separate experiments, each completed with 3 biological replicates.
