

Abstract
Molecular diagnostics have significantly advanced the early detection of diseases, where electrochemical sensing of biomarkers has shown considerable promise. For a nucleic acid-based electrochemical sensor with signal-off behavior, the performance is evaluated by percent signal suppression (% ss), which indicates the change in current after hybridization. The % ss is generally due to more redox molecules (e.g., methylene blue) associating with the probe DNA bases in the single-strand form than the double-strand form upon hybridization with the target nucleic acid. Nanostructured electrodes generally enhance electrochemical sensor performance via several mechanisms, including increased number of capture probes per electrode volume and unique nanoscale transport phenomena. Here, we employ nanoporous gold (np-Au) as a model electrode material to study the influence of probe immobilization solution concentration on sensor performance and the underlying mechanisms. Unlike planar gold (pl-Au) electrodes, where % ss reaches a steady-state with increasing concentration of the grafting solution, the % ss displays peak performance at certain grafting solution concentrations followed by rapid deterioration and reversal of the % ss polarity, suggesting an unexpected case of increased charge transfer upon hybridization. Fluorometric assessments of electrochemically-desorbed nucleic acids for different electrode morphologies reveal significant amount of DNA molecules (unhybridized and hybridized) remain within the nanopores post-hybridization. Analysis of electrochemical signals (e.g., square wave voltammogram shape) suggests that the large unbound nucleic acid concentration may be altering the modes of methylene blue interaction with the nucleic acids and charge transfer to the electrode surfaces.
Graphical Abstract

The rapid detection and identification of specific microbial pathogens including bacteria, viruses and fungi is a grand challenge facing plant and human health. Early disease diagnosis is essential for an effective national healthcare infrastructure, where it is estimated that billions of molecular tests to detect disease-causing pathogens will be required per year globally1. Examples of such human pathogens include Escherichia coli, Shigella, and Salmonella which cause foodborne diseases, and plant pathogens such as tobacco mosaic virus and cauliflower mosaic virus2. Nucleic acid-based diagnostics is a powerful tool, not just for pathogen detection, but for cancer diagnosis and surveillance as well3–6. Consequently, approaches to use nucleic acids as biomarkers are growing rapidly to replace or complement cell culture-based, biochemical and immunological assays7,8. Various nucleic acid-based bio-sensors modalities have been developed for point-of-care detection, enabling sensitive and rapid analysis (optical, surface plasmon resonance, piezoelectric, etc.)9,10. For example, quantitative polymerase chain reaction, achieves low limits of detection and high selectivity, yet requires sample preparation to extract target nucleic acids. Next-generation sequencing technology, while providing impressive sequence information without a priori knowledge of organisms, the necessary sample preparation and target application followed by bioinformatics interpretation, make it less desirable for applications requiring a fast diagnostic turn-around. Alternatively, electro-chemical nucleic acid-based sensors have attracted significant attention as powerful bioanalytical tools, as they can be multiplexed and easily interfaced with data acquisition electronics for portability11–14.
The material and geometry that constitute the working electrode of an electrochemical nucleic acid-based sensor play a significant role in its performance15–18. Electrode coatings can be broadly classified into smooth and nanostructured sensors based on the geometry of the working electrode. Smooth electrodes do not have any crevices or undulations. Common materials used for smooth electrodes include gold, platinum, carbon paste, glassy carbon, indium tin oxide and carbon micro-fibers14. One main limitation of smooth electrodes is that the probe molecules may not be displayed in favorable orientations for target hybridization19. Recently, nanostructuring of the electrode surface greatly mitigated these issues and enabled significant enhancement in sensor performance16. These enhancements include increased surface area-to-volume ratio and surface coverage of capture probes17, favorable orientation of the immobilized probes15, tunable dynamic range15,20, and higher electro-catalytic activity at the surface19.
In order to develop electrochemical biosensors with rationally-designed nanostructures, it is imperative to have a fundamental understanding of the structure-property relationships that dictate sensor performance. It has been shown that nanoporous gold (np-Au) thin films can successfully be used as a model electrode system to investigate molecule-nanostructure interactions in electrochemical biosensors17,21–24. Specifically, by modifying np-Au pore morphology (i.e., pore size, effective surface area) and employing electrochemical characterization, the effect of morphology on important nucleic acid-based sensor parameters, such as sensitivity and biofouling resilience, could be investigated. Np-Au, which can be easily produced, is emerging as a popular material for electrochemical sensors and recent demonstrations include detection of biomolecules and pharmaceuticals using this novel material21–25. Np-Au is produced by a nanoscale self-organization process, where silver atoms are dissolved from a silver-rich gold alloy in nitric acid and gold atoms diffuse at the metal-electrolyte interface to create a bicontinuous open-pore structure26. The np-Au electrodes facilitated three orders of magnitude improvement in detection limit compared to traditional planar counter-parts due to increased target penetration into the porous network and hence enhanced hybridization efficiency17. Additionally, by utilizing the inherent bio-sieving features of np-Au films, sensitive detection of short nucleic acids in biologically-relevant complex samples, such as serum, was achieved20, circumventing the need for laborious sample preparation where most other nanostructured devices often require purified nucleic acids for analysis since the constituents of complex biological fluids (e.g., blood, plant lysate) adversely affect sensor performance through biofouling27.
Unlike smooth electrode-based sensors, which can work at their optimal performance at a wide range of probe grafting densities28–31, in order to benefit from the enhanced performance of nanostructured electrodes, the optimal working conditions need to be identified. To that end, we report a comprehensive study to expand fundamental understanding of how major stages of an electrochemical sensing process, such as molecule transport limitations and DNA probe grafting density on np-Au electrodes with varying morphologies, lead to unexpected trends in electrochemical nucleic acid detection. We envision the findings to be generalizable to other electrochemical sensing platforms employing nanostructured electrodes, thereby assist in rationale design of electrochemical sensors for point-of-care diagnostics and medical research.
EXPERIMENTAL SECTION
Chemical Reagents.
Electron Microscopy Sciences glass coverslips were used as substrates for film deposition (22 × 22 × 0.15 mm). Gold (Au), silver (Ag), and chrome (Cr) targets (99.95% pure) were obtained from Kurt J. Lesker. Nitric acid (70%), sulfuric acid (96%) and hydrogen peroxide (30%) were purchased from Sigma-Aldrich, USA. Piranha solution consisted of 1:4 ratio (by volume) of hydrogen peroxide and sulfuric acid. CAUTION: Piranha solution and nitric acid are highly corrosive and reactive with organic materials and must be handled with extreme care. Tris(2-chloroethyl)phosphate (TCEP, 0.5 M), magnesium chloride (MgCl2, powder) and phosphate buffer (PB, 1 M) were obtained from Fisher Scientific. Phosphate buffered saline (PBS, 10×) was purchased from Life Technologies. Zeba™ Spin Desalting Columns were obtained from Thermo Fisher Scientific. Methylene blue (MB, powder) was obtained from Biosearch Technologies. 6-mercapto-1-hexanol, (MCH, 99%) was obtained from Sigma-Aldrich. The oligonucleotides used in this project consisted of 26 bases and were purchased from Integrated DNA Technologies, USA. The 5’ end of ssDNA probe was modified with a C6 linker and thiol group: 5ThioMC6-D/CGT GTT ATA AAA TGT AAT TTG GAA TT. Target DNA sequence matching to the probe DNA was: AAT TCC AAA TTA CAT TTT ATA ACA CG. Quant-iT™ OliGreen™ ssDNA and Quant-iT™ PicoGreen™ dsDNA Assay Kit were obtained from Thermo Fisher Scientific.
Fabrication of Nanoporous Gold (np-Au) Electrodes.
The np-Au gold films were prepared by sputter-deposition. Briefly, a stack of metal layers (160 nm-thick chrome adhesion layer, 80 nm-thick gold seed layer, 600 nm-thick Au0.36Ag0.64 (atomic %) alloy on piranha-cleaned glass coverslips followed by dealloying in nitric acid, as described previously32. To obtain np-Au electrodes with coarser pores (referred to as annealed np-Au), a group of dealloyed np-Au samples (referred to as unannealed np-Au) was thermally treated at 250 °C for 1.5 min on a hotplate33. Planar gold electrodes (control morphology) were fabricated similarly. Fabrication details can be found in Supporting Information (SI).
Microscopic Characterization of Electrode Morphology.
To investigate micro- and nanoscale morphological features of the fabricated samples, high magnification images (100k× magnification) were taken using scanning electron microscopy (SEM; FEI Nova NanoSEM430). The top and cross-sectional images of varying electrode morphology samples were analyzed using ImageJ (National Institutes of Health shareware, http://rsb.info.nih.gov/ij/index.html) in order to determine the median pore size17.
Electrochemical Characterization of Electrode Morphology with H2SO4 and Methylene Blue.
All electrochemical experiments were performed with a Gamry Reference 600 potentiostat. Effective surface area of the metal electrodes was determined using electrochemical cyclic voltammetry (CV) measurements using previously established protocols that report on the charge required to strip the gold oxide layer via CV21,34, when using 0.5 M sulfuric acid (Figure S2). For all the measurements, enhancement factor (EF) is defined as the ratio of value measured for any test morphology to that for pl-Au under the same testing conditions. To determine presence of possible transport limitations of MB redox reporters within the porous electrodes, a set of bare np-Au and pl-Au electrodes were exposed to 20 μM MB prior to assessment via CV. Similarly, MCH-coated electrodes (treatment with 1 mM MCH for 2 hr), were incubated in 20 μM MB and the total charge transfer was determined via CV and its subsequent analysis with the Gamry software package. See SI for details on electro-chemical characterization parameters and calculations.
Immobilization and Electrochemical Quantification of DNA Probes.
Electrodes were immobilized with incubation at varying probe solution concentrations using previously described protocols17. Briefly, piranha cleaned electrodes were incubated overnight (~15 hr) with desired probe solution concentration (0. 0.5, 1, 2, 4, 6 and 8 μM), containing reduced DNA probe, 25 mM PB and 50 mM μMgCl2. To obtain a well-ordered DNA probe monolayer, electrodes were back-filled with MCH as described above. Finally, DNA probe-immobilized electrode was assembled in the electrochemical cell for electrochemical characterization (see SI and Figure S1a for details). To indirectly quantify the amount of DNA probes immobilized on the electrodes, 150 μL of 20 μM MB prepared in 1× PBS was added to the assembled electrochemical cell and incubated for 10 min. In high ionic strength incubation solution, negatively-charged phosphate backbone of ssDNA is screened, allowing MB to bind to guanine bases (G-bases) only35,36. The electrodes were washed with PB after MB accumulation to remove unbound MB molecules. Finally, electrochemical MB footprint was acquired in 1× PBS using square wave voltammetry (SWV) measurements, and the total charge transfer, Q, under SWV curve was determined directly from Gamry Software and used as an indirect measure of amount of DNA probes immobilized on the electrode surface (baseline signal). Note that total charge transfer, Q, was used to electrochemically quantify nucleic acids presence instead of SWV peak current, I, because it captures electrochemical behavior more precisely for varying SWV curve shapes due to increasing probe solution concentrations (Figure S3). SWV was performed using a pulse size of 40 mV and frequency previously optimized for different electrode morphologies: 18 Hz for unannealed np-Au, 30 Hz for annealed np-Au, and 60 Hz for pl-Au17. After probe DNA baseline signal determination (Figure S1b), SWV was run until probe signal was depleted to at least 30% of the baseline signal, indicating MB dissociation from the DNA strand. One set of such electrodes was electrochemically cycled following MB depletion to desorb and elute the immobilized DNA for fluorometrically determining the amount of DNA probes, using a previously-established protocol ensuring efficient extraction of immobilized DNA from the pores37,38. Remaining electrodes were used for target DNA detection and hybridization assays.
Electrochemical Extraction and Fluorometric Analysis of DNA Probe-Immobilized Electrodes.
To decouple the influence of electrochemical effects, which would obscure determination of actual immobilized probe amount, an independent measurement with fluorescent dyes was used on the electro-chemically-extracted DNA probes (details described in SI and Figure S4)39,40. To fluorometrically quantify the amount of DNA probes, extracted probe DNA solution was analyzed using Quant-iT™ OliGreen™ ssDNA Kit. Briefly, OliGreen dye was added to the extracted samples, and after 5 minutes of incubation at room temperature, a NanoDrop™ Spectrophotometer was used for quantifying the amount of DNA present in the extracted samples.
Electrochemical Target DNA Detection.
The set of electrodes immobilized with various probe solution concentrations that were electrochemically quantified, were next challenged with 500 nM target DNA concentration to determine detection capabilities of the DNA sensor17. Each electrode was incubated with in PB containing the target DNA fragments and 50 mM MgCl2 for 35 min at 37°C. The electrodes were then rinsed to remove nonspecifically bound target molecules and incubated with MB as done before for probe DNA characterization. Amount of target DNA captured by the probe recognition layer was determined by the decrease in total charge transfer under SVW curve (due to less MB binding to the hybrids as G-bases are not accessible) compared to that for the DNA probe baseline35,36. The difference in total charge transfer between the probe baseline and target signal was used to quantify the hybridization efficiency in each case, expressed as percent signal suppression (% ss), and is classified as a ‘signal-off electrochemical detection mode (Figure S1b)17,41.
Fluorometric Analysis of Hybridized Samples.
Similar to the sample preparation for fluorometric analysis of probe DNA, the electrodes were exposed to a previously established CV treatment following the hybridization step to extract any nucleic acids (hybrids or ssDNA) from the electrodes (Figure S4). The aforementioned fluorometric analysis was employed with Quant-iT™ OliGreen™ ssDNA Kit Quant-iT™ PicoGreen™ dsDNA Assay Kit to determine amount of ssand dsDNA in the extracted samples.
RESULTS AND DISCUSSION
Here, we discuss electrochemical detection mechanisms studied via (i) electrochemical response as a function of electrode morphology and critical sensing components, such as reporter MB and backfill MCH; (ii) electrochemically- and fluorometrically-determined amounts of DNA probes immobilized on the electrode surfaces; (iii) effect of various probe grafting densities on the sensor detection performance; (iv) analysis of MB electrochemical data to provide insight into MB-nucleic acid interactions within the nanostructured coatings. Unless indicated otherwise, all experiments involved at least three different samples, where the data points are the averages and the error bars are the standard deviations of the measured values respectively.
Morphological Characterization.
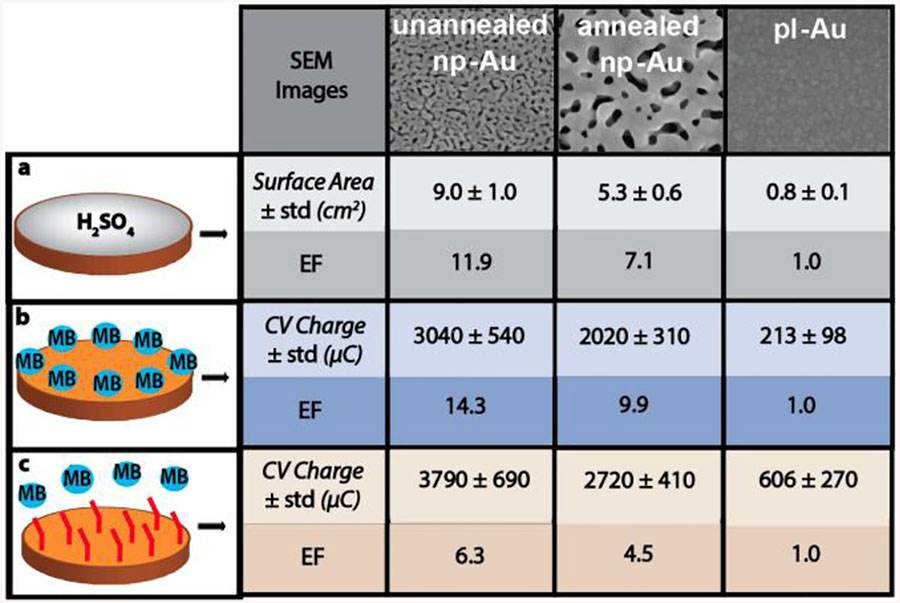
Np-Au electrode pore morphology is one of the main characteristics that affect both, electrochemical17,20 and transport events42,43 for nanostructured sensors. To understand the effect of pore morphology on electrochemical sensing phenomena at nano-level, a group of np-Au samples (unannealed np-Au) was thermally annealed, as routinely performed44. The median pore radii of unannealed and annealed np-Au electrodes were 24 nm and 56 nm respectively, determined by analysis of SEM images (Figure 1a and Figure 1b). Interconnected non-columnar pores and resulting ‘funnel-like’ constrictions are evident in the cross-section images of the two morphologies (Figure 1c and Figure 1d).
Figure 1.

Scanning electron micrographs of top-view (a) unannealed np-Au film; (b) annealed np-Au film (obtained via thermal-annealing process at 250 °C); and cross-sectional views of (c) unannealed np-Au film; (d) annealed np-Au film.
Nanostructure Transport Limitations.
As the electrochemical sensor performance is a function of nucleic acids, MB redox reporters, and MCH backfill, we systematically studied the influence of each on the electrochemical signal. The electrochemical surface area characterization with dilute sulfuric acid, which is not prone to hindered diffusion within the pores) confirm previous findings17 and reveal that the unannealed np-Au has higher EF (surface area) as compared to annealed np-Au (EF = 11.9, 7.1, 1.0; unannealed, annealed, planar Au respectively), as shown in Table 1a and Figure S2a. Next, electrodes were exposed to 20 μM MB solution to test whether MB is subject to transport limitations within the nanostructures. The EF values (total charge transfer) for MB reduction in the porous electrodes (Table 1b and Figure S2b) were at least as high as those obtained with the electrochemical H2SO4 measurements for electrochemically-accessible surface area, suggesting that MB does not experience transport-limitations within np-Au pores. Interestingly, the EF values for MB were 14.3 and 9.9 for unannealed and annealed np-Au respectively, compared to 11.9 and 7.1 when characterized with H2SO4. This discrepancy is attributed to the hindered transport of MB molecules within the pores ensuring a higher percentage of redox molecules to be reduced before they escape into the bulk solution (as it would be in the case of planar gold) - an electrochemical phenomena recently observed in np-Au for different redox molecule species45.
Table 1.
Comparison of EF for varying electrode morphologies (unannealed np-Au, annealed np-Au, pl-Au), obtained using the charge under the CV curve generated by reducing a) H2SO4 on bare electrode (converted to electrode surface area); b) MB on bare electrode: c) MB on MCH coated electrode.
|
While MB alone does not experience significant transport limitations, the introduction of the MCH passivation layer (necessary for favorable a DNA probe monolayer46–48) may introduce additional transport limitations. Indeed, the EFs obtained by determining total charge transfer from MB for the different electrode morphologies were less than the values obtained for MB without MCH back-fill (Table 1c and Figure S2c). This suggests that MCH may be reducing effective pore sizes (especially at the funnel-like constrictions) and limiting MB transport to deeper surfaces in the porous electrodes; thereby, reducing the surface area that contributes to electro-chemical sensing. It is obvious to expect that nucleic acids will also be prone to such hindered transport during both DNA probe immobilization and target detections steps, which is discussed next.
Trends in Probe DNA Immobilization Density.
One of the main determinants of an electrochemical sensor performance is formation of DNA probe monolayer15,49,50 with favorable conformation to allow hybridization with a target molecule. For this reason, before testing the target DNA detection performance of the sensor, the effect of probe immobilization solution concentration (0 – 8 μM) on the extent of DNA probe immobilization within the nanostructured electrodes was investigated by charge transfer determination via SWV (Figure 2a), as described under Experimental Section. Unlike the pl-Au (control), which reaches its maximum probe grafting density at 1 μM probe solution concentration, both np-Au morphologies required higher probe immobilization solution concentrations to achieve their maximum grafting density. This suggests that the probe DNA grafting is mass-transport limited, where a larger concentration gradient ensures DNA in-flux despite the crowding within the pores particularly at the funnel-like constrictions, as was suggested by the MCH and MB results. The probe grafting trends for the two np-Au morphologies indicate that there is a necessary probe concentration to achieve immobilization in nanoporous structures, as exhibited in similar probe currents in low probe immobilization concentration range 0.5 – 2 μM for the two nanostructured morphologies. In this low probe concentration regime, annealed np-Au pore surfaces are readily accessible by probes due to larger pore size, while DNA probes within the unannealed np-Au electrode experience diffusion limitations due to the channel constrictions within the porous electrodes. For this reason, two morphologies appear to have similar amounts of probes immobilized in low probe solution concentration conditions, that is, plausibly only the top portion of unannealed np-Au electrode is accessed. Annealed np-Au reaches its maximum grafting density around 2 μM probe solution concentration, while unannealed np-Au needs much higher probe solution concentration to reach its maximum grafting density, seen by the total charge transfer constantly increasing.
Figure 2.

a) Total charge transfer under SWV, Q, curve obtained for different electrode morphologies (unannealed np-Au, annealed np-Au, pl-Au) at varying probe solution concentrations (0, 0.5, 1, 2, 4, 6, 8 μM); b) OliGreen fluorescence measurements to quantify amount of immobilized DNA probes at varying probe solution concentrations (0, 0.5, 1, 2, 4, 6, 8 μM) and extracted from the electrode via CV desorption/elution method; c) Combined electrochemical results from Figure 2a and fluorescence measurements from Figure 2b to provide insight into immobilization trends for different morphologies at varying probe solution concentrations.
Since the total charge transfer is only an indirect measure of how much DNA probe is present in porous electrodes, fluorescence-based nucleic acid measurements were performed on the immobilized DNA probes to more accurately determine the amount of DNA upon immobilization on the electrodes. Once the DNA within the electrodes was electrochemically desorbed and eluted, the eluate containing the DNA probes was fluorometrically analyzed with OliGreen (Figure 2b). In agreement with the electrochemical results, the OliGreen quantification for unannealed np-Au showed a constant increase for the amount of DNA probes in the porous electrodes with increasing probe solution concentration with a similar inflexion point at 2 μM probe solution concentration. This consensus between the two independent methods (i.e., electro-chemical and fluorometric) rules out the possibility that the anomalous trend observed for the electrochemical assessment is a transport-driven effect. Instead, it appears to be an electro-chemical signal enhancement artefact due to phenomena such as redox amplification in nanoconfinement45,51,52.
To better illustrate the DNA transport phenomenon during probe immobilization, it is instructive to plot the total charge transfer (Figure 2a) with respect to fluorometric (Figure 2b) assessments of ssDNA amounts in the electrodes. The composite plot, Figure 2c, again highlights that nanoporous electrodes need a higher probe solution concentration to immobilize a larger portion of the available surfaces (as determined by dilute sulfuric acid quantification in Table 1). The composite plot (individual morphologies displayed separately in Figure S5) also reveals that while there is a linear increase in the amount of immobilized probe with increasing probe solution for pl-Au and annealed np-Au, a secondary trend emerges for unannealed np-Au. The correlation coefficients (corresponding to the two observed regimes) between the two measurement modalities for unannealed np-Au are 0.90 (0 to 2 μM region) and 0.94 (2 to 8 μM region). On the other hand, the correlation factor for annealed np-Au and pl-Au are 0.95 and 0.90 respectively. The non-linear trend observed for unannealed np-Au again points to the increasing dependence on a larger concentration gradient between the incubation solution and the pores to successfully immobilize the entire surface of the porous electrode with many channel constrictions (Figure 1d) due to small median pore size.
Effect of Probe Grafting Density on Hybridization.
Once probe DNA had been both electrochemically and fluorometrically characterized, the electrodes were exposed to 500 nM target solution (concentration that is within the dynamic range of detection for all three electrode morphologies17,42). Successful target detection is identified by the SWV signal drop, measured as percent signal suppression (% ss) defined as (Qprobe − Qtarget)/Qprobe) × 100, where the total charge transfer values are shown in Figure S6. A positive % ss generally indicates successful hybridization, while zero % ss indicates no DNA target capture, both of which are normal sensor behaviors. A negative % ss, on the other hand, would suggest an anomalous sensor behavior. To that end, unlike the smooth pl-Au electrode, where once the maximum probe grafting density is reached, the sensors display constant performance (% ss reaches plateau); in the case of nanostructured electrodes, sensor reaches peak performance at distinct probe concentrations, after which the performance starts deteriorating, marked by the reversed % ss (Figure 3a). Specifically, annealed np-Au exhibits reversed % ss behavior in the range of 2 – 8 μM probe immobilization solution concentration, but it reaches its plateau as soon as it enters the reversed % ss regime at 2 μM probe solution concentration. On the other hand, unannealed np-Au, begins to exhibit reversed % ss at 4 μM probe solution concentration, but it plateaus only at 6 μM. The reversed % ss suggests a higher total charge transfer, which is an unexpected result, as the electrochemical signal should either remain the same as probe baseline signal (since no additional probes have been immobilized) or decrease (since hybridization reduces the available binding sites for MB) binding, both of which are expected trends with pl-Au electrodes. Fluorometric investigation of DNA molecules is performed next to illuminate possible mechanisms of this anomalous sensor response. After electrochemical post-hybridization characterization, nucleic acids were electrochemically extracted and analyzed using fluorescent dyes (OliGreen and PicoGreen). It is important to note that fluorescent dye calibration studies have shown that Oli-Green does not only detect ssDNA, but it is sensitive to all DNA in the sample, while PicoGreen primarily labels dsDNA. To prevent ambiguous results, we conducted calibration experiments using combinations of varying ssDNA and dsDNA concentrations that are within the range of DNA amounts quantified in this study. Fluorometric measurements with Oli-Green (total DNA amount) and PicoGreen fluorescent dye (double-stranded DNA) reveal significant amount of unbound DNA molecules within the nanoporous electrodes following the hybridization step (Figure 3b). The results from fluorometric assessment agree with the electrochemical trends (Figure 3a), where with a large amount of residual nucleic acids within the electrodes, the sensor performance deteriorates to the extent of producing reversed % ss at high probe solution concentrations. In addition, the trend for average cleaving current magnitudes obtained from CV desorption curves remains constant across each morphology independent of the probe solution concentration (Figure S7). Since the cleaving current magnitudes are attributed to thiol-bond reduction53, this indicates that accumulation of DNA observed using fluorometric and electrochemical readings may be attributed to the unbound DNA found in the pores.
Figure 3.

a) Percent signal suppression (% ss) for grafting at different probe solution concentrations (0, 0.5, 1, 2, 4, 6, 8 μM) and for three electrode morphologies (unannealed np-Au, annealed np-Au, pl-Au), defined as percent decrease in total charge transfer after hybridization. A positive and zero % ss generally indicate successful hybridization or no target capture respectively, while a negative % ss suggests anomalous sensor behavior. b) Concentration of unbound ssDNA in the porous electrodes after hybridization, determined by subtracting PicoGreen dsDNA fluorescence measurement from OliGreen total DNA measurements.
Effect of Probe Solution Concentration on Interactions between MB and DNA.
The SWV signal after hybridization can be higher than the baseline probe signal only if there are more MB molecules present at the electrodes (hence higher total charge transfer) compared to the pre-hybridization baseline condition. Figure 3b shows that an increase in the amount of residual DNA within porous electrodes (with increasing probe solution concentration) follows the inverse trend observed for % ss in Figure 3a for both morphologies of np-Au, albeit more pronounced for unannealed np-Au. Therefore, it is plausible that reversed % ss phenomenon in np-Au electrodes is caused by high concentration of residual nucleic acids in the pores. As described previously, MB-based nucleic acid detection mechanism is based on the principle that positively-charged MB binds to G-bases only at high ionic strength solution (e.g., 20 mM NaCl35,54), where the negatively-charged phosphate backbone is screened with the sodium counter-ions (Scheme 1a). However, it has also been shown that depending on the nucleic acid concentration and ionic strength within the electrode pores, MB can undergo multiple modes of binding to the DNA hybrid55, so that it does not solely show affinity to the G-bases (Scheme 1b). For example, it can also symmetrically/asymmetrically intercalate56,57, semi-intercalate58,59 and bind to the minor/major groove60–63. In addition, it has been reported that MB can change its electrochemical properties, such as reduction voltage54,64 and extent of reduction65–67, depending on the ionic strength of the solution, electrode surface conditions and its distance from the electrode. Observed widening and tilting of the SWV baseline signal for the unannealed np-Au electrode (Figure 4a), suggests that MB might be undergoing redox reactions at various conditions at high probe solution concentrations (2 – 8 μM). Kelley et al. also suggested that broadening and widening of electrochemical peaks is due to varying reduction potentials due to spatial distribution of MB along the DNA strand68 and within the pore volume. Recall that subtle electrochemical signal amplification (plausibly due to nanoconfinement effects) has been observed earlier (Table 1b) when the electrodes were exposed to MB solution only. The unannealed np-Au pores are in the 10s of nanometer-radius range, in which there could potentially be nanoconfinement effects causing change in the local pore environment69–73. These include change in ionic strength, especially when a pore is crowded with unbound nucleic acids, which would decrease the effective pore size for MB inclusion. In addition, asymmetry in and shifting of the SWV peaks in the case of unannealed np-Au indicate that some MB might be generating an electrochemical signal through physical proximity to the electrode surface by binding to the unbound DNA in the pores as well (Scheme 1b). The same MB concentration (20 μM) used for all experiments, reinforced by the agreement between fluorometric quantification of unbound DNA (Figure 2b and 3b) and electrochemical response (Figure 2a and 3a) indicating a higher unbound DNA amount in unannealed np-Au with increasing grafting solution concentration, suggests that the anomalous SWV shapes are mainly due to the unbound DNA (and its influence on MB-DNA interactions and MB electrochemical properties) rather than unbound residual MB in the pores.
Scheme 1.

a) At low probe solution concentrations, DNA capture probes are sparsely immobilized allowing for target DNA to more efficiently access and hybridize with the probes through the more common G-base-dependent detection mode. b) At high probe solution concentrations, the crowded pore environment with residual DNA molecules alter the modes of DNA-MB interactions, resulting in MB association with both ssDNA and dsDNA, thereby causing an unexpected increase in the electrochemical signal upon hybridization. Figure S8 provides an extended qualitative description of various modes of probe DNA immobilization and hybridization, as well as related electrochemical events for different electrode morphologies.
Figure 4.

SWV probe current for varying probe solution concentration (0, 0.5, 1, 2, 4, 6, 8 μM) for a) unannealed np-Au, b) annealed np-Au and c) pl-Au. SWV probe current plots illustrate the peak shift for the unannealed np-Au, where due to smaller pore size (triggeringnanoconfinement effects), the MB molecules likely undergo additional electrochemical reactions at high nucleic acid concentrations in contrast to annealed np-Au and pl-Au, for which these anomalous behavior is not observed.
Collectively, the complex pore local environment (crowded with residual DNA molecules, especially for unannealed np-Au) and the associated alterations in MB-DNA binding modes may be contributing to the reversed % ss, observed during high probe solution concentrations (Figure S8). It is important to mention that we have previously demonstrated that MCH incubation durations greatly affect the formation of DNA probe monolayer33. That study revealed that higher probe grafting densities require longer MCH incubation durations for proper monolayer formation and target detection, making this yet another factor that should be taken into consideration when optimizing electrochemical sensors with nanostructured electrodes. This is particularly important for electrodes with high aspect-ratio cavities and channel constrictions (e.g., funnel-like structures) that are prone to transport limitations, where longer MCH incubation durations may ensure proper mono-layer formation at the deeper pore surfaces. Finally, extending the rinse durations for nanostructured electrodes with high residual nucleic acid content may reduce molecular crowding inside the pores and improve sensor performance. However, the extended rinse durations may not always be feasible, particularly in the context of point-of-care sensors.
CONCLUSIONS
The goal of this study was to provide insight into transport and electrochemical detection events observed in nanoporous gold (np-Au) electrodes, which were used as a model nanostructured electrode system. The total charge transfer as a measure of immobilized probe DNA (obtained from baseline SWV curve) with respect to the OliGreen quantification of detached/unbound probe DNA showed that while there is a linear increase in probe immobilization with increasing probe solution concentration for pl-Au and annealed np-Au, a secondary trend emerges for unannealed np-Au. It is plausible that DNA transport into the pores is hindered by “funnel-like” constrictions; hence, a larger concentration gradient is necessary to efficiently immobilize the deeper pores of unannealed np-Au and more unbound probe accumulated within the pores for unannealed np-Au. Unlike pl-Au electrode, where once the maximum probe grafting density was reached, the sensor displayed constant performance (steady % ss); in the case of nanostructured electrodes, the sensor reached optimal performance at specific probe concentrations, after which the performance (% ss) rapidly deteriorated. The surprising reversed % ss suggests that there is more total charge transfer compared to the baseline probe signal. This may be an effect of altered MB interactions with DNA molecules within the pores crowded with residual DNA. Fluorometric measurements revealed that, indeed, a significant amount of ssDNA was present in the porous electrodes following hybridization, supporting the possibility of mechanisms discussed for the reversal of % ss polarity. We demonstrated that nanostructured electrochemical sensors exhibit anomalous sensing phenomena compared to smooth electrode-based sensors, particularly for samples with high DNA concentration. By highlighting the importance of determining optimal working conditions, such as probe solution concentration, this study is expected to assist in the design and implementation of other nanostructure-based electrochemical sensors, particularly ones that rely on a signal-off detection mode.
Supplementary Material
ACKNOWLEDGMENTS
We acknowledge funding from National Science Foundation (CBET-1512745, CBET&DMR-1454426), National Institutes of Health (R21 EB024635), and University of California-Davis Comprehensive Cancer Center funds. We acknowledge Barath Palanisamy for assistance with electrochemical cell schematics.
Footnotes
Supporting Information
The Supporting Information is available free of charge on the ACS Publications website at DOI: electrode fabrication details, electrochemical characterization, sensor preparation and detection mechanism, electrochemical extraction plots, analysis of SWV current plots, fluorescent dyes calibration, detection mechanism at low and high probe solution concentration (PDF).
The authors declare no competing financial interest.
REFERENCES
- (1).Laxminarayan R; Duse A; Wattal A Antibiotic Resistance-the Need for Global Solutions (Vol 13,Pg 1057, 2013). Lancet Infect. Dis 2014, 14 (8), 675. [DOI] [PubMed] [Google Scholar]
- (2).Scallan E; Hoekstra RM; Angulo FJ; Tauxe RV; Widdowson MA; Roy SL; Jones JL; Griffin PM Foodborne Illness Acquired in the United States-Major Pathogens. Emerg. Infect. Dis 2011, 17 (1), 7–15. [DOI] [PMC free article] [PubMed] [Google Scholar]
- (3).Niemz A; Ferguson TM; Boyle DS Point-of-Care Nucleic Acid Testing for Infectious Diseases. Trends Biotechnol. 2011, 29 (5), 240–250. [DOI] [PMC free article] [PubMed] [Google Scholar]
- (4).Craw P; Balachandran W Isothermal Nucleic Acid Amplification Technologies for Point-of-Care Diagnostics: A Critical Review. Lab Chip 2012, 12 (14), 2469–2486. [DOI] [PubMed] [Google Scholar]
- (5).Ward E; Foster SJ; Fraaije BA; McCartney HA Plant Pathogen Diagnostics: Immunological and Nucleic Acid-Based Approaches. Ann. Appl. Biol 2004, 145 (1), 1–16. [Google Scholar]
- (6).Meldrum C; Doyle MA; Tothill RW Next-Generation Sequencing for Cancer Diagnostics: A Practical Perspective. Clin. Biochem. Rev 2011, 52 (4), 177–195. [PMC free article] [PubMed] [Google Scholar]
- (7).Cheng MMC, Cuda G, Bunimovich YL, Gaspari M, Heath JR, Hill HD, Mirkin CA, Nijdam AJ, Terracciano R, Thundat T, Ferrari M Nanotechnologies for Biomolecular Detection and Medical Diagnostics. Curr. Opin. Chem. Biol 2006, 10 (1), 11–19. [DOI] [PubMed] [Google Scholar]
- (8).Howorka S; Siwy Z Nanopore Analytics: Sensing of Single Molecules. Chem. Soc. Rev 2009, 8 (38), 2360–2384. [DOI] [PubMed] [Google Scholar]
- (9).Du Y; Dong S Nucleic Acid Biosensors: Recent Advances and Perspectives. Anal. Chem 2017, 89 (1), 189–215. [DOI] [PubMed] [Google Scholar]
- (10).Easley CJ, Karlinsey JM, Bienvenue JM, Legendre LA,, Roper MG, Feldman SH, Hughes MA, Hewlett EL, Merkel TJ, Ferrance JP, Landers JP A Fully Integrated Microfluidic Genetic Analysis System with Sample-in-Answer-out Capability. Proc. Natl. Acad. Sci 2006, 103 (51), 19272–19277. [DOI] [PMC free article] [PubMed] [Google Scholar]
- (11).Tan A; Lim C; Zou S; Ma Q; Gao Z Electrochemical Nucleic Acid Biosensors: From Fabrication to Application. Anal. Methods 2016, 26 (8), 5169–5189. [Google Scholar]
- (12).Smith SJ; Nemr CR; Kelley SO Chemistry-Driven Approaches for Ultrasensitive Nucleic Acid Detection. J. Am. Chem. Soc 2017, 139 (3), 1020–1028. [DOI] [PubMed] [Google Scholar]
- (13).Wang J Electrochemical Nucleic Acid Biosensors. Anal. Chim. Acta 2002, 469 (1), 63–71. [Google Scholar]
- (14).Ferapontova EE DNA Electrochemistry and Electrochemical Sensors for Nucleic Acids. Annu. Rev. Anal. Chem 2018, 11, 197–218. [DOI] [PubMed] [Google Scholar]
- (15).Soleymani L; Fang ZC; Sargent EH; Kelley SO Programming the Detection Limits of Biosensors through Controlled Nanostructuring. Nat. Nanotechnol 2009, 4 (12), 844–848. [DOI] [PubMed] [Google Scholar]
- (16).Lord H; Kelley SO Nanomaterials for Ultrasensitive Electrochemical Nucleic Acids Biosensing. J. Mater. Chem 2009, 19 (20), 3127–3134. [Google Scholar]
- (17).Daggumati P; Matharu Z; Seker E Effect of Nanoporous Gold Thin Film Morphology on Electrochemical DNA Sensing. Anal. Chem 2015, 87 (16), 8149–8156. [DOI] [PubMed] [Google Scholar]
- (18).Nair PR; Alam MA Performance Limits of Nanobiosensors. Appl. Phys. Lett 2006, 88 (23), 233120. [Google Scholar]
- (19).Park SJ; Taton TA; Mirkin CA Array-Based Electrical Detection of DNA with Nanoparticle Probes. Science (80-.). 2002, 295 (5559), 1503–1506. [DOI] [PubMed] [Google Scholar]
- (20).Daggumati P; Matharu Z; Wang L; Seker E Biofouling-Resilient Nanoporous Gold Electrodes for DNA Sensing. Anal. Chem 2015, 87 (17), 8618–8622. [DOI] [PubMed] [Google Scholar]
- (21).Patel J; Radhakrishnan L; Zhao B; Uppalapati B; Daniels RC; Ward KR; Collinson MM Electrochemical Properties of Nanostructured Porous Gold Electrodes in Biofouling Solutions. Anal. Chem 2013, 85 (23), 11610–11618. [DOI] [PubMed] [Google Scholar]
- (22).Pandey B; Demchenko AV; Stine KJ Nanoporous Gold as a Solid Support for Protein Immobilization and Development of an Electrochemical Immunoassay for Prostate Specific Antigen and Carcinoembryonic Antigen. Microchim. Acta 2012, 179 (1–2), 71–81. [DOI] [PMC free article] [PubMed] [Google Scholar]
- (23).Chen LY; Fujita T; Chen MW Biofunctionalized Nanoporous Gold for Electrochemical Biosensors. Electrochim. Acta 2012, 67, 1–5. [Google Scholar]
- (24).Xiao XX; Si PC; Magner E An Overview of Dealloyed Nanoporous Gold in Bioelectrochemistry. Bioelectrochemistry 2016, 109, 117–126. [DOI] [PubMed] [Google Scholar]
- (25).Li Y; Liu Y; Liu J; Liu J; Tang H; Cao C; Zhao D; Ding Y Molecularly Imprinted Polymer Decorated Nanoporous Gold for Highly Selective and Sensitive Electrochemical Sensors. Sci. Rep 2015, 5 (7699), 1–8. [DOI] [PMC free article] [PubMed] [Google Scholar]
- (26).Erlebacher J; Aziz MJ; Karma A; Dimitrov N; Sieradzki K Evolution of Nanoporosity in Dealloying. Nature 2001, 410 (6827), 450–453. [DOI] [PubMed] [Google Scholar]
- (27).Andrade JD; Hlady VL; Vanwagenen RA Effects of Plasma-Protein Adsorption on Protein Conformation and Activity. Pure Appl. Chem 1984, 56 (10), 1345–1350. [Google Scholar]
- (28).White RJ; Phares N; Lubin AA; Xiao Y; Plaxco KW Optimization of Electrochemical Aptamer-Based Sensors via Optimization of Probe Packing Density and Surface Chemistry. Langmuir 2008, 24 (18), 10513–10518. [DOI] [PMC free article] [PubMed] [Google Scholar]
- (29).Riccelli PV Hybridization of Single-Stranded DNA Targets to Immobilized Complementary DNA Probes: Comparison of Hairpin versus Linear Capture Probes. Nucleic Acids Res. 2002, 29 (4), 996–1004. [DOI] [PMC free article] [PubMed] [Google Scholar]
- (30).Peterson AW; Wolf LK; Georgiadis RM Hybridization of Mismatched or Partially Matched DNA at Surfaces. J. Am. Chem. Soc 2002, 124 (49), 14601–14607. [DOI] [PubMed] [Google Scholar]
- (31).Gong P; Lee CY; Gamble LJ; Castner DG; Grainger DW Hybridization Behavior of Mixed DNA/Alkylthiol Monolayers on Gold: Characterization by Surface Plasmon Resonance And32P Radiometric Assay. Anal. Chem 2006, 78 (10), 3326–3334. [DOI] [PMC free article] [PubMed] [Google Scholar]
- (32).Daggumati P; Kurtulus O; Chapman CAR; Dimlioglu D; Seker E Microfabrication of Nanoporous Gold Patterns for Cell-Material Interaction Studies. J. Vis. Exp 2013, 77. [DOI] [PMC free article] [PubMed] [Google Scholar]
- (33).Veselinovic J; Li ZD; Daggumati P; Seker E Electrically Guided DNA Immobilization and Multiplexed DNA Detection with Nanoporous Gold Electrodes. Nanomaterials 2018, 8 (5), 18. [DOI] [PMC free article] [PubMed] [Google Scholar]
- (34).Tan YH; Davis JA; Fujikawa K; Ganesh NV; Demchenko AV; Stine KJ Surface Area and Pore Size Characteristics of Nanoporous Gold Subjected to Thermal, Mechanical, or Surface Modification Studied Using Gas Adsorption Isotherms, Cyclic Voltammetry, Thermogravimetric Analysis, and Scanning Electron Microscopy. J. Mater. Chem 2012, 22, 6733–6745. [DOI] [PMC free article] [PubMed] [Google Scholar]
- (35).Yang W; Ozsoz M; Hibbert DB; Gooding JJ Evidence for the Direct Interaction between Methylene Blue and Guanine Bases Using DNA-Modified Carbon Paste Electrodes. Electroanalysis 2002, 14 (18), 1299–1302. [Google Scholar]
- (36).Kerman K; Ozkan D; Kara P; Meric B; Gooding JJ; Ozsoz M Voltammetric Determination of DNA Hybridization Using Methylene Blue and Self-Assembled Alkanethiol Monolayer on Gold Electrodes. Anal. Chim. Acta 2002, 462 (1), 39–47. [Google Scholar]
- (37).Daggumati P; Appelt S; Matharu Z; Marco ML; Seker E Sequence-Specific Electrical Purification of Nucleic Acids with Nanoporous Gold Electrodes. J. Am. Chem. Soc 2016, 138 (24), 7711–7717. [DOI] [PubMed] [Google Scholar]
- (38).Veselinovic J; Alangari M; Li Y; Matharu Z; Artes JM; Seker E; Hihath J Two-Tiered Electrical Detection, Purification, and Identification of Nucleic Acids in Complex Media. Electrochim. Acta 2019. [Google Scholar]
- (39).Wang J; Rivas G; Jiang M; Zhang X Electrochemically Induced Release of DNA from Gold Ultramicroelectrodes. Langmuir 1999, 15(19), 6541–6545. [Google Scholar]
- (40).Takeishi Shunsaku, Rant Ulrich, Fujiwara Tsuyoshi, Buchholz Karin, Usuki Tatsuya, Arinaga Kenji, Takemoto Kazuya, Yamaguchi Yoshitaka, Tornow Marc, Fujita Shozo, Abstreiter Gerhard, Yokoyama N Observation of Electrostatically Released DNA from Gold Electrodes with Controlled Threshold Voltages. J. Chem. Phys 2004, 120 (12), 5501–5504. [DOI] [PubMed] [Google Scholar]
- (41).Erdem A; Kerman K; Meric B; Ozsoz M Methylene Blue as a Novel Electrochemical Hybridization Indicator. Electroanalysis 2001, 13 (3), 219–223. [Google Scholar]
- (42).Matharu Z; Daggumati P; Wang L; Dorofeeva TS; Li ZD; Seker E Nanoporous-Gold-Based Electrode Morphology Libraries for Investigating Structure-Property Relationships in Nucleic Acid Based Electrochemical Biosensors. ACS Appl. Mater. Interfaces 2017, 9 (15), 12959–12966. [DOI] [PubMed] [Google Scholar]
- (43).Kurtulus O; Daggumati P; Seker E Molecular Release from Patterned Nanoporous Gold Thin Films. Nanoscale 2014, 6 (12), 7062–7071. [DOI] [PubMed] [Google Scholar]
- (44).Dorofeeva TS; Seker E In Situ Electrical Modulation and Monitoring of Nanoporous Gold Morphology. Nanoscale 2016, 8 (47), 19405–19918. [DOI] [PubMed] [Google Scholar]
- (45).Liu Y; McGrath JS; Moore JH; Kolling GL; Papin JA; Swami NS Electrofabricated Biomaterial-Based Capacitor on Nanoporous Gold for Enhanced Redox Amplification. Electrochim. Acta 2019. [Google Scholar]
- (46).Herne TM; Tarlov MJ Characterization of DNA Probes Immobilized on Gold Surfaces. J. Am. Chem. Soc 1997, 119 (38), 8916–8920. [Google Scholar]
- (47).Murphy JN; Cheng AKH; Yu HZ; Bizzotto D On the Nature of DNA Self-Assembled Monolayers on Au: Measuring Surface Heterogeneity with Electrochemical in Situ Fluorescence Microscopy. J. Am. Chem. Soc 2009, 131 (11), 4042–4050. [DOI] [PubMed] [Google Scholar]
- (48).Lao R; Song S; Wu H; Wang L; Zhang Z; He L; Fan C Electrochemical Interrogation of DNA Monolayers on Gold Surfaces. Anal. Chem 2005, 77 (19), 6475–6480. [DOI] [PubMed] [Google Scholar]
- (49).Xiao Y; Lai RY; Plaxco KW Preparation of Electrode-Immobilized, Redox-Modified Oligonucleotides for Electrochemical DNA and Aptamer-Based Sensing. Nat. Protoc 2007, 2 (11), 2875–2880. [DOI] [PubMed] [Google Scholar]
- (50).Wong IY; Melosh NA An Electrostatic Model for DNA Surface Hybridization. Biophys. J 2010, 98 (12), 2954–2963. [DOI] [PMC free article] [PubMed] [Google Scholar]
- (51).Zevenbergen MAG; Singh PS; Goluch ED; Wolfrum BL; Lemay SG Stochastic Sensing of Single Molecules in a Nanofluidic Electrochemical Device. Nano Lett. 2011, 11 (7), 2881–2886. [DOI] [PubMed] [Google Scholar]
- (52).Rassaei L; Mathwig K; Kang S; Heering HA; Lemay SG Integrated Biodetection in a Nanofluidic Device. ACS Nano 2014, 8 (8), 8278–8284. [DOI] [PubMed] [Google Scholar]
- (53).Ho D; Hetrick W; Le N; Chin A; West RM Editors’ Choice—Electric Field-Induced DNA Melting with Detection by Square Wave Voltammetry. J. Electrochem. Soc 2019, 166 (4), B236–B242. [Google Scholar]
- (54).Kara P; Kerman K; Ozkan D; Meric B; Erdem A; Ozkan Z; Ozsoz M Electrochemical Genosensor for the Detection of Interaction between Methylene Blue and DNA. Electrochem. commun 2002, 4 (9), 705–709. [Google Scholar]
- (55).Hossain M; Giri P; Kumar GS DNA Intercalation by Quinacrine and Methylene Blue: A Comparative Binding and Thermodynamic Characterization Study. DNA Cell Biol. 2007, 27 (2), 81–90. [DOI] [PubMed] [Google Scholar]
- (56).Vardevanyan PO; Antonyan AP; Hambardzumyan LA; Shahinyan MA; Karapetian AT Thermodynamic Analysis of DNA Complexes with Methylene Blue, Ethidium Bromide and Hoechst 33258. Biopolym. Cell 2013, 29 (6), 515–520. [Google Scholar]
- (57).Tong C; Hu Z; Wu J Interaction between Methylene Blue and Calfthymus Deoxyribonucleic Acid by Spectroscopic Technologies. J. Fluoresc 2010, 20 (1), 261–267. [DOI] [PubMed] [Google Scholar]
- (58).Vardevanyan PO; Antonyan AP; Parsadanyan MA; Shahinyan MA; Hambardzumyan LA Mechanisms for Binding between Methylene Blue and DNA. J. Appl. Spectrosc 2013, 80 (4), 595–599. [Google Scholar]
- (59).Zhao GC; Zhu JJ; Zhang JJ; Chen HY Voltammetric Studies of the Interaction of Methylene Blue with DNA by Means of p-Cyclodextrin. Anal. Chim. Acta 1999, 394 (2), 337–344. [Google Scholar]
- (60).Nafisi S; Saboury AA; Keramat N; Neault JF; Tajmir-Riahi HA Stability and Structural Features of DNA Intercalation with Ethidium Bromide, Acridine Orange and Methylene Blue. J. Mol. Struct 2007, 827 (1), 35–43. [Google Scholar]
- (61).Parsadanyan MA; Antonyan AP; Vardevanyan PO; Sngryan HE Interaction of Methylene Blue with Synthetic Polynucleotide Poly(DA)-Poly(DT). Biophys. Rev. Lett 2018, 13 (1), 29–36. [Google Scholar]
- (62).Rohs R; Sklenar H; Lavery R; Roder B Methylene Blue Binding to DNA with Alternating GC Base Sequence: A Modeling Study. J. Am. Chem. Soc 2000, 122 (12), 2860–2866. [Google Scholar]
- (63).Rohs R; Sklenar H Methylene Blue Binding to Dna with Alternating at Base Sequence: Minor Groove Binding Is Favored over Intercalation. J. Biomol. Struct. Dyn 2004, 21 (5), 699–711. [DOI] [PubMed] [Google Scholar]
- (64).Koutsoumpeli E; Murray J; Langford D; Bon RS; Johnson S Probing Molecular Interactions with Methylene Blue Derivatized Self-Assembled Monolayers. Sens. Bio-Sensing Res 2015, 6, 1–6. [Google Scholar]
- (65).Barou E; Bouvet M; Heintz O; Meunier-Prest R Electrochemistry of Methylene Blue at an Alkanethiol Modified Electrode. Electrochim. Acta 2012, 75, 387–392. [Google Scholar]
- (66).Barner BJ; Corn RM Electrochemical and Vibrational Spectroscopic Studies of Coadsorption: Formation of Mixed Monolayers of Methylene Blue and Long-Chain Dithioethers at Sulfur-Modified Polycrystalline Gold Surfaces. Langmuir 1990, 6 (5), 1023–1030. [Google Scholar]
- (67).Vardevanyan PO; Antonyan AP; Parsadanyan MA; Torosyan MA; Karapetian AT Joint Interaction of Ethidium Bromide and Methylene Blue with DNA. The Effect of Ionic Strength on Binding Thermodynamic Parameters. J. Biomol. Struct. Dyn 2016, 34 (7), 1377–1382. [DOI] [PubMed] [Google Scholar]
- (68).Kelley SO; Barton JK; Jackson NM; Hill MG Electrochemistry of Methylene Blue Bound to a DNA-Modified Electrode. Bioconjug. Chem 1997, 8 (1), 31–37. [DOI] [PubMed] [Google Scholar]
- (69).Reisner W; Beech JP; Larsen NB; Flyvbjerg H; Kristensen A; Tegenfeldt JO Nanoconfinement-Enhanced Conformational Response of Single DNA Molecules to Changes in Ionic Environment. Phys. Rev. Lett 2007, 99 (5), 058302. [DOI] [PubMed] [Google Scholar]
- (70).Karnik R; Fan R; Yue M; Li D; Yang P; Majumdar A Electrostatic Control of Ions and Molecules in Nanofluidic Transistors. Nano Lett. 2005, 5 (5), 943–948. [DOI] [PubMed] [Google Scholar]
- (71).Vlachy V; Haymet ADJ Salt Exclusion from Charged and Uncharged Micropores. J. Electroanal. Chem 1990, 283 (1–2), 77–85. [Google Scholar]
- (72).Huber P Soft Matter in Hard Confinement: Phase Transition Thermodynamics, Structure, Texture, Diffusion and Flow in Nanoporous Media. J. Phys. Condens. Matter 2015, 27 (10), 103–146. [DOI] [PubMed] [Google Scholar]
- (73).Peng B; Yu YX Ion Distributions, Exclusion Coefficients, and Separation Factors of Electrolytes in a Charged Cylindrical Nanopore: A Partially Perturbative Density Functional Theory Study. J. Chem. Phys 2009, 131 (13), 134703. [DOI] [PubMed] [Google Scholar]
Associated Data
This section collects any data citations, data availability statements, or supplementary materials included in this article.