Abstract
Mass spectrometry imaging (MSI) has the potential to reveal the localization of thousands of biomolecules such as metabolites and lipids in tissue sections. The increase in both mass and spatial resolution of today’s instruments brings on considerable challenges in terms of data processing; accurately extracting meaningful signals from the large data sets generated by MSI without losing information that could be clinically relevant is one of the most fundamental tasks of analysis software. Ion images of the biomolecules are generated by visualizing their intensities in 2-D space using mass spectra collected across the tissue section. The intensities are often calculated by summing each compound’s signal between predefined sets of borders (bins) in the m/z dimension. This approach, however, can result in mixed signals from different compounds in the same bin or splitting the signal from one compound between two adjacent bins, leading to low quality ion images. To remedy this problem, we propose a novel data processing approach. Our approach consists of a sensitive peak detection method able to discover both faint and localized signals by utilizing clusterwise kernel density estimates (KDEs) of peak distributions. We show that our method can recall more ground-truth molecules, molecule fragments, and isotopes than existing methods based on binning. Furthermore, it automatically detects previously reported molecular ions of lipids, including those close in m/z, in an experimental data set.
Mass spectrometry imaging (MSI) is a technique often used to study the localization of known and unknown biomolecules such as lipids, metabolites, or peptides in tissue. Today’s instruments can scan samples with both high spatial and mass spectral resolution and, consequently, generate massive data sets that require highly efficient and accurate processing. Thus, one of the key components of MSI data processing is data-reduction, which typically involves detection and extraction of signals originating from tissue or drug compounds while discarding noise.1,2 The peaks of each spectrum are mapped onto a common reference, and by visualizing the intensities of individual peaks as images the spatial distribution of biomolecules can be revealed. The reference spectrum is generated by detecting peaks which are common to multiple spectra. Accurate peak detection facilitates the isolation of signals from individual compounds which is necessary to obtain high quality images.
Many existing MSI software, such as Cardinal3 and MALDIquant,4 detect isotopic peaks of compounds on a data set mean spectrum and subsequently rank them based on the frequency of their presence in ion image pixels. This method is fast and produces concise peak lists but has limited performance for low-intensity peaks and those localized to small regions in the analyzed tissue section.1 Many tools generate ion images by binning around each peak of interest; the intensity value for each pixel is calculated by summing ion intensities between predefined m/z borders (bins). When doing this, however, it is crucial to use narrow bins to avoid mixing signals from multiple compounds in one image and to ensure that the mass of the peak around which binning is performed is accurate.
Suits et al.5 showed that slicing the entire m/z range into ion images of fixed mass widths enables MSI practitioners to explore MSI data sets in a hypothesis-free manner. This approach sets no threshold on either peak intensity or presence in a minimum number of pixels and is thus not biased toward large or high intensity molecules in the tissue. Choosing bin width is a specificity-sensitivity trade off. A small bin width results in higher sensitivity but increases the risk of peak splitting and a higher number of empty or noninformative ion images. Larger bin widths on the other hand result in fewer noninformative images but are unable to discriminate between compounds that are close in mass, resulting in ion images containing signals from multiple compounds. Unfortunately, even when using relatively large bin widths, slicing leads to impractically large sets of ion-images unless the experimentalist is guided by known ion masses. However, previous studies have demonstrated that incorporating information about the ion-images’ spatial structure in MSI data analysis pipelines is an effective way to automatically separate high and low quality images in these large image sets.6−9
In this paper, we present a peak detection method that enables automatic detection of faint and localized signals as well as high intensity and/or abundant signals. We show that our peak detection can serve as a part of an MSI data analysis pipeline that is both sensitive and specific by combining it with established methods that filter peaks based on their spatial arrangement. A sensitive peak detection algorithm is not only essential for exploratory analysis but also for discovering molecules spatially colocalized with those expected to be present, e.g., drug compounds and metabolites. This is highly relevant in both scientific and clinical settings where drug–tissue interaction and tissue composition are often investigated. To assess and compare the performance of our method to existing MSI data processing tools, we used a rat liver section spiked with several drugs, most of which are anticancer drugs, where the masses of the spiked drugs are used as ground-truth. Using this data set, we show that we are able to detect drug peaks as well as fragment and isotopic peaks, including those that are close in m/z to more intensive and/or abundant peaks. We also used the MSI data set from a mouse bladder section originally presented by Römpp et al.10 to further assess our method.
Materials and Methods
Drug Compounds and Matrix Composition
For the MALDI-MSI experiment, we selected 12 different drugs (see chart in Supporting Information). The drugs were purchased from the LC Laboratories (Woburn, MA; CAS numbers: dabrafenib: 1195765-45-7, dasatinib: 302962-49-8, erlotinib: 183321-74-6, gefitinib: 184475-35-2, imatinib: 152459-95-5, lapatinib: 388082-78-8, pazopanib: 444731-52-6, sorafenib: 284461-73-0, sunitinib: 557795-19-4, trametinib: 871700-17-3, vatalanib: 212141-54-3) and from SelleckChem (Munich, Germany; CAS numbers: ipratropium: 60205-81-4) with >99% purity and were dissolved in methanol (MeOH, (Chromasolv Plus for HPLC) (Sigma-Aldrich, Steinheim, Germany) at 10 mg/mL concentration. These stock solutions were further diluted with 50% MeOH and five mixtures were generated, each containing four different drug compounds. The spreadsheet in Supporting Information summarizes the composition of the five drug mixtures. A 5 mg/mL solution of α-cyano-4-hydroxycinnamic acid (CHCA, Sigma-Aldrich) dissolved in 50% MeOH containing 0.1% trifluoroacetic acid (TFA, Sigma-Aldrich, Steinheim, Germany) was used as matrix solution.
Sample Preparation
For MALDI-MSI, a 10 μm section was cut from frozen rat liver tissue using a cryotome and placed on a glass slide. Then 0.3 μL from each drug mixture was pipetted on the tissue section at predefined positions. After drying of the tissue, CHCA matrix solution was deposited on the tissue surface by an automated pneumatic sprayer (TM-Sprayer, HTX Technologies). The nozzle distance was 46 mm, and the spraying temperature was set to 35 ◦C, the matrix was sprayed (19 passes) over the tissue section at a linear velocity of 750 mm/min with a flow rate set to 0.1 mL/min and a nitrogen pressure set at 10 psi. After each pass, a drying time of 30 s was set on the spraying machine to give time for the sample to dry completely before the next pass. The frozen rat liver tissue was provided by Prof. Roland Andersson (Dept. Clinical Sciences Lund (Surgery), Skane University Hospital, Lund University). Animals were housed and bred according to regulations for the protection of laboratory animals.
MALDI MSI
MSI data was collected by sampling the tissue section with 50 μm raster arrays without laser movement within each measuring position. The dimensions of the measured liver tissue section was approximately 0.9 by 1.2 cm in x, y sampling coordinates. A total of 23 823 sampling positions (x = 247, y = 181) were collected. Full mass spectra were collected using a MALDI LTQ Orbitrap XL mass spectrometer (Thermo Fisher Scientific, Bremen, Germany), equipped with a 60 Hz 337 nm nitrogen pulse laser (LTB Lasertechnik Berlin, Berlin, Germany). This instrument was operated at 60 000 resolution (at m/z 400) collecting spectral data in the mass range of 150–1000 m/z in profile mode generated by 20 laser shots at 10 μJ with automatic gain control switched off. Data were acquired using Xcalibur v 2.0.7. software (Thermo Fisher Scientific, San Jose, CA). The MSI raw data contains mass spectra from all measurement points together with their x, y coordinates.
The Thermo Scientific raw files were first converted to mzML using msconvert and then to imzML(11) format using imzmlConverter. Finally, the imzML data was loaded into MATLAB and analyzed with custom scripts. The mouse bladder data set with PXD001283 ID was downloaded from ProteomeXchange in imzML format.
Peak Picking
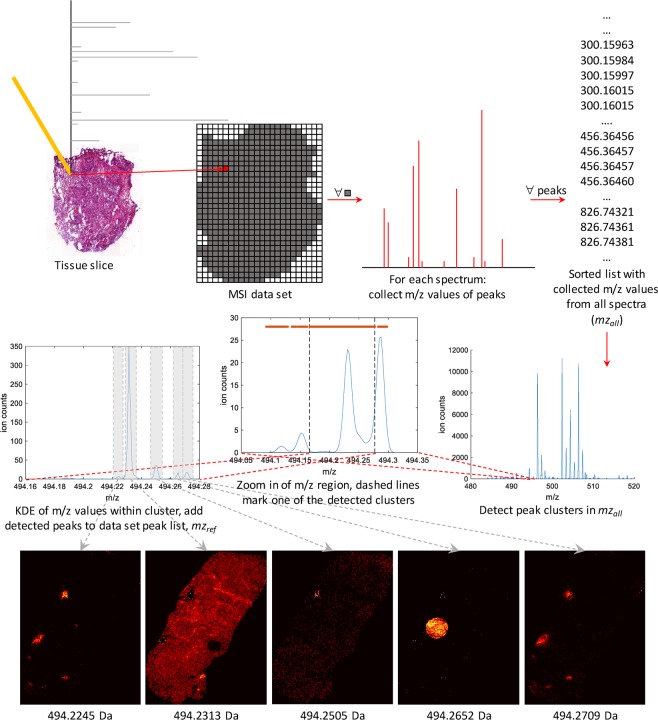
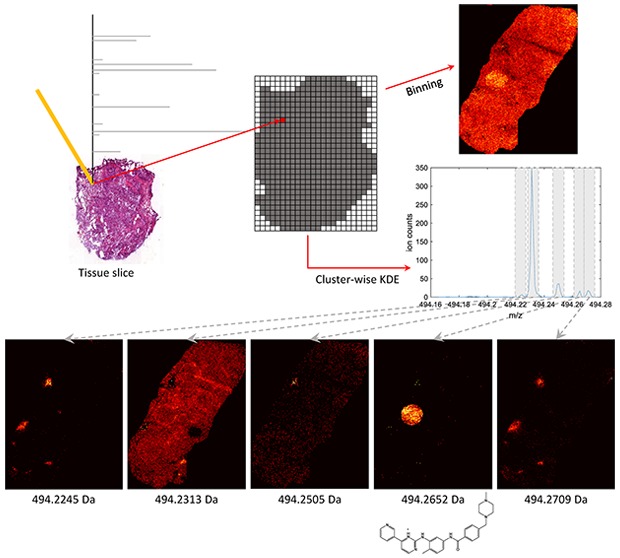
We propose a two-step peak picking scheme: in the first step, candidate peaks are detected on clusters of peak m/z values from all spectra, and in the second, the spatial distribution of the candidate peaks is evaluated and we select those that display a coherent structure. For the first step, we have devised a novel method that relies on clusterwise kernel density estimates (KDEs) of spectral peaks. KDEs are smooth histograms and we use them to estimate the distribution of the peak m/z values within clusters along the m/z axis. The level of smoothness is adapted to each cluster independently. Candidates of data set peaks are then detected as local maxima on the resulting KDE curves. For the second step, we use two established ways to automatically estimate the quality of the images corresponding to peaks obtained in the first step as a means to filter out noninformative peaks. Figure 1 summarizes all parts of our peak picking scheme.
Figure 1.
Flowchart of our peak picking algorithm. m/z values of peaks from each individual spectrum are collected and sorted in mzall. We then identify clusters in mzall as connected components in a directional graph. For each cluster we fit an optimized KDE to the distribution of m/z values. Data set peaks are obtained as local maxima on the resulting KDE curve. Finally, the level of structure in the ion images corresponding to the data set peaks is estimated and used to filter out noise peaks. The peak corresponding to the center ion image, at m/z = 494.2505, is an example of one filtered out in the last step.
Peak Detection
First, we collect the peak masses from every spectrum in one list, mzall, which is then sorted in ascending order. Centroided spectra are taken as input and peaks with heights below a very low intensity threshold are discarded to reduce the impact of background noise. Consequently, mzall will contain most peak masses from the data set. Depending on data set size and RAM availability mzall is processed either in segments or in its entirety. Second, peak clusters in the m/z dimension are identified using a one-dimensional directional graph. If the distance between an m/z value, mi, and the next, mi+1, is smaller than dc, an edge connecting the two is added to the graph. The connected components in the resulting graph represent the m/z clusters. We let dc increase with m/z to account for the peak broadening described by the known theoretical relationship between peak width (at half-maximum) and m/z: dc = f(m/z) where f depends on instrument type.12 Suits et al.13 summarized the relationship between peak width and instrument type. To reduce processing time, we discard clusters containing fewer than a minimum number of peaks. The threshold should be set sufficiently low to retain peaks representing meaningful anatomical structures in the tissue and is therefore dependent on the spatial resolution of the experiment. Finally, to test whether a cluster contains one or more peaks, a KDE is fitted to the distribution of m/z values within the cluster. The kernel bandwidth is optimized for each cluster individually using the normal optimal smoothing method described by Bowman and Azzalini.14 Peaks are detected on the KDE curve in an iterative fashion: first the local maxima are detected and added together with their corresponding heights to a cluster-specific peak list, pkde. The m/z corresponding to the highest peak in this list, mzmax, is added to the global peak list, mzref, and all surrounding peaks in pkde, that fall within dkde including mzmax, are removed. This step is repeated until pkde is empty. The parameter dkde is proportional to the expected peak width of the instrument in the same manner as dc. The ion images are then generated by aligning each centroided spectrum to the resulting reference spectrum mzref, using a nearest neighbor method with maximum drift threshold dependent on the expected theoretical peak width (at half-maximum), similarly to the threshold used when generating edges between peaks in the clustering step.
Peak Selection
Although our method is more directed than slicing the spectra across the m/z range (since it only considers a selection of the m/z regions), it still generates many peaks representing noise in addition to those correlated with actual tissue structures, making it essential to separate the former from the latter. We use the spatial chaos8 (SC) and the principal component analysis (PCA)-based variance explained15 (VE) measures to automatically estimate the level of structure in the ion images. The spatial chaos counts the number of connected objects in an ion image. More structured ion images are expected to have fewer disconnected (separate) objects than unstructured ones. The VE measure is the percentage of total variance explained by the first pair of singular vectors of each ion image. This corresponds to how much of the variation in intensity along one axis of the image is explained by the intensities along the other. The first principal component inherently explains the most variance and, thus, if it explains very little, so will all others. In structured images there is typically an intensity relationship between the axes and therefore their VE is expected to be higher than that of images with randomly distributed intensities, i.e., unstructured images, in which this relationship is unlikely to exist.
Results and Discussion
Two data sets were used to assess the performance of our novel MSI data preprocessing algorithm based on clusterwise peak detection. The first MALDI-MSI data set (referred to as the ”spiked data set”) was generated by spiking a rat liver section with 5 mixtures of 4 ground-truth drugs (12 different compounds in total) in various concentrations. These mixtures were spotted on a rat liver tissue section at five different locations in circular areas of the same size (Figure S1) and, after matrix deposition, the whole tissue section was analyzed by MALDI-MSI using 50 μm spatial resolution. The concentrations of the drug compounds covered an intensity range of 3 orders of magnitude between trametinib (1.70 × 10⁴) and ipratropium (1.49 × 10⁷). Furthermore, some of the ground-truth drugs such as erlotinib and dasatinib, were spotted at multiple locations in different concentrations. The second data set, originally from Römpp et al.,10 comes from a mouse bladder section and was downloaded from ProteomeXchange (XD001283). This MSI data set was generated by a LTQ Orbitrap instrument with an ion source built in-house used to scan the mouse bladder section with 10 μm spatial resolution. The authors of this study presented the ion images of 11 compounds. These images were generated with a narrow bin width of 0.01 Da. For this data set, we use the mass of these compounds as ground truth, i.e., peaks known to be present.
Recall of Known Compounds
We applied Cardinal, MALDIquant, slicing the spectra into 0.05 Da bins, and our clusterwise peak detection method to the spiked data set to compare their ability to recall compounds. The difference between the known mass of each ground-truth drug and the mass of the closest detected peak is used as the measure of accuracy for Cardinal and our method. The ion images corresponding to the monoisotopic peak of the ground-truth drugs were manually evaluated to confirm that a compound had been correctly found. First, we ran Cardinal and detected 4751 peaks; we did not filter out those with too low pixel frequency. The corresponding ion images were generated by binning around each peak. Eight of the 12 compounds were detected with a mass deviation ranging between 4.23 and 198.85 ppm (mean 83.983 ppm). Figure S2 shows the ion images of the drug compounds generated by Cardinal. The ion images of erlotinib (394.176 Da) and geftinib (447.160 Da) are contaminated with signal from other compounds while sunitinib (399.220 Da), imatinib (494.267 Da), and trametinib (616.086 Da) are completely missed. Second, we used MALDIquant to compute a mean spectrum on which we detected 521 peaks. Only the peak from the drug with the highest measured intensity, ipratropium, was found with a mass deviation of 4.7145 ppm. The ion image corresponding to the monoisotopic peak of iptratropium indicates that this compound has diffused from the spotting location and because of this covers a significantly larger region of the tissue than the other compounds; this might contribute to its presence in the mean spectrum which favors signals that have high intensity and/or pixel frequency. Third, we sliced the spectra with a bin width of 0.05 Da across the 150–1000 m/z range resulting in 17 000 slices. To asses the sensitivity of the slicing approach we manually examined the ion images corresponding to the slices containing the m/z of the spiked-in drug compounds (Figure S3). The signal from trametinib (616.086) is missed and those from erlotinib (394.176 Da) and imatinib (494.267 Da) are mixed with others, resulting in contaminated ion images. Finally, when applying our method, we identified 3148 m/z clusters in the data set peak list and on the KDEs of these we detected 6088 peaks. We used a value of 0.2 times the theoretical peak width at half-maximum for dc, the parameter controlling the maximum distance between connected points that form the m/z clusters. Decreasing or increasing dc between 0.1 and 0.5 results in a higher or lower number of clusters, respectively, but ultimately has little impact on the final peak list. All of the 12 spiked-in compounds are detected with mass deviations ranging between 1.00 and 4.29 ppm (mean 2.598 ppm). Figure S4 shows the ion images corresponding to the monoisotopic peaks of the drug compounds generated by our method. The signal from trametinib is weak but detected nevertheless; it had the lowest measured intensity which can explain its absence in some of the spectra. Generally, the quality of images generated with our approach is higher than that of the images generated with Cardinal or by slicing. The drug signals are clearly visible against the background, and there is no contamination with signals from other compounds, background, or matrix. Table S1 shows the mass deviations of the detected peaks corresponding to the spiked-in drugs obtained with Cardinal and our algorithm. The corresponding ion images are shown in Figure S2 and Figure S4, respectively.
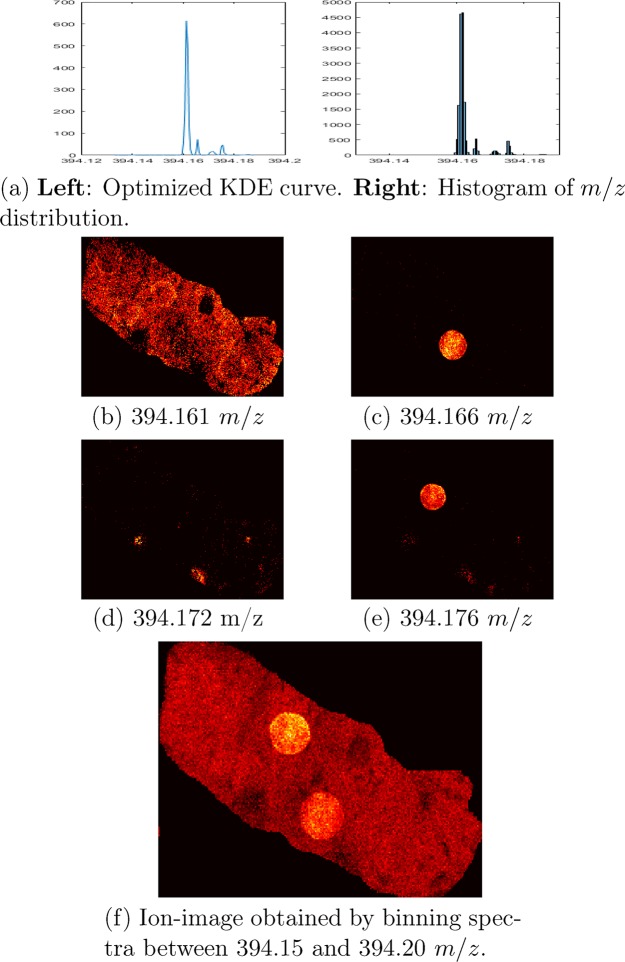
An example of a cluster with densely located molecule signals is that containing erlotinib (394.176 Da) (Figure 2a). There are four distinctive signals within this relatively narrow m/z window (0.04 Da) at 394.161, 394.166, 394.172, and 394.176 m/z with interpeak distances of 13, 15, and 10 ppm. The peak at 394.161 m/z is tissue-derived while those at 394.166 m/z and 394.172 come from a fragment molecule of imatinib and the matrix, respectively. Using our method we are able separate the four peaks and generate a clean image for each of them. Figure 2b–e shows the ion images related to these peaks. If the spectra are binned between 394.150 and 394.200 m/z instead, the signals from three of the four compounds appear in the same ion image, i.e., they are incorrectly combined into one ion-image while that from the peak at 394.172 m/z is invisible (Figure 2f) due to its low intensity compared to the other three. We found that a value between 0.25–0.5 times the theoretical peak width at half-maximum is a good choice for dkde, the parameter controlling the minimum distance between two adjacent peaks on the KDE curve. Using a higher value results in fewer noise peaks, however, we lose true peaks, e.g., those from imatinib and erlotinib. Because of this, we recommend using a small dkde to delay filtering out noise peaks until after alignment by using one of the spatial distribution based peak selection methods. The kernel bandwidth used when generating the cluster KDEs is optimized for each cluster individually to account for the variability in peak density. This parameter determines the level of smoothing when estimating the distribution of the peak masses within the clusters. Similarly to dkde, using a higher bandwidth results in less noisy data, however, may lead to losing true peaks or mixing signals from multiple compounds.
Figure 2.
(a) The distribution of m/z peak values within the cluster containing erlotinib (m/z 394.176). (b–e) The ion images that correspond to the four peaks on the KDE curve. (f) The ion image obtained by binning the spectra between 394.15 and 394.20 m/z; this image demonstrates how four signals can be mixed in the same ion image and even when a relatively narrow m/z window is used.
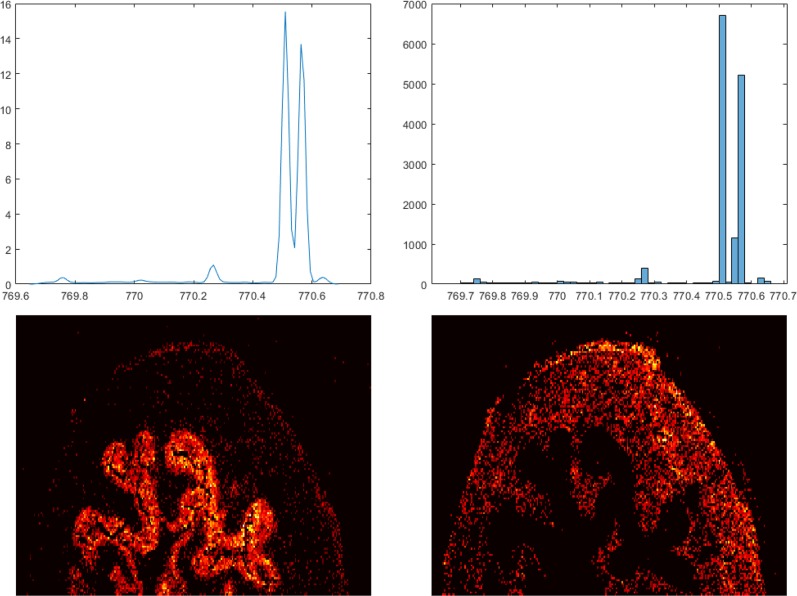
We also applied our cluster-based peak detection method to the high spatial resolution mouse bladder data set. In this data set we detected 1702 m/z clusters and 6482 peaks. We then filtered out peaks which were present in fewer than 200 of the 33 000 spectra, resulting in a final list of 1024 data set peaks. The original paper reported 11 ion images that were manually generated by binning around peaks with known m/z using a very narrow bin width of 0.01 Da. All peaks corresponding to these ion images are found by our peak detection method in an unsupervised fashion, including the two densely located peaks at 770.5097 and 770.5698 m/z originating from the K+ adduct of PC(32:1) [phosphatidylcholine] and an isotope of the K+ adduct of SM(36:1), [sphingosylphosphorylcholine], respectively (Figure 3). Figure S5 shows the ion images related to the 11 detected peaks.
Figure 3.
Distribution of peak m/z values within the cluster containing PC (32:1) (770.5109 m/z) and SM(18:0) (770.5609 m/z). The ion images corresponding to the two highest peaks on the KDE curve are shown in the bottom left and bottom right.
Peak Selection
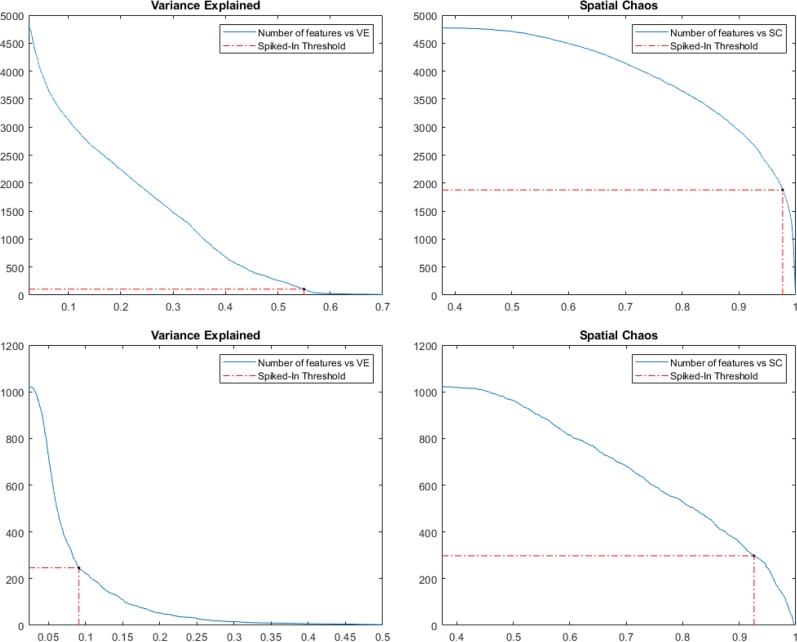
As previously mentioned, we find more than 6000 peaks in the rat liver data set with our cluster-based peak detection, resulting in an equal number of ion images. Manually evaluating each image is impractically slow, but by computing the spatial chaos (SC) and the variance explained (VE) for all ion images, including those of the compounds known to be present, we can estimate how much we can reduce the number of images without losing relevant information. For each data set, we took the VE and SC scores of the ion images corresponding to the known compounds and used their mean scores minus two standard deviations as low-end thresholds. The number of peaks whose images had scores above these thresholds indicates how many of the detected peaks should be kept and how many can be rejected as noise. In the spiked data set this filtering resulted in a final list of 843 and 2170 peaks when we filtered based on VE and SC scores, respectively. The numbers of peaks obtained for the mouse bladder data set are 418 and 288 for VE and SC, respectively. The number of ion images whose VE or SC score is above various thresholds is shown in Figure 4. The number of peaks can potentially be further reduced if off-tissue regions are available; biologically irrelevant peaks, such as those coming from solvents or the matrix, can be filtered out since their signal often is stronger in these regions.15
Figure 4.
Number of ion images surviving varying thresholds on the VE and SC scores in the two data sets. Dashed lines mark the lowest scores (excluding the low quality image for m/z 616.127) of the ion images corresponding to the drugs in the spiked data set (top) and known compounds in the mouse bladder data set (bottom).
Despite its simplicity, the VE score proved to be very effective in ranking the quality of the ion images generated from both the spiked and mouse bladder data sets. Specifically, VE favors images which have intensities localized to small regions, e.g., all of the spiked-in compounds in the spiked data set and heme b, M+ at m/z = 616 (Figure S5c) in the mouse bladder data set. In contrast, ion images with high levels of structure across the entire scanned region tend to be rewarded with the highest SC scores, making it suitable as a general measure of image quality but less effective than the VE score in identifying ion images with localized structured intensity patterns. The two scores appeared to be partially complementary to each other; the Pearson correlation between the VE and SC scores in the spiked and mouse bladder data sets were 0.6158 and 0.4821, respectively. Tables 1 and 2 show the VE and SC scores of the ion images corresponding to the ground truth compounds in the spiked and mouse bladder data sets, respectively.
Table 1. VE and SC Scores of the Ion Images Corresponding to the Spiked-in Drug Compound in the Spiked Data Set and Their Corresponding Rank among the 4771 Ion Images That Remain after Removing Those with Fewer Than 400 Nonzero Pixels.
| compound | mass | VE | percentile | rank (VE) | SC | percentile | rank (SC) |
|---|---|---|---|---|---|---|---|
| ipratropium | 332.223 | 0.5997 | 99.43 | 27 | 0.9997 | 99.94 | 3 |
| vatalanib | 347.107 | 0.7183 | 99.79 | 10 | 0.9952 | 79.29 | 988 |
| erlotinib | 394.177 | 0.7837 | 99.85 | 7 | 0.9775 | 61.04 | 1859 |
| sunitinib | 399.220 | 0.6845 | 99.73 | 13 | 0.9921 | 72.23 | 1325 |
| pazopanib | 438.171 | 0.8853 | 99.98 | 1 | 0.9837 | 64.60 | 1689 |
| gefitinib | 447.160 | 0.8362 | 99.92 | 4 | 0.9948 | 78.22 | 1039 |
| sorafenib | 465.094 | 0.8328 | 99.90 | 5 | 0.9951 | 79.04 | 1000 |
| dasatinib | 488.164 | 0.6400 | 99.62 | 18 | 0.9980 | 92.10 | 377 |
| imatinib | 494.267 | 0.7611 | 99.81 | 9 | 0.9766 | 60.64 | 1878 |
| dabrafinib | 520.109 | 0.5499 | 97.78 | 106 | 0.9964 | 83.29 | 797 |
| lapatinib | 581.143 | 0.6715 | 99.69 | 15 | 0.9775 | 60.97 | 1862 |
| trametinib | 616.086 | 0.1696 | 70.72 | 1397 | 0.9038 | 53.07 | 2239 |
Table 2. VE and SC Scores of the Ion Images Corresponding to the 11 Compounds Reported by Römpp et al.10 and Their Corresponding Rank among the 1053 Candidate Ion Images That Remain after Removing Those with Fewer Than 200 Nonzero Pixels.
| compound | mass | VE | percentile | rank (VE) | SC | percentile | rank (SC) |
|---|---|---|---|---|---|---|---|
| LPC (16:0), [M + K]+ | 535.296 | 0.1770 | 92.76 | 74 | 0.9897 | 94.52 | 56 |
| LPC (18:0), [M + K]+ | 562.327 | 0.2732 | 98.14 | 19 | 0.9964 | 99.12 | 9 |
| heme b, M+ | 616.177 | 0.2385 | 96.67 | 34 | 0.9261 | 70.84 | 298 |
| unknown | 713.452 | 0.0911 | 75.93 | 246 | 0.9444 | 73.68 | 269 |
| SM (16:0) | 742.531 | 0.2140 | 95.50 | 46 | 0.9953 | 98.24 | 18 |
| unknown | 743.548 | 0.1921 | 94.42 | 57 | 0.9691 | 84.34 | 160 |
| PC(32:1), [M + K] | 770.507 | 0.2688 | 97.95 | 21 | 0.9814 | 88.85 | 114 |
| SM(18:0), [M + K] | 770.565 | 0.1439 | 87.87 | 124 | 0.9849 | 90.90 | 93 |
| PC (32:0),[M + K]+ | 772.525 | 0.3177 | 98.83 | 12 | 0.9975 | 99.80 | 2 |
| PC (34:1), [M + K]+ | 798.541 | 0.3383 | 99.02 | 10 | 0.9979 | 99.90 | 1 |
| PE(38:1) | 812.557 | 0.1623 | 91.39 | 88 | 0.9909 | 95.21 | 49 |
Detection of Fragments and Isotopes
MALDI-MSI is an important tool often used to investigate the distribution of drugs and drug metabolites in tissue during pharmaceutical research, and obtaining comprehensive lists of interacting molecules is crucial during their development. To this end, we further assessed the performance of our peak detection method by searching for molecules colocalized with the drugs in the spiked data set. Colocalization analysis can be performed by computing the Pearson correlation coefficient between the ion image of a peak of interest and all other images.5,16,17 For each drug compound, we computed the correlation coefficient between the ion image corresponding to its monoisotopic peak and every ion image from the full image sets generated using the peaks found with our clusterwise peak detection method and that generated by slicing, without performing peak filtering based on spatial distribution. We manually assessed images whose correlation coefficient was ≥0.5 to search for candidate fragments and isotopes with spatial intensity distributions matching those of the drugs. The m/z of the matching images and existing knowledge about the theoretical fragmentation pattern of the drugs were then used to identify the fragments. This resulted in the identification of 46 isotopes and fragments in the ion image set generated by our method and 32 in the set generated by slicing. We gain an additional 14 fragments and isotopes when using our peak detection approach compared to when slicing the spectra with a bin width of 0.05 Da.
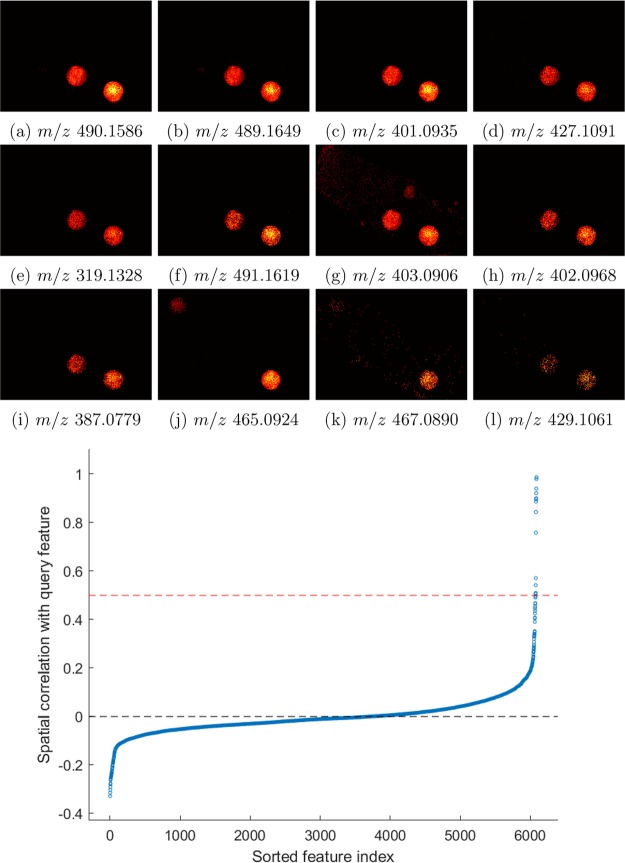
The correlation analysis result of dasatinib is shown in Figure 5. In total, 12 ion images have a correlation coefficient ≥0.5. The nine most correlated images (≥0.75) consist of three isotopes of dasatinib with an m/z of 489.165, 490.159, and 491.162, and six fragments with an m/z of 319.133, 387.078, 401.094, 402.097, 403.091, and 427.110. The fragments’ and isotopes’ ion images show minimal signal mixing with other compounds as shown in Figure 5. The remaining three consist of another fragment of dasatinib with an m/z of 429.106 and a correlation coefficient of 0.5422 and two ion images related to sorafinib. The indentified fragments and results of the correlation analysis are presented in Supporting Information spreadsheet and Figures S6–S16. We also assessed the most anticorrelated images to investigate whether there was evidence of ion suppression from any of the ground-truth drugs. However, no images uniquely anticorrelated to any one of the spiking spots were found. Instead, these images were anticorrelated to all spiking spots simultaneously, indicating that they are the result of washing or ion suppression from the solvent used in the drug mixtures.
Figure 5.
Top: The ion images of the 12 most correlated peaks to dasatinib’s monoisotopic peak. Panels a–i and l are isotopes or fragments of dasatinib while panels j and k are related to sorafenib. Bottom: Sorted Pearson correlation between all ion images and that of the monoisotopic peak of dasatinib.
Conclusions
In this paper we have presented an efficient peak picking approach combining a novel peak detection algorithm with filtering based on spatial information to automatically identify ion images corresponding to isotopic peaks of both endogenous and drug compounds in high-resolution MSI data sets. It should be noted that these data sets were generated using high-resolution Orbitrap MSI, which is low-pass-filtered during acquisition by default. Applying our method to noisier data such as that generated by QTOF MSI would require additional preprocessing such as baseline removal and smoothing. Our KDE clusterwise peak detection algorithm enables us to find low intensity and localized peaks with minimal contamination from other peaks close in m/z, resulting in high ion image quality. We believe that implementing our MSI preprocessing algorithm in an interactive tool would be valuable to experimentalists who aim to identify a priori unknown endogenous compounds, reveal drug distributions in tissue, or find compounds that spatially correlate to known ones. Such a tool could help users gain deeper insight into the effect of drugs in tissue and considerably reduce the number of ion images that have to be examined manually.
Acknowledgments
We thank Frank Suits for his support and insightful discussions throughout the project and we kindly acknowledge the support from Fru Berta Kamprads Stiftelse.
Supporting Information Available
The Supporting Information is available free of charge on the ACS Publications website at DOI: 10.1021/acs.analchem.9b02637.
The authors declare no competing financial interest.
Supplementary Material
References
- Jones E. A.; Deininger S.-O.; Hogendoorn P. C.; Deelder A. M.; McDonnell L. A. J. Proteomics 2012, 75, 4962–4989. 10.1016/j.jprot.2012.06.014. [DOI] [PubMed] [Google Scholar]
- Gessel M. M.; Norris J. L.; Caprioli R. M. J. Proteomics 2014, 107, 71–82. 10.1016/j.jprot.2014.03.021. [DOI] [PMC free article] [PubMed] [Google Scholar]
- Bemis K. D.; Harry A.; Eberlin L. S.; Ferreira C.; van de Ven S. M.; Mallick P.; Stolowitz M.; Vitek O. Bioinformatics 2015, 31, 2418–2420. 10.1093/bioinformatics/btv146. [DOI] [PMC free article] [PubMed] [Google Scholar]
- Gibb S.; Strimmer K. Bioinformatics 2012, 28, 2270–2271. 10.1093/bioinformatics/bts447. [DOI] [PubMed] [Google Scholar]
- Suits F.; Fehniger T. E.; Végvári Á.; Marko-Varga G.; Horvatovich P. Anal. Chem. 2013, 85, 4398–4404. 10.1021/ac303658t. [DOI] [PubMed] [Google Scholar]
- Alexandrov T.; Bartels A. Bioinformatics 2013, 29, 2335–2342. 10.1093/bioinformatics/btt388. [DOI] [PubMed] [Google Scholar]
- Wijetunge C. D.; Saeed I.; Boughton B. A.; Spraggins J. M.; Caprioli R. M.; Bacic A.; Roessner U.; Halgamuge S. K. Bioinformatics 2015, 31, 3198–3206. 10.1093/bioinformatics/btv356. [DOI] [PubMed] [Google Scholar]
- Palmer A.; Phapale P.; Chernyavsky I.; Lavigne R.; Fay D.; Tarasov A.; Kovalev V.; Fuchser J.; Nikolenko S.; Pineau C.; Becker M.; Alexandrov T. Nat. Methods 2017, 14, 57. 10.1038/nmeth.4072. [DOI] [PubMed] [Google Scholar]
- Inglese P.; Correia G.; Takats Z.; Nicholson J. K.; Glen R. C. Bioinformatics 2019, 35, 178–180. 10.1093/bioinformatics/bty622. [DOI] [PMC free article] [PubMed] [Google Scholar]
- Römpp A.; Guenther S.; Schober Y.; Schulz O.; Takats Z.; Kummer W.; Spengler B. Angew. Chem., Int. Ed. 2010, 49, 3834–3838. 10.1002/anie.200905559. [DOI] [PubMed] [Google Scholar]
- Schramm T.; Hester A.; Klinkert I.; Both J.-P.; Heeren R. M.; Brunelle A.; Laprévote O.; Desbenoit N.; Robbe M.-F.; Stoeckli M.; Spengler B.; Römpp A. J. Proteomics 2012, 75, 5106–5110. 10.1016/j.jprot.2012.07.026. [DOI] [PubMed] [Google Scholar]
- Hoffman E. D.; Stroobant V.. West Sussex; John Wiley & Sons, Bruxellas, Bélgica, 2007, 1, 85. [Google Scholar]
- Suits F.; Hoekman B.; Rosenling T.; Bischoff R.; Horvatovich P. Anal. Chem. 2011, 83, 7786–7794. 10.1021/ac201332j. [DOI] [PubMed] [Google Scholar]
- Bowman A. W.; Azzalini A.. Applied smoothing techniques for data analysis: the kernel approach with S-Plus illustrations; OUP Oxford, 1997; Vol. 18. [Google Scholar]
- Fonville J. M.; Carter C.; Cloarec O.; Nicholson J. K.; Lindon J. C.; Bunch J.; Holmes E. Anal. Chem. 2012, 84, 1310–1319. 10.1021/ac201767g. [DOI] [PubMed] [Google Scholar]
- Nemes P.; Woods A. S.; Vertes A. Anal. Chem. 2010, 82, 982–988. 10.1021/ac902245p. [DOI] [PMC free article] [PubMed] [Google Scholar]
- Fehniger T. E.; Suits F.; Végvári Á.; Horvatovich P.; Foster M.; Marko-Varga G. Proteomics 2014, 14, 862–871. 10.1002/pmic.201300431. [DOI] [PubMed] [Google Scholar]
Associated Data
This section collects any data citations, data availability statements, or supplementary materials included in this article.


