

Abstract
Background
Hepatitis B virus (HBV) infection is a major public health problem in China. Over a decade has passed since the last National Hepatitis Seroepidemiological Survey was conducted in 2006. The lack of updated data on hepatitis B in China makes assessing the current prevalence and burden of the disease inadequate. In response to the above situation, a systematic review and meta-analysis was conducted to provide a better understanding of hepatitis B epidemiology in the general population of China.
Methods
A systematic search was conducted in international databases (Medline through PubMed, EMBASE, Cochrane, Web of Science) and national databases (CBM, CNKI, WanFang Data) to retrieve primary studies published between January 1, 2013 and December 31, 2017. The pooled prevalence of HBV infection and 95% confidence intervals were calculated. Quality assessment, heterogeneity testing and publication bias assessment were also performed.
Results
Of the 27 studies included in the meta-analysis, the pooled estimated prevalence of HBV infection in the general population of China from 2013 to 2017 was 6.89% (95% CI:5.84–7.95%), which could be extrapolated to an estimated population of 84 million living with HBsAg in 2018. The prevalence of HBV infection in males was higher than that in females (5.88% vs 5.05%), and rural areas had a higher prevalence than urban areas (5.86% vs 3.29%). The highest prevalence of HBV infection was reported in Western provinces (8.92, 95% CI: 7.19–10.64%). In adults older than 20 years, the prevalence of HBV infection was approximately 7%, which was higher than that in children.
Conclusion
The prevalence of HBV infection in the general population of China was classified as higher intermediate prevalence (5–7.99%), of which more than 90% of the HBV infection population included adults older than 20 years. The blocking of mother-to-infant hepatitis B transmission and plans involving timely birth dose of hepatitis B vaccine within 24 h should be implemented. Additionally, improving the quality of life and survival rate of the infected population through antiviral therapy and high-risk adult vaccination will be the priority of our future work. Moreover, various control measures should be implemented in different provinces across China.
Electronic supplementary material
The online version of this article (10.1186/s12879-019-4428-y) contains supplementary material, which is available to authorized users.
Keywords: Hepatitis B, Meta-analysis, Prevalence, China
Background
Hepatitis B virus (HBV) infection is a major global public health problem and nearly 2.57 billion people worldwide are estimated to be infected with HBV [1, 2]. People chronically infected with HBV are at an increased risk of developing HBV-related liver diseases, including hepatic cirrhosis and hepatocellular carcinoma (HCC) [3, 4]. Without a more extensive prevention method, it is expected that the number of people infected with hepatitis B will remain at the current level. The estimated annual mortality of hepatitis B is more than 780,000 worldwide [1, 2]. The frequency of HBV infection is different throughout the world [5]. High prevalence areas are defined as areas wherein more than 8% of the population is positive for the hepatitis B surface antigen (HBsAg); higher intermediate prevalence areas are defined as areas wherein 5–7.99% of the population is HBsAg positive; lower intermediate prevalence areas are defined as areas wherein 2–4.99% of the population is HBsAg positive; and low prevalence areas are defined as areas wherein less than 2% of the population is HBsAg positive [5–7].
In 1992, the first Chinese National Hepatitis Seroepidemiological Survey found that the prevalence of HBsAg among population aged 1–59 years was 9.75%, which indicated a hepatitis B high prevalence area. Based on this survey, it was estimated that 120 million people carried HBsAg, 20 million suffered from chronic hepatitis B, and almost 300,000 died annually from chronic consequences of HBV infection in China [8–10]. Since then, the Ministry of Health has recommended hepatitis B vaccine for routine immunization of infants in 1992 and has integrated hepatitis B vaccine into EPI in 2002, with an emphasis on providing a timely birth dose (within 24 h of birth) [11]. In 2006, the second Chinese National Hepatitis Seroepidemiological Survey found that the prevalence of HBsAg for population aged 1–59 years decreased to 7.18%, which indicated that an estimated 16–20 million HBV carriers were prevented from infection through hepatitis B vaccination of infants [11]. However, it was estimated that there were more than 93 million chronic HBV infections in 2006 which resulted in a public health issue [11]. From 2006 to 2017, over a decade has passed. Unfortunately, no investigations have been conducted at the country level. Aparna Schweitzer systematically reviewed the status of chronic HBV infection around the world from 1965 to 2013 and estimated that the prevalence of hepatitis B infection in China was 5.49% until 2013 [5]. The lack of updated data on hepatitis B in China makes assessing the current prevalence and burden of the disease inadequate, and results in ineffective policy making. Therefore, a systematic review and meta-analysis based on data published in the last 5 years (2013–2017) was conducted to provide a better understanding of hepatitis B epidemiology in the general population of China.
Methods
Search strategy
This systematic review and meta-analysis on hepatitis B prevalence data was conducted following the criteria of the PRISMA (Preferred Reporting Items for Systematic Reviews and Meta-Analyses) statement guidelines [12]. International databases (Medline through PubMed, EMBASE, Cochrane, and Web of Science) and national databases (Chinese Biomedical Database (CBM), China National Knowledge Infrastructure (CNKI), and WanFang Data) were searched for all published literature between January 1, 2013 and December 31, 2017. During the search, the following keywords were used: [“HBsAg” OR “hepatitis B” OR “Hepatitis B virus” OR “HBV”] AND [“prevalence” OR “prevalent” OR “epidemic” OR “epidemiology” OR “carrier” OR “positive rate” OR “infection rate”] AND [“Chinese” OR “China”] AND [(“2013”[Date - Publication]: “2017”[Date - Publication])].
Inclusion and exclusion criteria
All articles that reported cross-sectional studies on the general population tested for HBsAg in different regions of China were included. All articles were published from 2013 to 2017. The inclusion criteria were restricted to original research articles published in English or Chinese. The exclusion criteria were the following: (1) conference abstracts, case reports, surveillance reports, and systematic reviews or meta-analyses; (2) study designes with non-random sampling; (3) studies that did not include the positive rate of HBsAg; (4) sample sizes of less than 800 people or studies conducted in only a rural area; (5) study populations coinfected with HBV, HCV and HIV.
Data extraction and quality assessment
The data were extracted by two independent reviewers (GP and YQL). The titles and abstracts were screened for relevance. After a review of the full-text articles, the following data were extracted from each study: study name, first author, publication year, study design, province or city, sex, age, sample size, number of HBsAg positive individuals and HBsAg test methods. The references of all identified full-text articles were also checked to identify whether there were any additional articles that were missed during screening. Each of the two independent reviewers read the full-text articles and extracted the data. Any inconsistencies and disagreements between the two independent reviewers were resolved through discussion or consultation with the third reviewer (WH).
The quality of all included articles was assessed using the Cross-Sectional/Prevalence Study Quality Assessment Forms which were recommended by the Agency for Healthcare Research and Quality (AHRQ) [13]. In the AHRQ form (Additional file 1: Table S1), there are eleven questions, of which ten questions are fitted for cross-sectional studies, i.e., the questions were answered with “Yes”, “No” and “Unclear”. “Yes” represented a score of 1 and “No” or “Unclear” represented a score of 0. The last question was fitted for follow-up studies was not covered in our study. In the meta-analysis, the total score of the ten questions in the AHRQ form was used to assess the quality of each full-text article.
Statistical analysis
Statistical analysis was performed by Stata software (Version 13.0, Stata Corp, College Station, TX, USA). The prevalence rate of hepatitis B was defined as the positive rate of HBsAg. Individual proportions and the HBV pooled prevalence were assessed at 95% confidence interval (95% CI) and was showed by a forest plot. We performed subgroup analyses on all articles according to different regions, age groups, sexes, and urban or rural areas. According to the geographical location, China is divided into three parts: Eastern, Middle and Western. According to household registration statistics, China is divided into rural and urban areas. Heterogeneity testing was performed using the degree of inconsistency(I2). The degree of heterogeneity was classified to three levels (minimal, I2 < 25%; moderate, 25% ≤ I2 < 50%; substantial, and I2 ≥ 50%) [14]. If no significant heterogeneity was detected (P > 0.05 and I2 < 50%), a fixed effect model was used to calculate the HBV pooled prevalence and 95% CI. Otherwise, a random effect model was used. Subgroup analysis was used to minimize heterogeneity and provided more details on the HBV infection. Publication bias was assessed graphically by funnel plot and formally by Egger’s test (significance at P < 0.05) [15]. The national total population data in 2018 were from the National Bureau of Statistics.
Results
Study general scope
A total of 1151 English articles and 690 Chinese articles were identified through 7 database searches. Following the removal of duplicates, primary screening and screening titles or abstracts, 70 publications were reviewed in full text. A total sample size of 5,422,405 people in 27 articles met the eligibility criteria and were therefore included in the meta-analysis (Fig. 1). All included articles [16–42] were cross-sectional studies (Table 1). The sample size was between 904 and 1,966,013. The regional distributions were Eastern (including 16 studies), Middle (including 7 studies) and Western (including 9 studies). The area (urban/rural) distribution was urban (including 10 studies) and rural (including 16 studies). In terms of quality, all studies (100%) had a total quality score higher than 4. 17 studies in 27 studies (62.96%) had a total quality score higher than 5 (Additional file 2: Table S2).
Fig. 1.

Flow diagram of study selection
Table 1.
Characteristics of the studies included in the meta-analysis
| Author, Year | Year of Publication | Study Design |
Province or City | Age group | Sample Size(N) | HBsAg Positive(n) | Method | Quality Grade |
|---|---|---|---|---|---|---|---|---|
| Min DY et al. [16] | 2016 | Cross-sectional | Gui Zhou province | ≥16 | 1629 | 136 | TRFIA | 4 |
| Xia W et al. [17] | 2015 | Cross-sectional | Hu Nan province | 1–59 | 9536 | 498 | ELISA | 4 |
| Cai HL et al. [18] | 2017 | Cross-sectional | Ning Xia province | 55–79 | 6582 | 919 | ELISA | 4 |
| Bai S et al. [19] | 2017 | Cross-sectional | Tibet province | ≥1 | 904 | 181 | Colloidal Gold | 4 |
| Wang FZ et al. [20] | 2017 | Cross-sectional | 31 provinces | 1–29 | 19,583 | 517 | ELISA | 5 |
| Chen YH et al. [21] | 2017 | Cross-sectional | Quan Zhou City | 1–59 | 5473 | 370 | ELISA | 5 |
| Gao P et al. [22] | 2016 | Cross-sectional | Beijing City | ≥1 | 6705 | 184 | CMIA | 6 |
| Su FY et al. [23] | 2015 | Cross-sectional | Jiang Yin City | ≥1 | 13,837 | 695 | ELISA | 4 |
| Yang BF et al. [24] | 2013 | Cross-sectional | Hu Bei province | 1–59 | 9955 | 676 | ELISA | 7 |
| Liu J et al. [25] | 2014 | Cross-sectional | ChongQing City | 20–59 | 21,424 | 1718 | ELISA | 5 |
| Ren H et al. [26] | 2013 | Cross-sectional | Shang Hai City | > 0 | 2835 | 172 | ELISA | 4 |
| Cheng JQ et al. [27] | 2013 | Cross-sectional | Shen Zhen City | 1–59 | 3771 | 252 | ELISA | 4 |
| He HY et al. [28] | 2014 | Cross-sectional | Tian Jin City | 1–59 | 2594 | 68 | ELISA | 5 |
| Guo YH et al. [29] | 2017 | Cross-sectional | He Nan province | 18–74 | 16,685 | 642 | ELISA | 6 |
| Liu J et al. [30] | 2017 | Cross-sectional | 31 provinces | 21–49 | 1,936,801 | 202,816 | ELISA | 5 |
| Liu JY et al. [31] | 2017 | Cross-sectional | Shan Dong province | 1–59 | 5528 | 187 | ELISA | 6 |
| Yang SG et al. [32] | 2017 | Cross-sectional | Zhe Jiang province | 0–81 | 16,601 | 670 | CMIA | 6 |
| Chen P et al. [33] | 2017 | Cross-sectional | Zhe Jiang province | > 0 | 9855 | 1056 | ELISA | 8 |
| Zeng FF et al. [34] | 2016 | Cross-sectional | Guang Dong province | > 0 | 169,211 | 14,823 | ELISA | 7 |
| Xin XN et al. [35] | 2016 | Cross-sectional | 31 provinces | 20–49 | 764,460 | 44,057 | ELISA | 5 |
| Liu J et al. [36] | 2016 | Cross-sectional | 31 provinces | 21–49 | 1,966,013 | 124,274 | ELISA | 4 |
| Zhang Q et al. [37] | 2016 | Cross-sectional | Ji Lin province | ≥1 | 227,808 | 13,979 | ELISA | 6 |
| Guo YH et al. [38] | 2015 | Cross-sectional | He Nan province | 1–14 | 13,207 | 98 | ELISA | 5 |
| Huang P et al. [39] | 2015 | Cross-sectional | Jiang Su province | > 0 | 148,931 | 11,469 | ELISA | 5 |
| Ji ZH et al. [40] | 2014 | Cross-sectional | Gan Su province | 1–59 | 28,044 | 2019 | ELISA | 5 |
| Liao XY et al. [41] | 2014 | Cross-sectional | Guang Xi province | 17–27 | 2040 | 258 | CMIA | 4 |
| Zhang Y et al. [42] | 2013 | Cross-sectional | Hai Nan province | 15–49 | 12,393 | 1179 | ELISA | 4 |
Prevalence of HBV infection in the general population
In the 27 articles included in our study, the pooled estimated prevalence of HBV infection in the general population of China from 2013 to 2017 was 6.89% (95% CI,5.84–7.95%) (Fig. 2). The highest prevalence of HBV infection (20.02%) was reported in Tibet province. The lowest prevalence of HBV infection (2.62%) was reported in Tian Jin city.
Fig. 2.

Forest plot of HBV infection prevalence rate in the general Chinese population from 2013 to 2017
The results of heterogeneity test indicated that the studies were significantly heterogeneous (I2 = 99.9%, P < 0.0001). Therefore, a random effect model was used to calculate the HBV pooled prevalence and 95% CI. Based on the funnel plot (Fig. 3) and Egger’s test for the prevalence of HBV infection (P = 0.35), there was no evidence of publication bias in all studies.
Fig. 3.
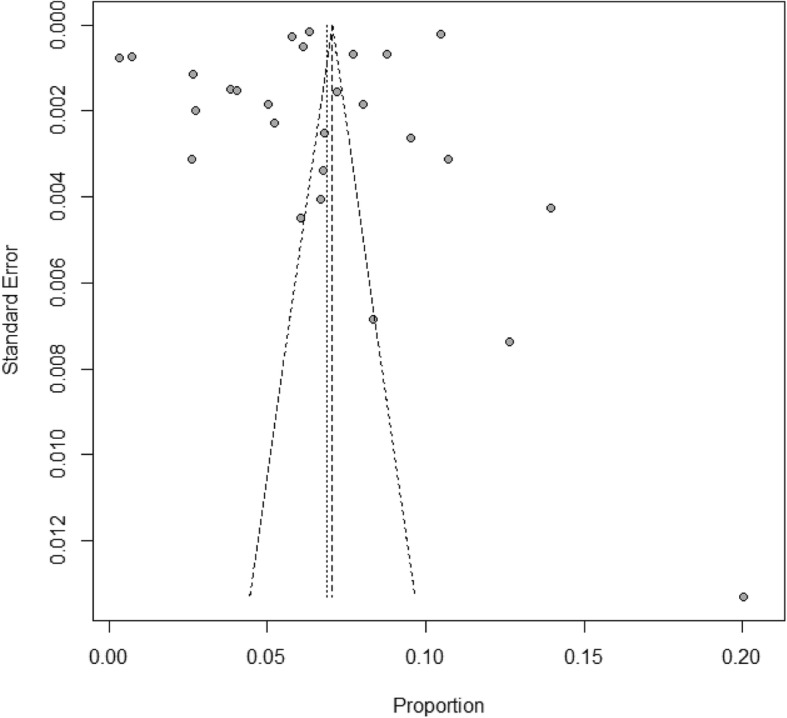
Bias assessment funnel plot of studies reporting HBV prevalence in China from 2013 to 2017
Subgroup analysis of HBV infection according to regions, age groups, sexes, and urban or rural areas
The subgroup meta-analysis of pooled HBV infection prevalence is shown in Table 2. The pooled estimated prevalence of HBV infection showed significant differences according to region. The prevalence was the highest in Western China (8.92, 95% CI:7.19–10.64%), which was considered a high prevalence area. A lower prevalence was found in Eastern (6.61, 95% CI:5.27–7.22%) and Middle (5.23, 95% CI:3.11–7.34%) regions, which were considered higher intermediate prevalence areas. The prevalence in males (5.88, 95% CI:5.53–6.24%) was higher than that in females (5.05, 95% CI:4.56–5.88%). The prevalence in children younger than 15 years old was lower than 2%, while in adults older than 20 years old, the prevalence was approximately 7%. The prevalence in rural areas (5.86, 95% CI: 4.93–6.96%) was higher than that in urban areas (3.29, 95% CI: 2.32–4.41%).
Table 2.
Sub-group meta-analysis of studies reporting HBV prevalence in China from 2013 to 2017
| Sub-group | Numbers of Study | Prevalence (%) | 95% CI | I2(%) | Heterogeneous P-value | Egger’s test P-value* |
|---|---|---|---|---|---|---|
| Region | ||||||
| Eastern | 16 | 6.16 | 5.25–7.22 | 99.9 | P < 0.0001 | 0.14 |
| Middle | 7 | 5.23 | 3.11–7.34 | 100.0 | P < 0.0001 | – |
| Western | 9 | 8.92 | 7.19–10.64 | 99.9 | P < 0.0001 | – |
| Sex | ||||||
| Male | 21 | 5.88 | 5.53–6.24 | 99.1 | P < 0.0001 | 0.90 |
| Female | 22 | 5.05 | 4.56–5.88 | 99.6 | P < 0.0001 | 0.51 |
| Age | ||||||
| 0–4 | 8 | 0.51 | 0.33–0.74 | 50.6 | 0.048 | – |
| 5–9 | 6 | 2.08 | 1.05–3.46 | 90.2 | P < 0.0001 | – |
| 10–14 | 6 | 1.58 | 0.69–2.77 | 89.8 | P < 0.0001 | – |
| 15–19 | 6 | 3.98 | 1.42–6.54 | 96.9 | P < 0.0001 | – |
| 20–29 | 12 | 7.07 | 5.62–8.67 | 99.9 | P < 0.0001 | 0.77 |
| 30–39 | 12 | 7.43 | 6.11–9.04 | 99.9 | P < 0.0001 | 0.72 |
| 40–49 | 11 | 7.08 | 5.72–8.77 | 99.2 | P < 0.0001 | 0.91 |
| 50–59 | 6 | 7.08 | 5.19–9.65 | 93.2 | P < 0.0001 | – |
| ≥ 60 | 3 | 7.39 | 4.20–10.59 | 96.7 | P < 0.0001 | – |
| Urban/Rural | ||||||
| Urban | 10 | 3.29 | 2.32–4.41 | 98.2 | P < 0.0001 | 0.52 |
| Rural | 16 | 5.86 | 4.93–6.96 | 100.0 | P < 0.0001 | 0.45 |
*: When the sample size is less than 10 articles, it is not possible to do Egger’s test
Estimation of the number of people living with HBsAg in China
Based on the age structure of national population provided by the National Bureau of Statistics and sub-meta-analysis of HBV infection according to age groups, an estimated 83,864,139 individuals (95% CI: 60,406,793 -110,751,614) were found to be living with HBsAg in China in 2018 [43] (Fig. 4).
Fig. 4.

Estimated HBsAg prevalence and extrapolation of the number of people living with HBV in the general population of China according to age in 2018
Discussion
Hepatitis B is a major global public health problem particularly in developing countries. The last Chinese National Hepatitis Seroepidemiological Survey was conducted in 2006. Over a decade has passed since 2006, yet no further investigation has been conducted. To obtain the latest national data on hepatitis B in the general population for the assessment of hepatitis B prevalence in China, and to promote effective policy making, a systematic review and meta-analysis was performed covering the years 2013–2017. Having reviewed journal articles in both Chinese and English, this meta-analysis provided a comprehensive and systematic study of the current hepatitis B infection prevalence in China, covering not only the more developed eastern regions, but also those underdeveloped regions such as Tibet. According to our systematic review, the prevalence of HBV infection in the general population in China from 2013 to 2017 was 6.89% (95% CI:5.84–7.95%) which is considered as a higher intermediate prevalence. The prevalence rate decreased by 4.04% compared with 2007 and the downward trend was not obvious after 10 years. In 2015, Schweitzer A [5] systematically reviewed the status of chronic HBV infection around the world from 1965 to 2013. In 2017, Zhang WL [44] demonstrated the HBsAg positive rate among the general population in China from 2007 to 2016. Their research indicated that China was still a higher intermediate prevalence area and therefore verified the results of our study. In 2018, an estimated population of approximately 84 million living with HBsAg which has led to many public health problems such as an increase in patients diagnosed with liver cirrhosis and HCC, as it has been proven that patients with HBV infection have a greater risk of HCC [45]. Such a large number of infections also suggested that we should promote policy studies on hepatitis B antiviral treatment, to address the increase in chronic hepatitis B, cirrhosis and HCC patients.
According to our systematic review, in adults older than 20 years, the prevalence of HBV infection was approximately 7% which was higher than that in children. In 2018, it was estimated that more than 90% of the HBV infection population included adults older than 20 years, suggesting that antiviral therapy should be widely adopted to improve the quality of life and the survival rate of infected adults. The high prevalence of HBV infection in individuals aged 20–39 years also suggested that we should continue blocking hepatitis B mother-to-infant transmission as well as plan involving a timely birth dose of hepatitis B vaccine within 24 h considering the high prevalence in women of child-bearing age. The prevalence of HBV infection in males was higher than that in females (5.88% vs 5.05%). This difference might be due to an increased exposure to risk factors, such as occupational risk factors, drug usage, or male homosexuality. This finding also suggested that we should consider the vaccination of hepatitis B vaccine in high risk adults. Compared with the Eastern (6.61% and Central (5.23%) regions, the prevalence of HBV infection was the highest in Western China (8.92%), which was considered a high prevalence area. This conclusion is consistent with the epidemiological survey in 2007 [11]. This difference might be due to different immunization coverages involving timely birth dose and three doses of hepatitis B vaccine in different areas. The immunization coverage of timely birth dose varied widely from 94% in Beijing to only 25% in Tibet, and the three doses of hepatitis B vaccine varied from 100% in Beijing to only 79% in Tibet [46]. These results also showed that plans involving timely birth dose of hepatitis B vaccine within 24 h and immunization coverage of three doses of hepatitis B vaccine should be strictly implemented. The prevalence of HBV infection in rural areas was higher than that in urban areas (5.86% vs 3.29%). This difference might be due to a higher proportion of paid blood donations, and a lower popularity rate of HBV mother-to-infant transmission blocking in rural areas. The higher prevalence of HBV infection in rural and Western areas suggested that more policy and finance support should be given to promote disease prevention and treatment in those areas, and various control measures should be implemented in different provinces across China.
There are three main limitations of this review. First, studies were conducted in various geographical areas, targeting different populations, so the results of heterogeneity test indicated that the studies were significantly heterogeneous. However, subgroup analysis was used to minimize this heterogeneity and provided more details on HBV infection. Second, it should be noted that only four studies reported the prevalence of HBV infection in the general population in 31 provinces at a national level. At a regional level, little is known about HBV infection in the general population in all provinces in China. Third, because not all the full-text articles included sex, age, region and other information required for subgroup analysis, some of the articles with higher positive rates were not included in subgroup analysis. Despite resulting in a higher pooled prevalence of HBV infection rate and a lower rate in subgroup analysis, the above situation also provided more details on HBV infection in China.
Conclusion
China was classified as a higher intermediate prevalence area (5–7.99%), of which more than 90% of HBV infection population included adults older than 20 years. These results provided two valuable pieces of information. First, the high prevalence of hepatitis B in women of child-bearing age indicated that blocking hepatitis B mother-to-infant transmission and the immunization plan involving a timely birth dose of hepatitis B vaccine within 24 h should be strictly implemented. Second, although the number of HBV-infected populations has decreased over the past 10 years, an estimated population of 84 million were still infected which is more than the number of people in any country of Europe. Improving the quality of life and survival rate of the infected population through antiviral therapy and high risk adult vaccination will be the priority of our future work. More policy and finance support should be provided for prevention and treatment in rural and Western areas, and various control measures should be implemented in different provinces across China.
Additional files
Table S1. Cross-Sectional/Prevalence Study Quality Assessment Forms (AHRQ). (DOCX 16 kb)
Table S2. Quality assessment of eligible studies. (DOCX 18 kb)
Acknowledgments
We acknowledge Hui Li and Li Wang from Chinese Academy of Medical Sciences and Peking Union Medical College to give valuable advice to this paper. We also acknowledge Yiqing Wang from Chinese Academy of Medical Sciences and Peking Union Medical College to edit the English of final manuscript.
Abbreviations
- AHRQ
Agency for Healthcare Research and Quality
- CBM
Chinese Biomedical Database
- CDC
Centers for Disease Control and Prevention
- CNKI
China National Knowledge Infrastructure
- HBsAg
Hepatitis B surface antigen
- HBV
Hepatitis B virus
- HCC
Hepatic Cirrhosis and Hepatocellular Carcinoma
- PRISMA
Preferred Reporting Items for Systematic Reviews and Meta-Analyses
Authors’ contributions
HW and JW designed the review, performed data extraction and analysis, and drafted the manuscript. PM and YX conducted the data extraction and quality assessment. PG, ML, QY, W C and SB were involved in data extraction and analysis. All authors have read and approved the final version of the manuscript.
Funding
This work was funded by Beijing Municipal Science & Technology Commission, D171100003117001
Availability of data and materials
Not applicable.
Ethics approval and consent to participate
Because this study was based on information retrieved from published studies, it did not require any ethical approval.
Consent for publication
Not applicable.
Competing interests
The authors declare that they have no competing interests.
Footnotes
Publisher’s Note
Springer Nature remains neutral with regard to jurisdictional claims in published maps and institutional affiliations.
References
- 1.WHO. Global hepatitis report. 2017[EB/OL]. Licence: CC BY-NC-SA 3.0 IGO. Available at: https://www.who.int/hepatitis/publications/global-hepatitis-report2017/en/.
- 2.WHO. Hepatitis B fact sheets[EB/OL]. Available at: http://www.who.int/news-room/fact-sheets/detail/hepatitis-b.
- 3.Chisari FV, Isogawa M, Wieland SF. Pathogenesis of hepatitis B virus infection. Pathol Biol (Paris) 2010;58(4):258–266. doi: 10.1016/j.patbio.2009.11.001. [DOI] [PMC free article] [PubMed] [Google Scholar]
- 4.Chang ML. LiawYF. Hepatitis B flares in chronic hepatitis B: pathogenesis, natural course, and management. J Hepatol. 2014;61(6):1407–1417. doi: 10.1016/j.jhep.2014.08.033. [DOI] [PubMed] [Google Scholar]
- 5.Schweitzer A, Horj J, Mikolajczyk RT, Krause G, Ott JJ. Estimation of worldwide prevalence of chronic hepatitis B virus infection: a systematic review of data published between 1965 and 2013. Lancet. 2015;386(10003):1546–1555. doi: 10.1016/S0140-6736(15)61412-X. [DOI] [PubMed] [Google Scholar]
- 6.Andre F. Hepatitis B epidemiology in Asia, the middle East and Africa. Vaccine. 2000;18:S20–S22. doi: 10.1016/S0264-410X(99)00456-9. [DOI] [PubMed] [Google Scholar]
- 7.Shepard CW, Simard EP, Finelli L, Fiore AE, Bell BP. Hepatitis B virus infection: epidemiology and vaccination. Epidemiol Rev. 2006;28:112–125. doi: 10.1093/epirev/mxj009. [DOI] [PubMed] [Google Scholar]
- 8.Xia GL, Liu CB, Cao HL, Bi SL, Zhan MY, Su CA, et al. Prevalence of hepatitis B and C virus infections in the general Chinese population. Results from a nationwide cross-sectional seroepidemiologic study of hepatitis a, B, C, D and E virus infections in China, 1992. Int Hepatol Commun. 1996;5:62–73. doi: 10.1016/S0928-4346(96)82012-3. [DOI] [Google Scholar]
- 9.Dai ZC, Qi GM. Seroepidemiological Survey in Chinese population (part one), 1992–1995. Beijing. Sci Tech Exp. 1996;1:39–59.
- 10.Zhuang H. Epidemiology of hepatitis. Chin J Vaccines Immun. 2004;10(3):180–181. [Google Scholar]
- 11.Liang X, Bi S, Yang W, et al. Epidemiological serosurvey of hepatitis B in China—declining HBV prevalence due to hepatitis B vaccination. Vaccine. 2009;27(47):6550–6557. doi: 10.1016/j.vaccine.2009.08.048. [DOI] [PubMed] [Google Scholar]
- 12.Moher D, Liberati A, Tetzlaff J, Altman DG. The PRISMA Group. Preferred reporting items for systematic reviews and meta-analyses: the PRISMA statement. PLoS Med. 2009;6(7):e1000097. doi: 10.1371/journal.pmed.1000097. [DOI] [PMC free article] [PubMed] [Google Scholar]
- 13.Rostom A, Dube C, Cranney A, et al. Celiac Disease. Rockville (MD): Agency for Healthcare Research and Quality (US); 2004. [Google Scholar]
- 14.Higgins JP, Thompson SG, Deeks JJ, Altman DG. Measuring inconsistency in meta-analyses. BMJ. 2003;327(7414):557–560. doi: 10.1136/bmj.327.7414.557. [DOI] [PMC free article] [PubMed] [Google Scholar]
- 15.Egger M, Davey Smith G, Schneider M, Minder C. Bias in meta-analysis detected by a simple, graphical test. BMJ. 1997;315(7109):629–634. doi: 10.1136/bmj.315.7109.629. [DOI] [PMC free article] [PubMed] [Google Scholar]
- 16.Min DY, Huang WY, Yang JY, et al. Prevalence pattern of hepatitis B among minority population in Guizhou Province. Modern Preventive Medicine. 2016;43(1):11–14. [Google Scholar]
- 17.Xia W, Dai DF, Song LX, et al. Prevalence of hepatitis B virus surface antigen (HBsAg) and antibody to HBsAg among 1-59 year olds, Hunan Province. Chinese J Vaccin Iimmunization. 2015;21(4):373–377. [Google Scholar]
- 18.Cai HL, Fan HY, Wang ZZ. Analysis on the prevalence of HBsAg in elderly hui ethnicities residents in Ningxia. J Hainan Med Univ. 2017;23(9):1220–1225. [Google Scholar]
- 19.Bai S, Zhang H, ZhaXi WS, et al. Investigation on the sero-epidemiology of hepatitis B virus infection in Tibetan peasants and herdsmen of Gamba county. Chinese Hepatol. 2017;22(4):314–316. [Google Scholar]
- 20.Wang FZ, Zhang GM, Shen LP, et al. Comparative analyze on hepatitis B seroepidemiological surveys among population aged 1-29 years in different epidemic regions of China in 1992 and 2014. Chin J Prev Med. 2017;51(6):462–468. doi: 10.3760/cma.j.issn.0253-9624.2017.06.002. [DOI] [PubMed] [Google Scholar]
- 21.Che YH, Hong SR, Chen MC, et al. Sero-prevalence of hepatitis B and its influencing factors among people aged 1-59 years in Quanzhou city, 2015. Chinese J Vaccin Iimmunization. 2017;23(5):512–516. [Google Scholar]
- 22.Gao P, Wang H, Chen WX, et al. A sero-epidemiological study of hepatitis B among general population in Beijing. Chin J Epidemiol. 2016;27(5):658–662. doi: 10.3760/cma.j.issn.0254-6450.2016.05.014. [DOI] [PubMed] [Google Scholar]
- 23.Su FY, Jin ZY, Liang F. A sero-epidemiological study of hepatitis B among general population older than 1 years in Jiang yin. Pract Prev Med. 2015;22(3):328–330. [Google Scholar]
- 24.Yang BF. Study on the seroepidemic situation of HBV and evaluation HepB vaccine in HuBei Province. Doctoral Dissertation of Tongji Medical College, Huazhong University of Science and Technology. 2003. [Google Scholar]
- 25.Liu J, Chen Q, Li J, et al. Serological survey of hepatitis B infection among planned pregnancy couples in Chongqing in 2013. Chin J Clin Infect Dis. 2014;7(6):506–510. [Google Scholar]
- 26.Ren H, Zhou X, Li J, et al. Seroepidemiological analysis on hepatitis B virus infection among community residents in Shanghai. Chin J Public Health. 2013;29(11):1568–1571. [Google Scholar]
- 27.Cheng JQ, Ma HW, Xie X, et al. Sero-epidemiological investigation on hepatitis B among permanent residents in Shenzhen area. Chin J Epidemiol. 2013;34(12):1179–1182. [PubMed] [Google Scholar]
- 28.He HY, Chen J, Wu WS, et al. An epidemiological survey of the prevalence of 2 594 cases with viral hepatitis B infection in different populations. Chin J Prim Med Pham. 2014;21(6):825–826. [Google Scholar]
- 29.Guo YH, Feng DX, Xu J, et al. The prevalence of hepatitis B infection in Central China an adult population-based serological survey of a large sample size. J Med Virol. 2017;89:450–457. doi: 10.1002/jmv.24649. [DOI] [PubMed] [Google Scholar]
- 30.Liu J, Zhang S, Wang Q, et al. Prevalence of HBsAg/HBeAg amongst 1936801 couples preparing for pregnancy in rural China: an observational study. J Viral Hepat. 2017;24:679–686. doi: 10.1111/jvh.12693. [DOI] [PubMed] [Google Scholar]
- 31.Liu JY, Lv JJ, Yan BY, et al. Comparison between two population-based hepatitis B serosurveys with an 8-year interval in Shandong Province. China Int J Infect Dis. 2017;61:13–19. doi: 10.1016/j.ijid.2017.05.015. [DOI] [PubMed] [Google Scholar]
- 32.Yang SG, Ding C, Cui YX, et al. Prevalence and influencing factors of hepatitis B among a rural residential population in Zhejiang Province,China: a cross-sectional study. BMJ Open. 2017;7:e014947. doi: 10.1136/bmjopen-2016-014947. [DOI] [PMC free article] [PubMed] [Google Scholar]
- 33.Chen P, Xie QF, Chen T, et al. Hepatitis B virus infection in hilly/mountainous regions of southeastern China: a locality-dependent epidemiology. BMC Infect Dis. 2017;17:809. doi: 10.1186/s12879-017-2922-7. [DOI] [PMC free article] [PubMed] [Google Scholar]
- 34.Zeng FF, Guo P, Huang Y, et al. Epidemiology of hepatitis B virus infection: results from a community-based study of 0.15 million residents in South China. Sci Rep. 2016;6:36186. doi: 10.1038/srep36186. [DOI] [PMC free article] [PubMed] [Google Scholar]
- 35.Xin XN, Wagn YY, Cheng J, et al. Seroepidemiological survey of hepatitis B virus infection among 764,460 women of childbearing age in rural China:A cross sectional study. J Clin Virol. 2016;81:47–52. doi: 10.1016/j.jcv.2016.05.014. [DOI] [PubMed] [Google Scholar]
- 36.Liu J, Zhang SK, Wagn QM, et al. Seroepidemiology of hepatitis B virus infection in 2 million men aged 21-49 years in rural China a population-based, cross-sectional study. Lancet Infect Dis. 2016;16:80–86. doi: 10.1016/S1473-3099(15)00218-2. [DOI] [PubMed] [Google Scholar]
- 37.Zhang Q, Qi WQ, Wang X, et al. Epidemiology of hepatitis B and hepatitis C infections and benefits of programs for hepatitis prevention in northeastern China: a cross-sectional study. Clin Infect Dis. 2016;62(3):305–312. doi: 10.1093/cid/civ859. [DOI] [PubMed] [Google Scholar]
- 38.Guo YH, Xu J, Li J, et al. An epidemiological serosurvey of hepatitis B virus shows evidence of declining prevalence due to hepatitis B vaccination in Central China. Int J Infect Dis. 2015;40:75–80. doi: 10.1016/j.ijid.2015.10.002. [DOI] [PubMed] [Google Scholar]
- 39.Huang P, Su J, Shen HB, et al. Seroepidemiology of hepatitis B virus infection and impact of vaccination. World J Gastroenterol. 2015;21(25):7842–7850. doi: 10.3748/wjg.v21.i25.7842. [DOI] [PMC free article] [PubMed] [Google Scholar]
- 40.Ji ZH, Wang TC, Shao ZJ, et al. A population-based study examining hepatitis B virus infection and immunization rates in Northwest China. PLoS One. 2014;9(5):e97474. doi: 10.1371/journal.pone.0097474. [DOI] [PMC free article] [PubMed] [Google Scholar]
- 41.Liao XY, Zhou ZZ, Wei FB, et al. Seroprevalence of hepatitis B and immune response to hepatitis B vaccination in Chinese college students mainly from the rural areas of western China and born before HBV vaccination integrated into expanded program of immunization. Human Vaccin Immunother. 2014;10(1):224–231. doi: 10.4161/hv.26311. [DOI] [PMC free article] [PubMed] [Google Scholar]
- 42.Zhang Y, Fang WM, Fan LC, et al. Hepatitis B surface antigen prevalence among 12393 rural women of childbearing age in Hainan province, China:a cross-sectional study. Virol J. 2013;10:25. doi: 10.1186/1743-422X-10-25. [DOI] [PMC free article] [PubMed] [Google Scholar]
- 43.National Bureau of Statistics . China Statistical Yearbook. 2018. [Google Scholar]
- 44.Zhang WL, Ji ZH, Fu T, et al. Meta analysis on HBsAg-positve rate among general population aged 1-59 years, 2007-2016, China. Chinese J Epidemiol. 2017;38(9):1278–1284. doi: 10.3760/cma.j.issn.0254-6450.2017.09.027. [DOI] [PubMed] [Google Scholar]
- 45.Pollicino T, Squadrito G, Cerenzia G, Cacciola I, Raffa G, Craxi A, et al. Hepatitis B virus maintains its pro-oncogenic properties in the case of occult HBV infection. Gastroenterology. 2004;126(1):102–110. doi: 10.1053/j.gastro.2003.10.048. [DOI] [PubMed] [Google Scholar]
- 46.Cui FQ, Gong XH, Chen YS, et al. Vaccination progress of hepatitis B vaccine and epidemiology changes of carrying rate of hepatitis B surface antigen by province in China, 1992-2006. Chinese J Vaccin Immunization. 2012;18(1):6–13. [Google Scholar]
Associated Data
This section collects any data citations, data availability statements, or supplementary materials included in this article.
Supplementary Materials
Table S1. Cross-Sectional/Prevalence Study Quality Assessment Forms (AHRQ). (DOCX 16 kb)
Table S2. Quality assessment of eligible studies. (DOCX 18 kb)
Data Availability Statement
Not applicable.