Abstract
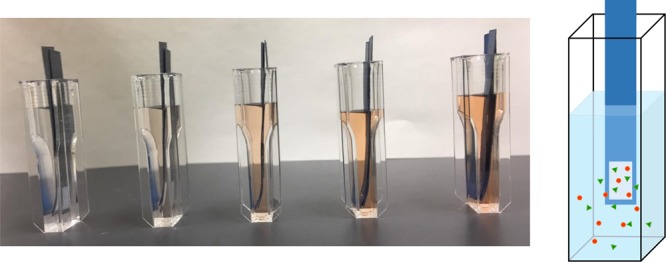
Reagent-deposited pieces of paper were characterized by the use of a compact conductometer, a compact pH sensor, and a conventional spectrophotometer to assess their suitability for use as reagent containers. The pieces of paper were fabricated by wax printing to form a limited hydrophilic area to which a consistent volume of an aqueous reagent could be added. The pieces of paper without the reagent increased the conductivity of water gradually because of the release of sodium salts, whereas pH of NaOH decreased because of the acidity of the functional groups in the paper. Three reagents, sulfamic acid as an acid, Na2CO3 as a base, and BaCl2 as a metal salt, were deposited on the pieces of paper to evaluate their ability to release from the pieces of paper. Sulfamic acid and Na2CO3 were released in quantities of 58 and 73% into water after 420 s, whereas 100% of BaCl2 was released after 480 s. The conductometric titrations of NaOH, HCl, and Na2SO4, and the spectrophotometry of Fe2+ were examined using the pieces of paper that contained sulfamic acid, Na2CO3, BaCl2, and 1,10-phenanthroline. Titrations using the pieces of paper suggested that the reagents were quantitatively released into the titrant, which resulted in a linear relationship between the endpoints and the equivalent points. In 120 s of soaking time, 60–70% of the reagents were released. The spectrophotometric measurements of Fe2+ indicated that when an excess amount of the reagents was deposited onto the pieces of paper, they nonetheless sufficiently fulfilled the role of a reagent container.
Introduction
Recent analytical techniques now address many requirements in diverse fields and purposes, and chemical analyses have become essential in fields such as environmental science, pharmaceutical science, medical science, agricultural science, and engineering. Many sophisticated instruments are routinely employed in laboratories, whereas small sensors and devices permit point-of-care testing (POCT), on-site field analysis, and analysis in ill-equipped laboratories. Therefore, analytical techniques must be based on suitability for particular purposes and circumstances.
Miniaturization of chemical sensors and chemical devices is a trend in analytical chemistry that has been in evidence in the development of microfluidic devices since the early 1990s.1,2 The proliferation of review articles on microfluidic devices includes topics such as bioanalysis,3 electrophoretic separation,4 ion analysis,5,6 optical sensing,7 preconcentration,8 and real-sample analysis.9 Microfluidic devices can miniaturize the channels used in separation, pretreatment, and detection by integrating them with small substrates, whereas larger pumping systems, detectors, and power supplies complicate the use of microfluidic devices in the field. Conversely, several types of miniaturized sensors that are used for onsite analysis and POCT have been reported and are commercially available. Miniaturized, highly sensitive amperometric sensors have shown promise not only for in vivo measurement10 but also in POCT via coupling with microfluidic paper-based analytical devices (μPADs).11 However, amperometry requires equipment, such as a personal computer and a potentiostat, that is appreciably bigger and more expensive than μPADs. Conversely, Futagawa et al. have developed a miniaturized conductivity sensor with platinum electrodes on a silicon substrate, which permits measurements of electrical conductivities ranging from 10–2 to 101 S m–1.12
As a miniaturized sensor, one of the most suitable analytical platforms in POCT and onsite analysis is the μPAD, which has received much attention since the Whitesides’ group demonstrated the measurement of multiple analytes on a piece of paper with narrow channels fabricated by photolithography.13 μPADs possess the characteristics of simple structure, easy fabrication, lightweight, and inexpensive materials, so they are considered suitable for use outside well-equipped laboratories—POCT and onsite analysis. Many researchers have demonstrated novel μPADs that potentially permit the determination of an analyte without the use of other instrumentation. These techniques include detection schemes with time-based,14,15 distance-based,16,17 and counting-based readouts.18,19 We have also reported counting-based titration μPADs that can measure acid, base, magnesium, and calcium concentrations.20,21 In addition, recent publications have demonstrated several types of distance-based readouts as seen in the determination of inorganic ions,22−24 antioxidants,25 and lactoferrin.26
Although μPADs have shown promise in realizing onsite analysis and POCT, sufficient sensitivity continues to require sensitive equipment. Therefore, much effort has been invested in developing miniaturized detection systems that include transmittance detectors27−29 and electrochemical detectors.30−32 These detectors have the potential to enable high-performance analysis outside laboratories because of their portability and the necessity for only small batteries. Therefore, a suitable coupling of paper devices with small detectors and sensors should be explored in order to achieve actual onsite analysis and POCT.
There are many investigations on miniaturization of the instruments, but analytical techniques also require reagents for chemical reactions. In many cases, reagent solutions must be prepared in a laboratory on a large scale and transported using portable containers. Therefore, portability of chemical reagents is also an important issue to be resolved for achieving on-site analysis. In this study, we propose a method to carry chemical reagents using pieces of paper that form reagent containers. A piece of paper is lightweight, inexpensive, and is easy to dispose of in an environmentally friendly manner. For the present study, pieces of paper were fabricated by wax printing and were characterized using a compact conductometer and a compact pH sensor in order to verify their utility as a container of a solid reagent because a small sensing volume could suppress the dilution and permit the measurements of conductivity and pH changes due to ions released from a small piece of paper.
In order to miniaturize the conductometric titrations, we used a compact conductometric sensor and pieces of paper. In the acid–base titrations, standard solutions of NaOH and HCl were titrated with pieces of paper containing sulfamic acid and Na2CO3, which are primary standard substances that represent acids and bases, respectively. In the precipitation titration, a standard sample containing SO42– in the form of Na2SO4 was placed into a well in the sensor. After measuring the conductivity, pieces of paper containing a titrant were successively soaked into the sample solution to dissolve the titrant, which either resulted in a neutralization reaction or yielded a precipitate of BaSO4. The conductivity after soaking each piece of paper was monitored and plotted against the amount of the reagent deposited on the piece of paper. With this system, linear relationships between the endpoints of the miniaturized titrations and the equivalent points were obtained for the titrations of OH–, H+, and SO42–. In addition, Fe2+ was measured spectrophotometrically using pieces of paper containing 1,10-phenanthroline.
Results and Discussion
Characterization of the Paper
Initially, pieces of paper with no reagent were characterized using a compact conductometer and a compact pH sensor. The pieces of paper were dipped in pure water, 1 mM NaOH, and 1 mM HCl, and then the conductivity and pH changes were monitored, as shown in Figure 1. When dipping the pieces of paper into pure water, the conductivity gradually increased as soaking time increased (Figure 1a). The conductivity, which was 3.3 μS cm–1 initially, increased to 20.3 μS cm–1 after soaking a piece of paper for 720 s. The results suggested that small amounts of electrolytes were leached from the paper substrate into the water. We expected the substrate to cause the release of salts that resided in the paper from the pulping process. To confirm the release of salts, Na, K, Mg, and Ca that resided in the water following the soaking of a sheet of paper were determined by inductively coupled plasma–optical emission spectrometry (ICP–OES). Paper sheets (30 × 40 mm) with and without wax printing were soaked in 10 mL of water. Both forms of paper sheets showed Na at levels of several hundred ppb. Interestingly, the paper sheet without wax printing released 330 ppb of Na, whereas the version with wax printing on one surface showed a suppressed release of Na to a level of 170 ppb. This fact suggests that the sodium was entrapped in the wax. According to these results, the increased conductivity was attributed to sodium salts released from the paper.
Figure 1.
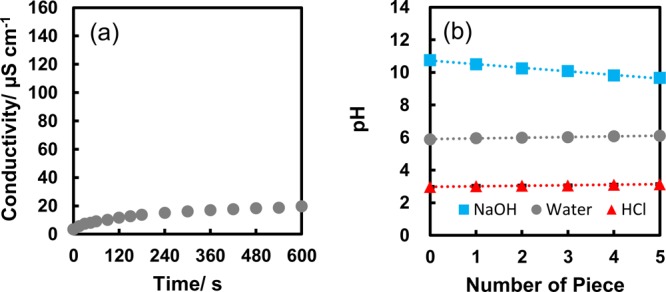
Change in conductivity and pH by soaking pieces of paper in solutions. (a) Conductivity change by a piece of paper without reagent. (b) pH change by pieces of paper without reagent. The concentrations of HCl and NaOH were 1 mM in (b).
Figure 1b shows the pH changes when pieces of paper with no reagent were soaked in water, 1 mM HCl, and 1 mM NaOH. Each piece of paper was soaked in each solution for 120 s. Water and HCl solution exhibited a negligible decrease in pH of less than 0.05 following soaking of each piece. pH of the NaOH solution was significantly decreased by more than 0.2 following soaking of each piece (Figure 1b). We also assessed the influence that the pieces of paper had on the conductivity of 1 mM NaOH. The conductivity of NaOH decreased gradually and then reached a constant value with the increase in the number of pieces of paper. According to these results, the paper substrates contain acidic functional groups that neutralize OH– in a strongly basic solution, although the dissociation constant was too small to release H+ into either water or 1 mM HCl solution.
Subsequently, we investigated reagent-deposited pieces of paper using 50 nmol solutions of sulfamic acid, Na2CO3, or BaCl2. Changes in conductivity were monitored when the pieces of paper were soaked in water and the results were compared with the changes in conductivity caused by the addition of the solutions (5 μL). Figure 2 shows the amount of reagents released into water as a function of the soaking time where the conductivity change expected by a complete release of the reagent was estimated based on the conductivity from the addition of the solution, which is represented by straight lines. The amount of the reagents released into water varied depending on the reagent type. Sulfamic acid and Na2CO3 were released incompletely and reached a plateau after a soaking time of 420 s, whereas BaCl2 was dissolved completely in water following an extended soaking time of 480 s. The released amounts were estimated to be 58% for sulfamic acid and 73% for Na2CO3. These results suggest that the releasable amounts must be standardized for each reagent because the amounts and the time needed to dissolve each reagent depends on its type.
Figure 2.
The effect of soaking time on conductivity for pieces of paper with reagents. Each piece of paper contained the reagent [(a) sulfamic acid, (b) Na2CO3, or (c) BaCl2] at 50 nmol. Dotted lines indicate the expected conductivity when 50 nmol of the reagents were dissolved in water completely.
Conductometric Titrations
In order to quantify the amount of reagent released from the pieces of paper, different concentrations of NaOH, HCl, and Na2SO4 were titrated with reagent-deposited pieces of paper containing sulfamic acid, Na2CO3, and BaCl2, respectively. Typical titration curves are shown in Figure 3 where a constant soaking time of 120 s was used to reduce the time needed to complete the titrations. As indicated in the titration curves, the endpoints were shifted to overestimated amounts due to expectations of an incomplete release. Titrations using the pieces of paper capably quantified the analytes, as summarized in Table 1, because the relationship between all equivalent points and the endpoints showed good linearity. The pieces of paper released constant amount of the titrant during a consistent amount of soaking time. According to the slope of the linear relationships in Table 1, the pieces of paper released sulfamic acid, Na2CO3, and BaCl2 at 60–70% of the total amount deposited (the slope for HCl should be divided by 2 because Na2CO3 is a divalent base). The linear relationship indicates that the pieces of paper accomplished miniaturized titrations with the need for neither a large volume of titrant nor a lot of glassware, although the amount of the titrant released from each piece of paper had to be calibrated for the analyte similar to establishing a secondary standard in conventional titrations.
Figure 3.
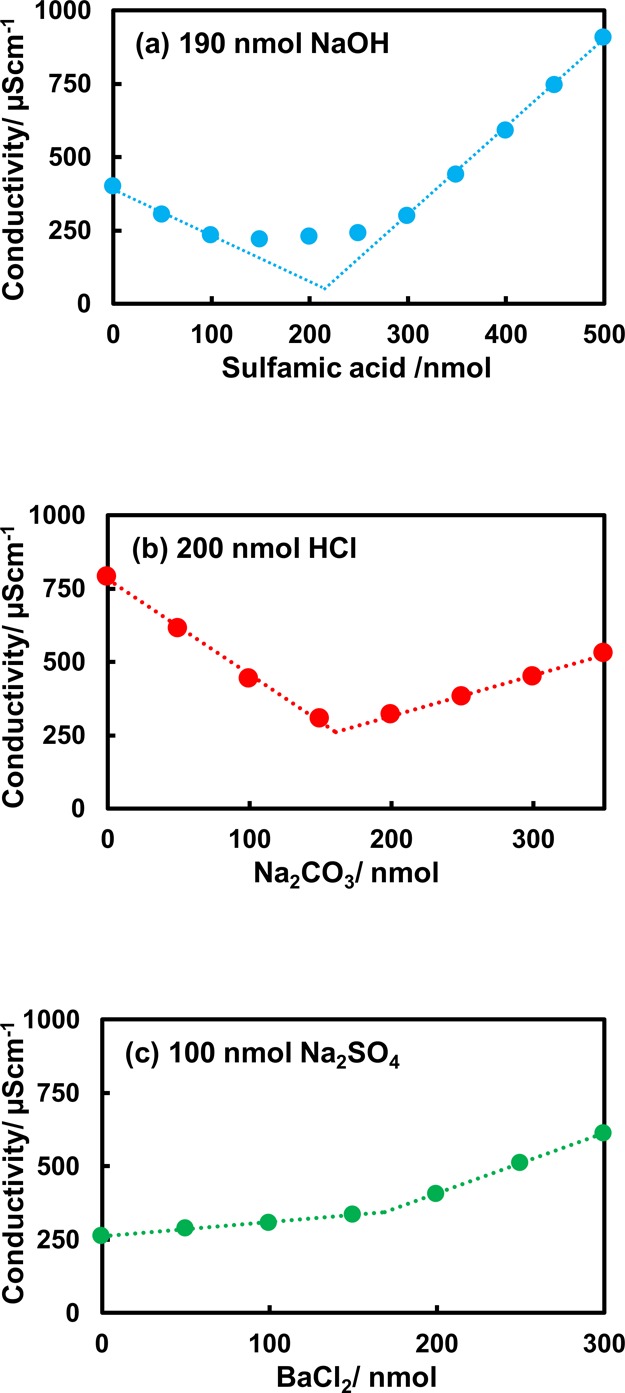
Typical titration curves. (a) Titration of NaOH with sulfamic acid, (b) titration of HCl with Na2CO3, and (c) titration of Na2SO4 with BaCl2. Concentrations of titrands: 1.9 mM NaOH, 2.0 mM HCl, and 1.0 mM Na2SO4. Volume of the titrands, 100 μL. The pieces of paper contained 50 nmol of the titrant.
Table 1. Relationship between the Endpoint of the Titration and the Equivalent Pointa.
| titrand | range of amount/nmol | titrant | equation | correlation (r2) |
|---|---|---|---|---|
| NaOH | 48–190 | sulfamic acid | y = 0.686x – 2.665 | 0.9947 |
| HCl | 100–400 | Na2CO3 | y = 1.324x – 5.018 | 0.9982 |
| Na2SO4 | 50–200 | BaCl2 | y = 0.602x – 1.428 | 0.9988 |
x: endpoint (nmol); y: equivalent point (nmol).
The titration curve for NaOH seems slightly strange because the conductivity is almost constant around the endpoint. This type of a titration curve can be seen when the titrand contains both a strong base and a weak base. It would be plausible to attribute this result to the weak acid on the paper substrate being neutralized by NaOH, and the resultant weak base would then dissolve into the titrand solution.
Absorption Spectrophotometry of Fe2+
It is noteworthy that the dilution effect can be excluded when using reagent-deposited pieces of paper. In other words, chemical reagents could be added to a solution without dilution. Therefore, paper containers are also useful for pH control and for chemical reactions in onsite analyses when the pieces of paper are prepared containing buffer components and reactants. To demonstrate the utility of the paper containers, we applied the method of absorption spectrophotometry. A photo of the solutions after soaking the pieces of paper containing hydroxylamine hydrochloride and 1,10-phenanthroline hydrochloride is shown in Figure 4. The calibration curve shows good linearity for concentrations ranging from 10 to 50 μM Fe with r2 = 0.9997. It should be noted that 2 mL of sample solutions represent rough measurements, which is why the levels of the solutions appear different in the cuvettes. This would be an advantage for paper containers with a negligible dilution of a sample solution. Sample solutions need not be precise in so far as the paper container releases excess amount of the reagents. The potential applicability to on-site analyses would make spectrometric measurements using the reagent-deposited pieces of paper more attractive for coupling with miniaturized photometric detectors.29,33,34
Figure 4.
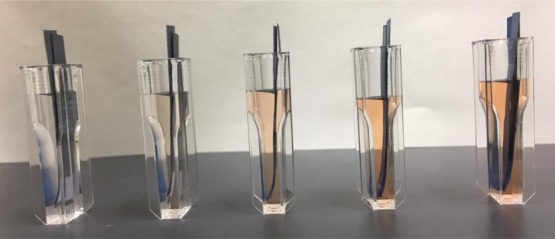
Reaction of Fe(II) with 1,10-phenanthroline deposited on the pieces of paper. Standard solutions of Fe(II) were placed in disposable cuvettes at volumes of roughly 2 mL. The pieces of paper containing 3 μmol of hydroxylamine hydrochloride and 3 μmol of 1,10-phenanthroline hydrochloride were soaked in the cuvettes.
Conclusions
Herein, we proposed novel hydrophilic paper containers that have reagents deposited on their surface and can simplify the onsite analysis of analyte reactions. These paper containers were characterized using a commercially available compact conductometer and a pH sensor. The applicability of the paper containers with reagents sulfamic acid, Na2CO3, and BaCl2 was validated in conductometric titrations of NaOH, HCl, and Na2SO4, respectively. The titrations were achieved by soaking the paper container with 100 μL of a titrand solution filled in the sample reservoir, which was then removed after 120 s. Reliable results were obtained for standard samples using the paper containers when the endpoints were correlated with the expected equivalent points. Colorimetric reagents for the measurement of Fe(II) were also deposited on the surface of the paper containers to allow reaction with the analyte in sample solutions, which was then followed by a measurement of absorbance. An additional advantage was realized when it became apparent that a precise volume of the sample solution was unnecessary, which negates dilution considerations and further increases the usefulness of the paper containers for conductometric titrations, pretreatments of samples, and chemical reactions of analytes during onsite analyses. Further applications should expand the utility of this system for onsite analysis and POCT.
Experimental Section
Materials
Analytical-grade reagents were used in this experiment. Deionized water (18.2 MΩ·cm) purified using a Milli-Q System from Merck Millipore (Millipore Co. Ltd., Molsheim, France) was used for standard and reagent preparations. Sodium sulfate (Na2SO4) and barium chloride (BaCl2) were ordered from Kanto Chemical (Tokyo, Japan). Other chemicals were purchased from Wako Pure Chemical Industrials, Ltd. (Osaka, Japan). The stock solutions were prepared with 1 M concentrations of deionized water.
Fabrication of Paper-Based Reagent Containers
Paper-based reagent containers (paper containers) were fabricated using the following procedure: a sheet of Whatman 1CHR chromatography paper (GE Healthcare Life Science, England) was printed by using a wax printer (ColorQube 8580N, Xerox, USA) using the design shown in Figure 5a where each piece of paper was composed of a printed 40 × 5 mm rectangular portion and an unprinted 4.5 × 3.5 mm rectangular portion for the measurements of conductivity and pH, and a printed 50 × 8 mm rectangular portion and an unprinted 8 × 6 mm rectangular portion for spectrophotometry. The printed paper sheets were heated at 120 °C for 120 s in an oven to create a hydrophobic barrier. Subsequently, one side of each paper sheet was again processed through the wax printer to enhance the hydrophobic surface and to prevent leakage of the reagent solutions from the bottom (Figure 5b), and then each piece was cut and formed to construct the individual paper containers.
Figure 5.
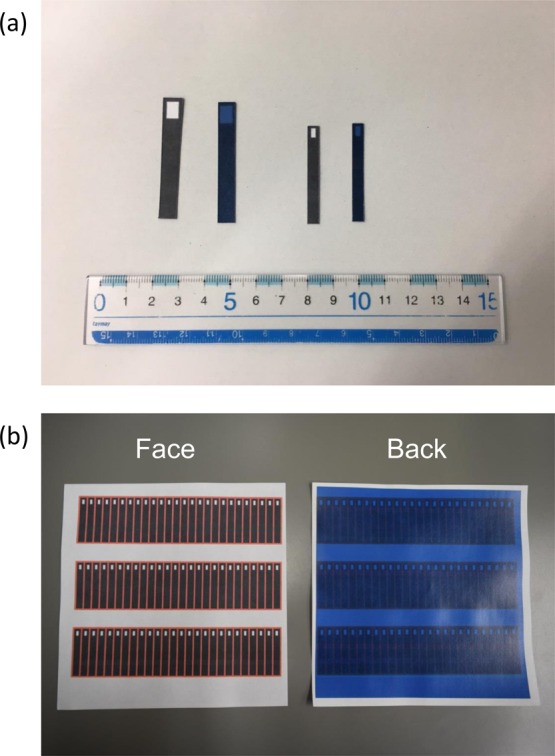
Paper containers fabricated by wax printing. (a) Pieces of paper with different sizes. (b) Front and back of the paper sheets printed by wax.
Measurements of Conductivity, pH, and Metal Ions
A commercially available compact conductometer and a pH sensor (LAQUAtwin Sensor, HORIBA, Tokyo, Japan) were employed to characterize the paper containers with and without the reagents. The paper containers were soaked in solutions that filled the reservoir of either the compact conductometer or the pH sensor. The volumes of the solution added to the reservoirs were fixed at 100 μL for the conductometer and 1 mL for the pH sensor. The maximum volumes of the sensing reservoirs were 120 μL for the conductometer and 2 mL for the pH sensor.
To characterize the ability to release a reagent deposited on the pieces of paper, 5 μL of the reagent solution was dropped onto the hydrophilic white area of each paper container and allowed to dry for 40 min at room temperature. Conductometric titrations were carried out as follows: 100 μL of a sample solution was placed into the sample reservoir of the compact conductometer. After measuring the initial conductivity of the sample solution in the conductometer, a piece of paper container was soaked in the sample solution for 120 s and then the conductivity of the sample solution was measured again. The operation was repeated until there was a distinct increase in conductivity. The measured conductivity values were plotted against the amount of the titrant deposited on the paper containers in order to determine the endpoint.
Inorganic salts released from the paper sheets were determined by ICP–OES (Vista Pro, Seiko Instruments, Inc., Tokyo, Japan). A 40 × 30 mm paper sheet was soaked in 10 mL of water. Four elements, Na, K, Mg, and Ca, were selected as candidates of metal ions to be released from paper. Calibration curves were constructed for concentrations that ranged from 0 to 2 ppm for each element.
To measure Fe(II) via conventional spectrophotometry, two different reagent containers were prepared by adding 60 μL of 0.05 M hydroxylamine hydrochloride and 60 μL of 0.05 M 1,10-phenanthroline hydrochloride to the hydrophilic zones of pieces of paper followed by drying at room temperature. Standard solutions of 10, 25, 40, and 50 μM of Fe(II) were placed into disposable cuvettes at a volume of about 2 mL, and then the pieces of paper were soaked in the cuvettes. After 45 min, the pieces of paper were removed and the absorbance at 510 nm was measured via spectrophotometer (UV-2400PC, Shimadzu, Kyoto, Japan).
Acknowledgments
This research was supported by JSPS KAKENHI grants numbers JP17H05465 and JP19H04675. The authors gratefully thank the Division of Instrumental Analysis, the Department of Instrumental Analysis & Cryogenics, the Advanced Science Research Center, Okayama University for the ICP–OES measurements. The authors acknowledge the financial support from grant IRN59W0007 of the Thailand Research Fund (chaired by Prof. Skorn Mongkolsuk).
Author Contributions
∥ S.B. and Y.S. contributed equally to this work.
The authors declare no competing financial interest.
References
- Manz A.; Harrison D. J.; Verpoorte E. M. J.; Fettinger J. C.; Paulus A.; Lüdi H.; Widmer H. M. Planar chips technology for miniaturization and integration of separation techniques into monitoring systems: Capillary electrophoresis on a chip. J. Chromatogr. 1992, 593, 253–258. 10.1016/0021-9673(92)80293-4. [DOI] [Google Scholar]
- Harrison D. J.; Manz A.; Fan Z.; Luedi H.; Widmer H. M. Capillary electrophoresis and sample injection systems integrated on a planar glass chip. Anal. Chem. 1992, 64, 1926–1932. 10.1021/ac00041a030. [DOI] [Google Scholar]
- Khandurina J.; Guttman A. Bioanalysis in microfluidic devices. J. Chromatogr. A 2002, 943, 159–183. 10.1016/s0021-9673(01)01451-0. [DOI] [PubMed] [Google Scholar]
- Kenyon S. M.; Meighan M. M.; Hayes M. A. Recent developments in electrophoretic separations on microfluidic devices. Electrophoresis 2011, 32, 482–493. 10.1002/elps.201000469. [DOI] [PubMed] [Google Scholar]
- Evenhuis C. J.; Guijt R. M.; Macka M.; Haddad P. R. Determination of inorganic ions using microfluidic devices. Electrophoresis 2004, 25, 3602–3624. 10.1002/elps.200406120. [DOI] [PubMed] [Google Scholar]
- Johnson R. D.; Gavalas V. G.; Daunert S.; Bachas L. G. Microfluidic ion-sensing devices. Anal. Chim. Acta 2008, 613, 20–30. 10.1016/j.aca.2008.02.041. [DOI] [PubMed] [Google Scholar]
- Kuswandi B.; Nuriman; Huskens J.; Verboom W. Optical sensing systems for microfluidic devices: A review. Anal. Chim. Acta 2007, 601, 141–155. 10.1016/j.aca.2007.08.046. [DOI] [PubMed] [Google Scholar]
- Giordano B. C.; Burgi D. S.; Hart S. J.; Terray A. On-line sample pre-concentration in microfluidic devices: A review. Anal. Chim. Acta 2012, 718, 11–24. 10.1016/j.aca.2011.12.050. [DOI] [PubMed] [Google Scholar]
- Crevillen A.; Hervas M.; Lopez M.; Gonzalez M.; Escarpa A. Real sample analysis on microfluidic devices. Talanta 2007, 74, 342–357. 10.1016/j.talanta.2007.10.019. [DOI] [PubMed] [Google Scholar]
- Ribet F.; Stemme G.; Roxhed N. Ultra-miniaturization of a planar amperometric sensor targeting continuous intradermal glucose monitoring. Biosens. Bioelectron. 2017, 90, 577–583. 10.1016/j.bios.2016.10.007. [DOI] [PubMed] [Google Scholar]
- Dungchai W.; Chailapakul O.; Henry C. S. Electrochemical detection for paper-based microfluidics. Anal. Chem. 2009, 81, 5821–5826. 10.1021/ac9007573. [DOI] [PubMed] [Google Scholar]
- Futagawa M.; Iwasaki T.; Noda T.; Takao H.; Ishida M.; Sawada K. Miniaturization of electrical conductivity sensors for a multimodal smart microchip. Jpn. J. Appl. Phys. 2009, 48, 04C184. 10.1143/jjap.48.04c184. [DOI] [Google Scholar]
- Martinez A. W.; Phillips S. T.; Butte M. J.; Whitesides G. M. Patterned paper as a platform for inexpensive, low-volume, portable bioassays. Angew. Chem., Int. Ed. 2007, 46, 1318–1320. 10.1002/anie.200603817. [DOI] [PMC free article] [PubMed] [Google Scholar]
- Lewis G. G.; Robbins J. S.; Phillips S. T. Point-of-care assay platform for quantifying active enzymes to femtomolar levels using measurements of time as the readout. Anal. Chem. 2013, 85, 10432–10439. 10.1021/ac402415v. [DOI] [PubMed] [Google Scholar]
- Lewis G. G.; Robbins J. S.; Phillips S. T. A prototype point-of-use assay for measuring heavy metal contamination in water using time as a quantitative readout. Chem. Commun. 2014, 50, 5352–5354. 10.1039/c3cc47698g. [DOI] [PubMed] [Google Scholar]
- Cate D. M.; Dungchai W.; Cunningham J. C.; Volckens J.; Henry C. S. Simple, distance-based measurement for paper analytical devices. Lab Chip 2013, 13, 2397–2404. 10.1039/c3lc50072a. [DOI] [PubMed] [Google Scholar]
- Cate D. M.; Noblitt S. D.; Volckens J.; Henry C. S. Multiplexed paper analytical device for quantification of metals using distance-based detection. Lab Chip 2015, 15, 2808–2818. 10.1039/c5lc00364d. [DOI] [PMC free article] [PubMed] [Google Scholar]
- Lewis G. G.; DiTucci M. J.; Phillips S. T. Quantifying analytes in paper-based microfluidic devices without using external electronic readers. Angew. Chem., Int. Ed. 2012, 124, 12879–12882. 10.1002/ange.201207239. [DOI] [PubMed] [Google Scholar]
- Zhang Y.; Zhou C.; Nie J.; Le S.; Qin Q.; Liu F.; Li Y.; Li J. Equipment-free quantitative measurement for microfluidic paper-based analytical devices fabricated using the principles of movable-type printing. Anal. Chem. 2014, 86, 2005–2012. 10.1021/ac403026c. [DOI] [PubMed] [Google Scholar]
- Karita S.; Kaneta T. Acid–base titrations using microfluidic paper-based analytical devices. Anal. Chem. 2014, 86, 12108–12114. 10.1021/ac5039384. [DOI] [PubMed] [Google Scholar]
- Karita S.; Kaneta T. Chelate titrations of Ca2+ and Mg2+ using microfluidic paper-based analytical devices. Anal. Chim. Acta 2016, 924, 60–67. 10.1016/j.aca.2016.04.019. [DOI] [PubMed] [Google Scholar]
- Buking S.; Saetear P.; Tiyapongpattana W.; Uraisin K.; Wilairat P.; Nacapricha D.; Ratanawimarnwong N. Microfluidic paper-based analytical device for quantification of lead using reaction band-length for identification of bullet hole and its potential for estimating firing distance. Anal. Sci. 2018, 34, 83–89. 10.2116/analsci.34.83. [DOI] [PubMed] [Google Scholar]
- Shimada Y.; Kaneta T. Highly sensitive paper-based analytical devices with the introduction of a large-volume sample via continuous flow. Anal. Sci. 2018, 34, 65–70. 10.2116/analsci.34.65. [DOI] [PubMed] [Google Scholar]
- Hashimoto Y.; Kaneta T. Chromatographic paper-based analytical devices using an oxidized paper substrate. Anal. Methods 2019, 11, 179–184. 10.1039/c8ay02298d. [DOI] [Google Scholar]
- Piyanan T.; Athipornchai A.; Henry C. S.; Sameenoi Y. An instrument-free detection of antioxidant activity using paper-based analytical devices coated with nanoceria. Anal. Sci. 2018, 34, 97–102. 10.2116/analsci.34.97. [DOI] [PubMed] [Google Scholar]
- Yamada K.; Henares T. G.; Suzuki K.; Citterio D. Distance-based tear lactoferrin assay on microfluidic paper device using interfacial interactions on surface-modified cellulose. ACS Appl. Mater. Interfaces 2015, 7, 24864–24875. 10.1021/acsami.5b08124. [DOI] [PubMed] [Google Scholar]
- Ellerbee A. K.; Phillips S. T.; Siegel A. C.; Mirica K. A.; Martinez A. W.; Striehl P.; Jain N.; Prentiss M.; Whitesides G. M. Quantifying colorimetric assays in paper-based microfluidic devices by measuring the transmission of light through paper. Anal. Chem. 2009, 81, 8447–8452. 10.1021/ac901307q. [DOI] [PubMed] [Google Scholar]
- Swanson C.; Lee S.; Aranyosi A. J.; Tien B.; Chan C.; Wong M.; Lowe J.; Jain S.; Ghaffari R. Rapid light transmittance measurements in paper-based microfluidic devices. Sens. Biosens. Res. 2015, 5, 55–61. 10.1016/j.sbsr.2015.07.005. [DOI] [Google Scholar]
- Fiedoruk-Pogrebniak M.; Granica M.; Koncki R. Compact detectors made of paired LEDs for photometric and fluorometric measurements on paper. Talanta 2018, 178, 31–36. 10.1016/j.talanta.2017.08.091. [DOI] [PubMed] [Google Scholar]
- Nie Z.; Deiss F.; Liu X.; Akbulut O.; Whitesides G. M. Integration of paper-based microfluidic devices with commercial electrochemical readers. Lab Chip 2010, 10, 3163–3169. 10.1039/c0lc00237b. [DOI] [PMC free article] [PubMed] [Google Scholar]
- Zhao C.; Thuo M. M.; Liu X. A microfluidic paper-based electrochemical biosensor array for multiplexed detection of metabolic biomarkers. Sci. Technol. Adv. Mater. 2013, 14, 054402. 10.1088/1468-6996/14/5/054402. [DOI] [PMC free article] [PubMed] [Google Scholar]
- Fujimoto T.; Kawahara S.; Fuchigami Y.; Shimokawa S.; Nakamura Y.; Fukayama K.; Kamahori M.; Uno S. Portable electrochemical sensing system attached to smartphones and its incorporation with paper-based electrochemical glucose sensor. Int. J. Electr. Comput. Eng. 2017, 7, 1423–1429. 10.11591/ijece.v7i3.pp1423-1429. [DOI] [Google Scholar]
- Lau K.-T.; Baldwin S.; O’Toole M.; Shepherd R.; Yerazunis W. J.; Izuo S.; Ueyama S.; Diamond D. A low-cost optical sensing device based on paired emitter–detector light emitting diodes. Anal. Chim. Acta 2006, 557, 111–116. 10.1016/j.aca.2005.10.046. [DOI] [Google Scholar]
- Seetasang S.; Kaneta T. Development of a miniaturized photometer with paired emitter-detector light-emitting diodes for investigating thiocyanate levels in the saliva of smokers and non-smokers. Talanta 2019, 204, 586–591. 10.1016/j.talanta.2019.06.024. [DOI] [PubMed] [Google Scholar]


