

SUMMARY
Yeast ataxin-2, also known as Pbp1 (PolyA binding protein-binding protein 1), is an intrinsically disordered protein implicated in stress granule formation, RNA biology, and neurodegenerative disease. To understand the endogenous function of this protein, we identify Pbp1 as a dedicated regulator of TORC1 signaling and autophagy under conditions that require mitochondrial respiration. Pbp1 binds to TORC1 specifically during respiratory growth, but utilizes an additional methionine-rich, low complexity (LC) region to inhibit TORC1. This LC region causes phase separation, forms reversible fibrils, and enables self-association into assemblies required for TORC1 inhibition. Mutants that weaken phase separation in vitro exhibit reduced capacity to inhibit TORC1 and induce autophagy. Loss of Pbp1 leads to mitochondrial dysfunction and reduced fitness during nutritional stress. Thus, Pbp1 forms a condensate in response to respiratory status to regulate TORC1 signaling.
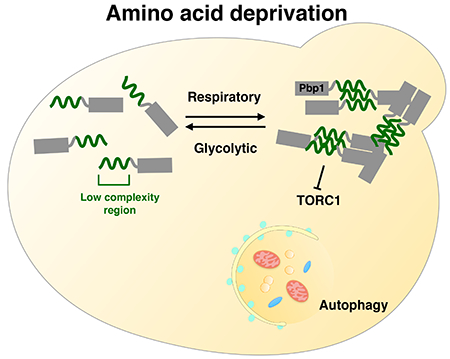
Graphical Abstract
eTOC Blurb
Unpacking the role of yeast ataxin-2 reveals that it preserves mitochondrial homeostasis, undergoing a condition-sensitive phase transition to modulate TORC1 function.
INTRODUCTION
TORC1 is a protein kinase complex that regulates many cellular processes including protein translation and cellular metabolism in response to nutrient availability (Wullschleger et al., 2006). Inhibition of TORC1 leads to the induction of autophagy, a process that degrades cytoplasmic contents and organelles to maintain cell viability during nutrient starvation (Levine and Klionsky, 2004). Dysregulation of TORC1 signaling and inhibition of autophagy have been associated with cancer and neurodegenerative diseases (Boland et al., 2008; Nixon, 2013; Ravikumar et al., 2004). Precisely how cells sense their metabolic state to alternately regulate anabolic versus catabolic processes mediated by TORC1 has yet to be fully elucidated.
We previously reported that when prototrophic yeast cells are switched from a rich (YP) to a minimal (S) medium using a non-fermentable carbon source (lactate), they induce autophagy despite the presence of nitrogen (Wu and Tu, 2011). This autophagy-inducing regimen which forces cells to heavily utilize mitochondria enabled us to identify additional autophagy regulators that become essential outside of highly glycolytic growth conditions. Using a visual screen, we identified genes encoding a complex of three proteins (Iml1-Npr2-Npr3) specifically required for the induction of autophagy following the switch from YPL to SL medium, but not for autophagy triggered by the complete nitrogen starvation in high glucose (SD-N medium) (Wu and Tu, 2011). This complex has emerged as the more evolutionary conserved negative regulator of TORC1 that functions in response to amino acid insufficiency (Bar-Peled et al., 2013; Panchaud et al., 2013).
Since our first report of this screen, we have sequenced additional transposon mutants that are defective in autophagy following the switch from YPL to SL medium. Here, we show that Pbp1, the yeast ortholog of mammalian ataxin-2, is also a previously unrecognized regulator of autophagy. Pbp1 and ataxin-2 are intrinsically disordered proteins that had earlier been implicated in stress granule assembly and RNA biology (Buchan et al., 2008; Nonhoff et al., 2007; Ralser et al., 2005). Triplet repeat expansions in ataxin-2 are strongly linked to neurodegenerative diseases such as spinocerebellar ataxia and amyotrophic lateral sclerosis (Alves-Cruzeiro et al., 2016; Elden et al., 2010). However, the normal endogenous function of Pbp1/ataxin-2 and the resulting impact of expanded glutamine tracts are not well understood. Here we show how Pbp1 functions as a bona fide negative regulator of TORC1 signaling via an unconventional mechanism involving metabolic state-induced phase separation. Elucidation of this endogenous function for Pbp1 and its mechanism of action may provide useful insight into how mutant, polyglutamine-expanded forms are associated with increased risk of neurodegenerative conditions.
RESULTS
Pbp1 regulates autophagy and cell growth under conditions that require mitochondrial respiration
To interrogate a possible role for Pbp1 in the regulation of autophagy, we assayed autophagy in wild-type (WT) and pbp1Δ cells under a growth condition that requires mitochondrial respiration (Figure 1A–C). In the presence of the non-fermentable carbon source lactate, cells lacking Pbp1 were unable to induce autophagy following the switch from rich (YPL) to minimal (SL) medium as determined by three different assays: appearance of Mito-DsRed reporter in vacuoles (Figure 1A), the GFP-cleavage assay that is indicative of mitophagy (Figure 1B), and the alkaline phosphatase (ALP) reporter assay as a quantitative measure of general autophagy (Figure 1C). In contrast, pbp1Δ mutants showed no deficit in autophagy induction upon switch to the more commonly utilized high glucose, nitrogen starvation condition (SD-N medium) (Figure S1A, B). These data suggest that the function of Pbp1 is selectively required when cell growth is restricted by non-fermentable carbon sources that require an increased dependency on mitochondria for energy.
Figure 1. Pbp1 induces autophagy during respiratory growth by inhibiting TORC1 signaling.
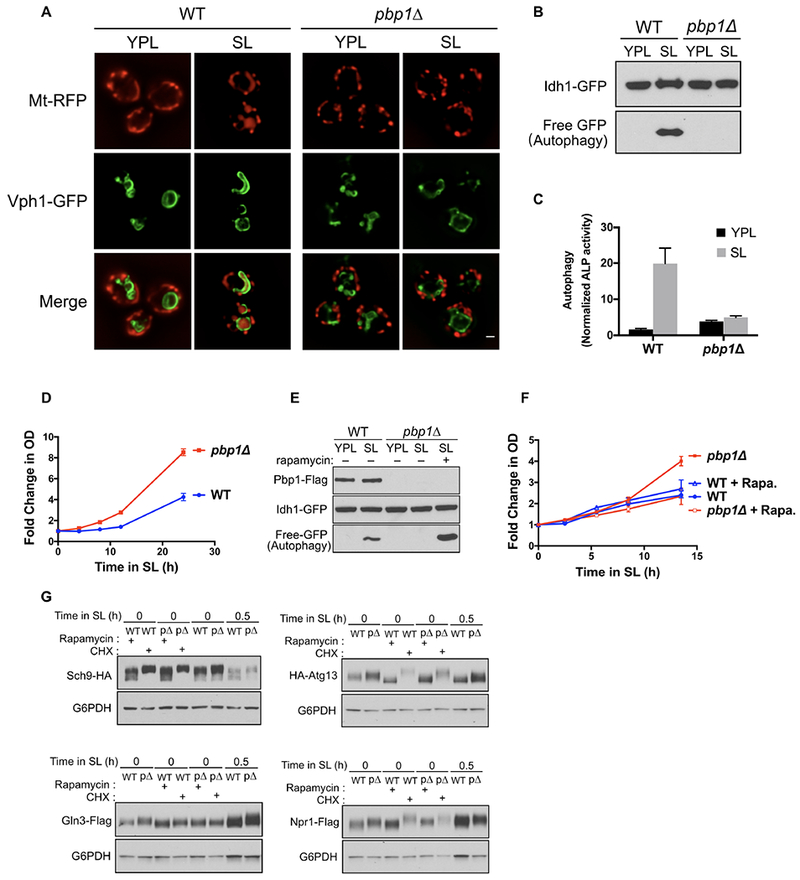
(A) Images of WT and pbp1Δ cells before and after switching from YPL to SL medium for 8 h. The accumulation of the mitochondria-targeted RFP (Mito-DsRed) reporter in the vacuole (Vph1-GFP) indicates mitophagy. pbp1Δ mutant cells were unable to induce mitophagy following switch to SL medium. Scale bar = 1 μm.
(B) GFP cleavage assay. The accumulation of free GFP following switch to SL medium indicates mitophagy. pbp1Δ cells were unable to induce mitophagy following switch to SL medium.
(C) ALP activity assay. Using a cytosolic alkaline phosphatase reporter, general autophagy was monitored using the alkaline phosphatase assay as described previously (Noda et al., 1995) and in Star Methods. pbp1Δ cells were unable to induce general autophagy following switch to SL medium. Data were mean ± s.d. from 5 independent experiments.
(D) Growth of WT and pbp1Δ cells in SL medium. pbp1Δ cells exhibited increased cell growth in SL medium. Data were mean ± s.d. from 3 independent experiments.
(E) GFP cleavage assay reflecting autophagy amounts in Pbp1Δ cells in SL medium with or without rapamycin (200 nM). Treatment with rapamycin completely restored autophagy in pbp1Δ cells.
(F) Growth of WT and pbp1Δ cells in SL medium containing 2 nM rapamycin. Treatment of rapamycin reversed the increased growth of pbp1Δ cells. Data were mean ± s.d. from 3 independent experiments. Rapa. : rapamycin.
(G) Phosphorylation of endogenously tagged Sch9, Atg13, Gln3, and Npr1 at the indicated time points before and after switch to SL medium. Phosphorylated species exhibit reduced migration during SDS-PAGE. Sch9 samples were analyzed using phos-tag SDS-PAGE. Rapamycin and cycloheximide (CHX) treatment were used to assess the migration of low and high phosphorylated states of these substrates. pbp1Δ mutant cells exhibited increased phosphorylation of TORC1 substrates following switch to SL medium.
Suppression of autophagy by deletion of core autophagy machinery components severely impedes cell growth following the switch to SL medium (Wu and Tu, 2011). Surprisingly, pbp1Δ cells exhibited a significantly increased growth rate in SL medium despite the lack of autophagy (Figure 1D), indicative of dysregulation of cellular growth control pathways. This increased growth phenotype of pbp1Δ was not observed when glucose was present as the carbon source (Figure S1C). Taken together, the lack of autophagy and abnormal growth phenotypes of pbp1Δ mutant cells in SL medium indicate the protein is involved in the regulation of cell growth under conditions that require mitochondrial respiration.
Pbp1 functions by negatively regulating TORC1 signaling
These phenotypes of pbp1Δ cells were reminiscent of mutants lacking the function of a three-protein complex (Iml1-Npr2-Npr3) previously identified to be required for autophagy under these conditions (Sutter et al., 2013; Wu and Tu, 2011). Subsequent work revealed that this complex, termed SEACIT or GATOR1, acts as a negative regulator of TORC1 (Bar-Peled et al., 2013; Panchaud et al., 2013). Interestingly, iml1MΔ, npr2Δ, and npr3Δ mutants all bypass autophagy and exhibit an increased growth rate in SL medium (Laxman et al., 2013; Wu and Tu, 2011), just like pbp1Δ mutants. These similarities suggest that the autophagy and growth phenotypes of pbp1Δ mutants might also be due to hyperactive TORC1 signaling.
We therefore tested whether Pbp1 might induce autophagy via negative regulation of TORC1 signaling. Treatment with rapamycin completely restored autophagy (Figure 1E) and reversed the increased growth of Pbp1-deficient cells in SL medium (Figure 1F), suggesting that these phenotypes are indeed mediated through TORC1. To assess whether the rapamycin-reversible phenotypes of pbp1Δ cells are due to increased TORC1 activity, we examined phosphorylation of TORC1-dependent substrates, Sch9, Atg13, Gln3, and Npr1. Each protein exhibited increased phosphorylation in pbp1Δ cells compared to WT following the switch to SL medium (Figure 1G).
We next performed a proteomic survey to investigate the basis of the increased growth of pbp1Δ mutants in SL medium. Using a SILAC (Stable-Isotope Labelling by Amino acids in Cell culture) experiment, we found the proteins that were most significantly increased in pbp1Δ cells in SL medium were enzymes involved in anabolic metabolism and biosynthesis (Figure S1D–E, and Table S1). In particular, proteins involved in ribosome biogenesis were significantly increased in abundance in pbp1Δ cells (Figure S1F and Table S2). Thus, the increased abundance of proteins involved in translation and anabolic biosynthesis was also consistent with the reporters of increased TORC1 activity in pbp1Δ cells. Taken together, these data suggest that pbp1Δ cells have hallmarks of hyperactive TORC1 signaling, and that Pbp1 is therefore a negative regulator of TORC1.
Pbp1 interacts with TORC1 specifically during respiratory growth
We next tested whether Pbp1 might interact with components of TORC1 as a possible mechanism of regulation. Taking into account growth conditions in which Pbp1 is required for autophagy, we observed that endogenous Kog1, the yeast ortholog of RAPTOR, co-immunoprecipitated with Pbp1 exclusively in the minimal lactate medium (SL), but not in minimal glucose medium (SD) (Figure 2A). Moreover, this interaction between Pbp1 and Kog1 in SL medium was substantially decreased following switch back to glucose medium (SD) (Figure 2B). In pbp1Δ cells, more TORC1 appeared associated with vacuolar membranes as assessed by imaging of Kog1-GFP expressed at an endogenous level (Figure S2A). Therefore, the association between Pbp1 and Kog1 is responsive to cellular metabolic conditions and is more prominent when cells are grown in a non-fermentable carbon source. Increased association between Pbp1 and TORC1 under these conditions is consistent with inhibition of TORC1 and reduced vacuolar localization.
Figure 2. Pbp1 binds to TORC1 specifically during respiratory growth independent of its putative RNA-binding domains.
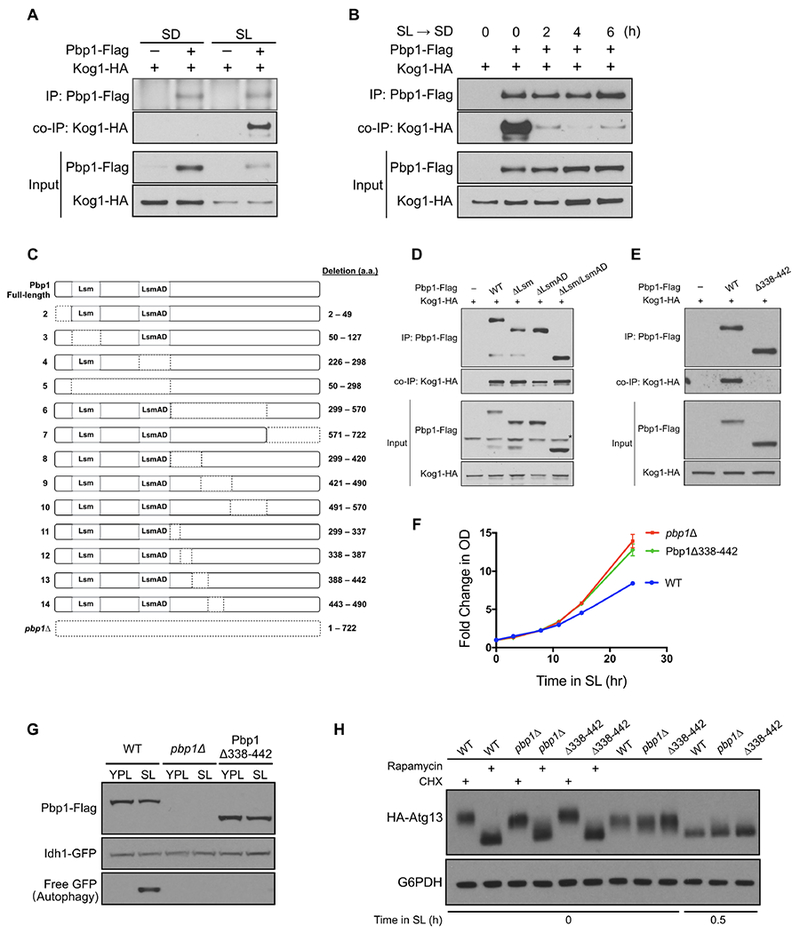
(A) Pbp1 interacts with TORC1 component Kog1 in cells grown in SL, but not SD medium. Cells with endogenously tagged Pbp1 and Kog1 grown in YPL medium were switched to SD or SL medium for 3 h. Flag-tagged Pbp1 in cell lysates was immunoprecipitated with an anti-Flag antibody. Co-immunoprecipitation of Kog1-HA was detected by immunoblotting with anti-HA antibody.
(B) Reduced interaction between Pbp1 and Kog1 following glucose repletion. Cells with endogenously tagged Pbp1 and Kog1 were switched from YPL to SL medium for 3 h and then switched back to SD medium for the indicated times. Immunoprecipitation was performed as described in (A).
(C) Schematic representation of Pbp1 deletion mutants. Dotted lines indicate the deleted region. These deletion mutants were assayed for their ability to interact with Kog1 (Figure 2D and S2E).
(D) Pbp1 variants lacking individual or both RNA-binding domains could still interact with Kog1. Cells were switched from YPL to SL medium for 3 h and immunoprecipitation was performed as described in (A). *non-specific band
(E) Pbp1 mutant lacking a.a.338-442 (Pbp1Δ338-442) was unable to interact with Kog1. Cells were switched from YPL to SL medium for 3 h and immunoprecipitation was performed as described in (A).
(F) Pbp1Δ338-442 exhibited similar growth compared to pbp1Δ cells in SL medium. Data were mean ± s.d. from 3 independent experiments.
(G) GFP cleavage assay. Cells expressing Pbp1Δ338-442 exhibited reduced autophagy after switching to SL medium.
(H) Pbp1Δ338-442 showed increased phosphorylation of endogenously tagged Atg13 similar to pbp1Δ cells.
To identify the region within Pbp1 required for binding to TORC1, we constructed a series of deletion mutants of Pbp1 (Figure 2C) and tested their ability to co-immunoprecipitate Kog1. Pbp1 possesses two putative RNA-binding domains, Like SM (Lsm) and Lsm Associated Domain (LsmAD), near its N-terminus, with the remainder of the protein having no predicted secondary structure (Figure 2C). Pbp1 mutants lacking one or both RNA binding domains (Figure 2C, mutant 3, 4, 5) retained the ability to interact with Kog1 (Figure 2D). The addition of RNase A to lysates also did not affect the interaction between Pbp1 and Kog1 (Figure S2B). The mutants lacking the RNA-binding domains also did not affect autophagy or growth (Figure S2C, D).
We then tested the ability of other Pbp1 truncation mutants to co-immunoprecipitate Kog1 (Figure S2E). We observed that the interaction between Pbp1 and Kog1 is mediated through a ~100 amino acid region (a.a. 338-442) downstream of the two putative RNA binding domains (Figure 2E and S2E – mutant 6, 8, 9, l2, l3). Pbp1 mutants lacking this region exhibited the same increased growth and defective autophagy phenotype as the pbp1Δ null mutant (Figure 2F, G), as well as increased phosphorylation of the TORC1-responsive substrate Atg13 (Figure 2H). These data demonstrate that an interaction between Pbp1 and Kog1 is required for the inhibition of TORC1 during respiratory growth.
Pbp1 self-associates to form nebulous assemblies
To further investigate how Pbp1 regulates TORC1 signaling, we examined a possible link to Pbp1 as a component of stress granules (Buchan et al., 2008). Under severe heat stress, Pbp1 was reported to sequester TORC1 in foci-like stress granules, which prevent TORC1 activation (Takahara and Maeda, 20l2). However, in cells expressing normal amounts of Pbp1-GFP, Pbp1 did not form any structures reminiscent of defined, foci-like granules in SL medium (Figure 3A). Two other stress granule markers, Pabl and Publ, also did not localize to foci-like granules in SL medium as compared to the glucose-deprivation medium (Figure S3A). Instead, Pbp1 exhibited a non-uniform distribution, and the protein appeared to be present in the form of dynamic, nebulous assemblies throughout the cell, reminiscent of a condensate (Banani et al., 20l7)(Figure 3A and Supplemental Movie S1). Treatment of cells with 1,6-hexanediol, an alcohol commonly used to disrupt weak hydrophobic interactions and disturb phase separation (Lin et al., 2016; Molliex et al., 2015; Ribbeck and Gorlich, 2002; Romero et al., 2007), caused the distribution of Pbp1 to become more uniform, further consistent with the idea that it forms a condensate in vivo (Figure S3B). Cycloheximide, which reportedly inhibits stress granule formation, did not change the distribution pattern of Pbp1 within cells (Figure S3C). Interestingly, in glucose medium, Pbp1 exhibited a more uniform distribution throughout the cytoplasm (Figure 3A).
Figure 3. Pbp1 self-associates into pelletable assemblies during respiratory growth.
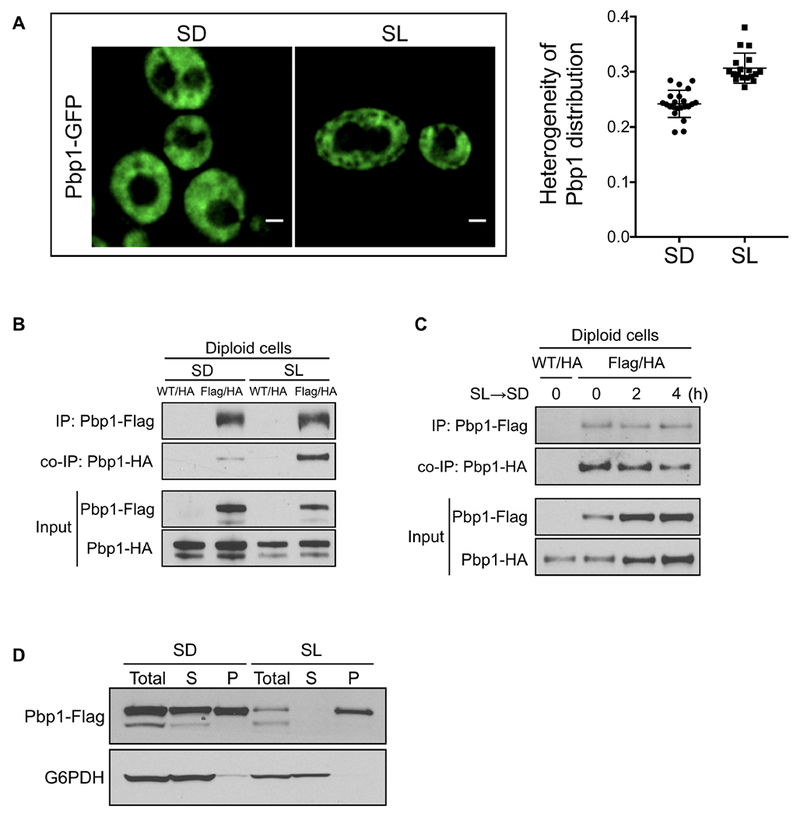
(A) Images of cells expressing Pbp1-GFP from the endogenous chromosomal locus. Images were taken after switch to SD for 8 h or SL for 6 h. Note that Pbp1 is distributed more heterogeneously in cells growing in SL medium. Scale bar = 1 μm. Plot comparing standard deviation/mean of Pbp1-GFP intensity in individual cells grown in SD vs. SL (p = 6 × 10⁻⁸, two-sample Kolmogorov-Smirnov test).
(B) Pbp1 self-associates in cells grown in SL medium. Diploid cells with endogenously Flag- and HA-tagged PBP1 alleles were switched from YPL to SD or SL medium for 6 h. Flag-tagged Pbp1 in cell lysates was precipitated with an anti-Flag antibody. Co-immunoprecipitation of Pbp1-HA was detected by immunoblotting with anti-HA antibody.
(C) Pbp1 self-association is decreased after glucose repletion. Diploid cells with endogenously Flag- and HA-tagged PBP1 alleles were switched from YPL to SL for 3 h and then switched back to SD medium for indicated times. Immunoprecipitation was performed as described in (B).
(D) Pbp1 is present primarily in the pellet fraction in cells grown in SL medium. Cells with endogenously tagged Pbp1 grown in YPL were switched to SD or SL medium for 6 h. Lysed cells were centrifuged for 1 h at 100,000g for separating supernatant (S) and pellet (P).
It has previously been suggested that Pbp1 has the potential to homo-multimerize (Mangus et al., 1998), which could explain its ability to form assemblies (Figure 3A). Using diploid cells expressing two different epitope-tagged versions of Pbp1, we examined the ability of Pbp1 to self-interact as assessed by co-immunoprecipitation from cell extracts. Pbp1 was strongly self-associated in extracts from cells grown in SL medium, in contrast to cells grown in SD (Figure 3B). Furthermore, the addition of glucose to cells growing in SL medium gradually reduced the ability of Pbp1 to self-associate (Figure 3C). Therefore, the ability of Pbp1 to interact with both itself and Kog1 is dynamic and responsive to cellular metabolic state.
Fractionation experiments showed that in cells grown in SL medium, the majority of Pbp1 protein was present in the pellet fraction, consistent with the idea that it may form large protein assemblies under such conditions (Figure 3D). However, in cells grown in glucose, substantial amounts of Pbp1 were present in the soluble fraction, in addition to the pellet fraction (Figure 3D). Taken together, these observations indicate that at normal expression levels and physiological temperatures, Pbp1 does not form foci-like granules and is instead present in the form of pelletable assemblies during respiratory growth, which may play a role in the negative regulation of TORC1.
A C-terminal low-complexity (LC) region of Pbp1 that phase separates is required for inhibition of TORC1
We next tested whether other regions of Pbp1 were required for self-association and perhaps the inhibition of TORC1. It has been noted that Pbp1 possesses a methionine- and proline-rich C-terminal region (Mangus et al., 1998). Sequence analysis of this region revealed that it is of low-complexity (LC) (Figure S4A), which is a feature of proteins that have a tendency to self-assemble or aggregate (Han et al., 2012; Molliex et al., 2015). To determine whether this region of Pbp1 might be necessary for regulating TORC1 signaling, we constructed a Pbp1 mutant lacking the C-terminal low-complexity region (Pbp1ΔLC) (Figure 4A). Upon assessment of its function in vivo, this mutant exhibited increased phosphorylation of Atg13 (Figure 4B), reduced autophagy (Figure 4C), and an increased growth phenotype indistinguishable from pbp1Δ cells (Figure 4D).
Figure 4. The C-terminal low-complexity (LC) region of Pbp1 can phase separate and is required for inhibition of TORC1.
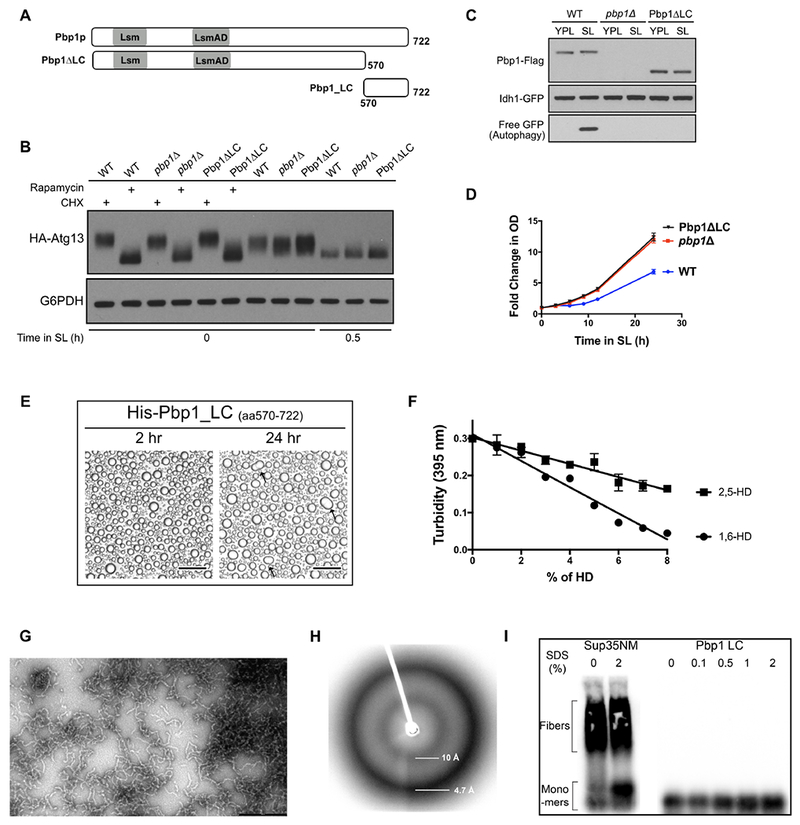
(A) Schematic of domains present in Pbp1. Pbp1ΔLC lacks the C-terminal LC region, and Pbp1_LC denotes the C-terminal LC region alone.
(B) Cells expressing Pbp1ΔLC exhibited increased phosphorylation of endogenously tagged Atg13 similar to pbp1Δ cells.
(C) GFP cleavage assay showing cells expressing Pbp1ΔLC completely lost the ability to induce autophagy following switch to SL medium.
(D) Growth curves showing cells expressing Pbp1ΔLC exhibited similar growth compared to pbp1Δ cells.
(E) Phase-separated droplet formation by purified His6-Pbp1_LC (2 mg/mL, ~ 100 μM). Images were taken 2 h and 24 h after lowering the salt concentration. Scale bar = 50 μm
(F) Dissolution of His6-Pbp1_LC phase-separated droplets by aliphatic alcohols. Turbidity changes of the phase-separated droplet solution containing the indicated concentration of 1,6-HD or 2,5-HD were measured by light absorbance at 395 nm. Note that the droplets were more sensitive to 1,6-HD. Data were mean ± s.d. from 3 independent experiments.
(G) Electron micrographs of GFP-Pbp1_LC fibrils. Pbp1_LC formed uniformly similar, polymeric fibrils. Scale bar: 500 nm.
(H) X-ray diffraction pattern of His6-Pbp1_LC polymer pellets. Clear X-ray reflections were observed at 4.7Å and 10Å indicative of a cross-β structure.
(I) SDD-AGE analysis of yeastSup35 NM amyloid polymers and His6-Pbp1_LC polymers. SDS exposure did not substantially affect ySup35 NM amyloid polymers whereas Pbp1_LC polymers were fully depolymerized under all conditions.
To assess the biochemical features of this LC region, we recombinantly expressed and purified a fragment comprising this portion of Pbp1 (Pbp1_LC, a.a.570-722) (Figure 4A). Upon lowering the salt concentration to physiological levels, this purified fragment readily phase-separated into droplets in vitro (Figure 4E), and the droplets were stable within the time observed. In addition, these Pbp1_LC droplets were sensitive to 1,6-hexanediol. The droplets exhibited higher sensitivity to 1,6-hexanediol compared to 2,5-hexanediol (Figure 4F), which can be a property of proteins that phase separate (Kroschwald et al., 2015; Lin et al., 2016; Shi et al., 2017).
Using electron microscopy, we further observed that purified Pbp1_LC could readily form fibrils of 10-20 nm in length (Figure 4G). Consistent with the phase-separated droplets, these fibrils were also more sensitive to 1,6-hexanediol (Figure S4B). X-ray diffraction analysis of Pbp1_LC yielded a characteristic diffraction pattern with circular reflections at 4.7 A and 10 A, indicating that the fibrils are of cross-β structure (Figure 4H) (Astbury et al., 1935; Geddes et al., 1968; Sunde and Blake, 1997). These Pbp1_LC fibrils were highly labile, and completely disassembled upon incubation at 37°C in the absence of SDS, in contrast to fibers formed by the yeast prion protein Sup35 (Figure 4I). Taken together, these observations suggest that the C-terminal LC region of Pbp1 has a propensity to self-associate into reversible, higher-order assemblies of cross-β structure.
The C-terminal LC region enables Pbp1 to self-associate and form a perimitochondrial condensate in vivo
We next examined whether this C-terminal LC region of Pbp1 enables its self-association in cells. We expressed a variant of Pbp1 lacking the C-terminal LC region (Pbp1ΔLC) in diploid cells with two different tags, and assayed self-association using immunoprecipitation. In contrast to full-length Pbp1, Pbp1ΔLC showed reduced ability to self-associate (Figure 5A). Moreover, the Pbp1ΔLC mutant was less concentrated in the pellet after fractionation (Figure 5B).
Figure 5. The ability of Pbp1 to self-associate is mediated by the C-terminal low complexity region.
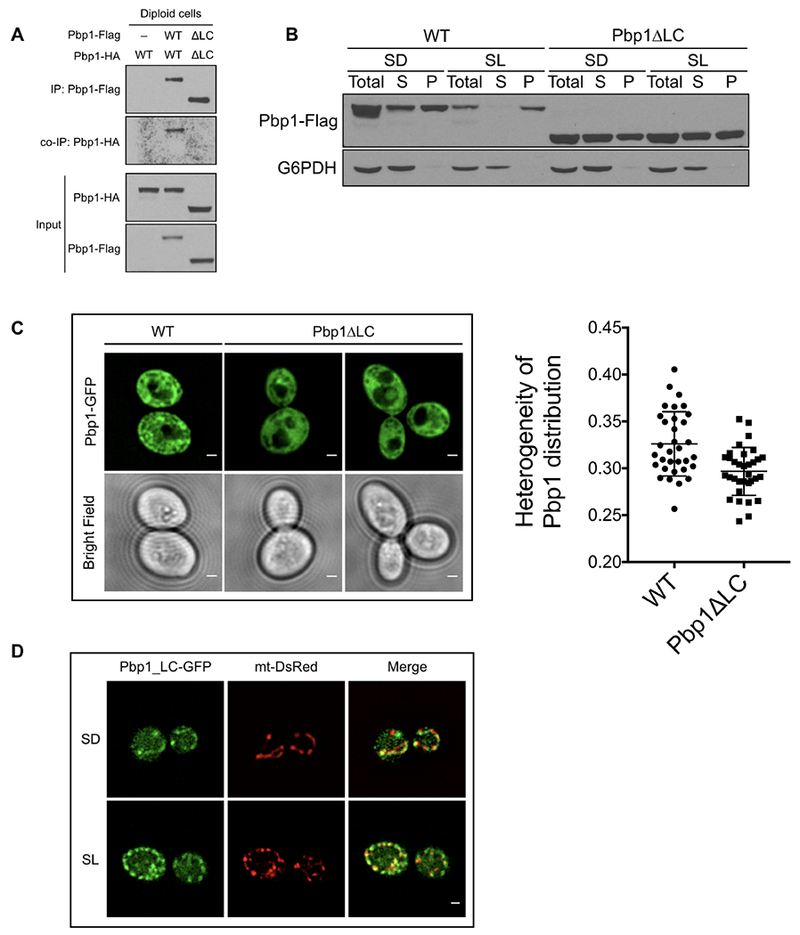
(A) Pbp1ΔLC cannot self-associate in cells grown in SL medium. Diploid cells expressing endogenously Flag- and HA-tagged Pbp1ΔLC alleles were switched from YPL to SL medium for 3 h. Flag-tagged Pbp1ΔLC in cell lysates was precipitated with an anti-Flag antibody. Co-immunoprecipitation of Pbp1ΔLC-HA was detected by immunoblotting with anti-HA antibody.
(B) Western blot showing the distribution of Pbp1 WT and Pbp1ΔLC variant in SD or SL medium. Pbp1ΔLC was less concentrated in the pellet fraction in SL medium. Cells were cultured and processed as described in Figure 3D.
(C) Images of cells expressing Pbp1-GFP or Pbp1ΔLC at endogenous levels in SL medium. Note that Pbp1ΔLC exhibited a more uniform distribution pattern throughout the cytosol. Plot comparing the heterogeneity of Pbp1 distribution (standard deviation/mean) in individual cells expressing either Pbp1-GFP or Pbp1ΔLC-GFP (p = 0.0185, two-sample Kolmogorov-Smirnov test).
(D) Images of cells expressing Pbp1_LC-GFP at endogenous levels and the mitochondria-targeted RFP reporter (mt-DsRed) in SD and SL medium. Note that Pbp1_LC formed punctate-like structures that appear perimitochondrial in both media. Scale bar = 1 μm.
Pbp1ΔLC also exhibited a more uniform distribution pattern throughout the cytosol compared to full-length Pbp1 protein (Figure 5C). When the C-terminal LC region of Pbp1 alone was expressed in cells, we observed that it formed punctate-like structures in both lactate and glucose medium (Figure 5D). Interestingly, these Pbp1_LC puncta were perimitochondrial (Figure 5D). Full-length Pbp1 did not co-localize with organelles such as the vacuole or endoplasmic reticulum (Figure S5). However, using a mitochondrial DsRed marker, we observed that Pbp1 appeared to be proximal, but exclusive of the mitochondria (Figure S5). Therefore, the C-terminal LC region of Pbp1 may enable the protein to form a nebulous condensate proximal to the mitochondria. Collectively, these results suggest that the propensity of the C-terminal LC region to phase separate may explain the non-uniform distribution of full-length Pbp1, its ability to self-associate to form pelletable assemblies, as well as its ability to inhibit TORC1 in vivo.
Methionine residues in the C-terminal LC region of Pbp1 influence stability of phase separation and are critical for inhibition of TORC1
Sequence analysis of the Pbp1 C-terminal LC region revealed an unusually high frequency of methionine residues (24 methionines in 150 a.a.) compared to the rest of the yeast proteome (Figure 6A and B). To test the importance of these methionines, we constructed a series of C-terminal truncation mutants lacking increasing numbers of methionine residues (Figure 6C), and examined their ability to induce autophagy in SL medium (Figure 6D).
Figure 6. Methionine residues in the C-terminal LC region of Pbp1 influence stability of phase separation and are critical for inhibition of TORC1.
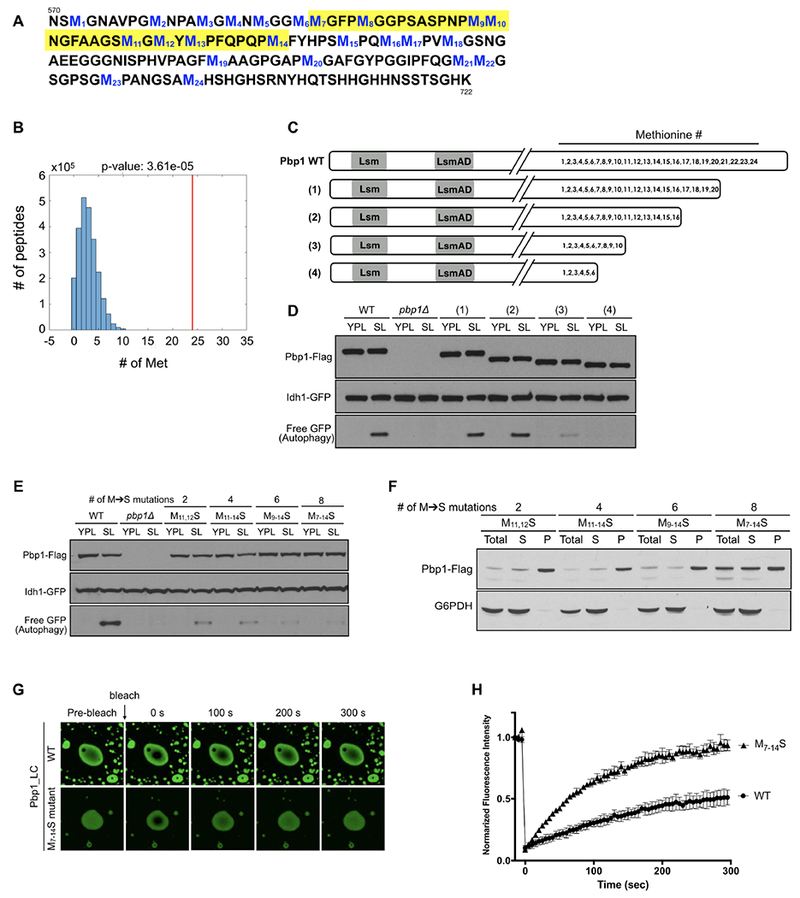
(A) Amino acid sequence of the Pbp1 C-terminal LC region. The 24 methionine residues are numbered and highlighted in blue. The yellow highlighted region denotes the critical methionine residues for function deduced from the experiments below.
(B) The C-terminal low complexity region of Pbp1 has unusually high methionine content compared to the rest of the yeast proteome. Plot showing methionine content per 150 amino acids across the yeast proteome. Individual proteins were analyzed using a sliding window of a length of 150 a.a., and the number of methionines was counted for each 150 a.a. window. The number of 150 a.a. peptides (Y-axis) with indicated numbers of methionine residues (X-axis) was plotted. Red line indicates the position of the Pbp1 C-terminal LC region (24 methionines).
(C) Schematic representation of a series of C-terminal truncation mutants lacking increasing numbers of methionine residues.
(D) GFP cleavage assay showing autophagy in cells expressing the mutants depicted in (C). Cells expressing Pbp1 mutants lacking the region containing M11 to M16 (mutant (3), (4)) showed reduced autophagy.
(E) GFP cleavage assay showing autophagy in cells expressing Pbp1 mutants with indicated methionine to serine point mutations. Cells expressing Pbp1 with 8 methionine mutations (M7-14->S) showed severely reduced autophagy.
(F) Western blot showing the distribution of Pbp1 mutant proteins with indicated methionine to serine mutations in SL medium. The Pbp1 protein containing 8 methionine mutations (M7-14->S) was less concentrated in the pellet fraction. Cells were cultured and processed as described in Figure 3D.
(G) FRAP (fluorescence recovery after photobleaching) analysis of phase-separated droplets formed by purified Pbp1_LC WT or M7-14->S variant (~100 μM). See also Supplemental Movies S2 and S3.
(H) Quantification of FRAP in (G). Note the phase-separated droplets of Pbp1_LC M7-14->S recovered faster compared to WT. Plots are generated from 9 droplets in 3 independent experiments.
We observed that a Pbp1 mutant lacking a region containing the last 8 methionines (M17-M24) (Figure 6C, mutant (2)) could still induce autophagy, but further deletion of a region that contains M11-M16 significantly reduced autophagy (Figure 6D), suggesting the importance of this subset of methionines for function. By mutating pairs of adjacent methionine residues amongst M11-M16 to serine, we observed that Pbp1_LC M11, 12 ->S exhibited the weakest ability to form fibrils in vitro (Figure S6A). We therefore mutated M11, M12 and immediately upstream and downstream methionine residues to serine, to generate a series of mutants containing 2, 4, 6, or 8 M->S mutations.
Strikingly, increasing the number of M -> S substitutions within this region gradually reduced the ability of Pbp1 to induce autophagy in cells. In particular, the M7-14S mutant exhibited severely reduced autophagy (Figure 6E). Moreover, this mutant protein was less concentrated in the pellet fraction, with a substantial amount instead present in the soluble fraction (Figure 6F).
We then tested the effect of increasing numbers of methionine mutations on phase-separated droplet formation of the LC region. All of the mutant combinations tested still phase-separated into droplets (Figure S6B). However, variants harboring increasing numbers of methionine mutations significantly decreased the stability of phase separated droplets as the droplets dissolved more readily upon lowering the protein concentration (Figure S6C). Using a fluorescence recovery after photobleaching (FRAP) assay, we observed that the Pbp1_LC M7-14S droplets were able to recover much faster compared to WT droplets (Figure 6G–H, and Supplemental Movies S2, S3), consistent with their decreased stability. Therefore, the functional WT Pbp1_LC region exhibits slower FRAP and is more solid-like, whereas a non-functional mutant in vivo exhibits faster FRAP and is more liquid-like. Taken together, we observed a strong correlation between the stability of phase-separated droplets in vitro, and the ability of the protein to sediment to the pellet and induce autophagy in cells.
Pbp1 is important for maintaining cellular fitness and mitochondrial function
Cells lacking Pbp1 bypass autophagy and continue to grow inappropriately under conditions that require mitochondrial respiration. To investigate the physiological consequences of loss of Pbp1, we measured the cell division times of more than 1000 WT and pbp1Δ cells as they replicatively age in SL medium using a microfluidic device. Newly born pbp1Δ daughter cells exhibited a shorter G1 phase (Figure 7A), which is consistent with the increased growth phenotype in batch cultures (Figure 1D). However, after the first few divisions, pbp1Δ mother cells displayed significantly protracted division times in comparison to WT mother cells (Figure 7B). Strikingly, when pbp1Δ cells were grown in glucose, their division times were comparable to WT even after many divisions (Figure S7A). Moreover, there were substantially more pbp1Δ cells that appeared replicatively senescent (>2000 min between divisions) (Figure 7C) or with abnormal morphology (Figure 7D, and S7B).
Figure 7. Pbp1 is important for maintaining cellular fitness and mitochondrial function.
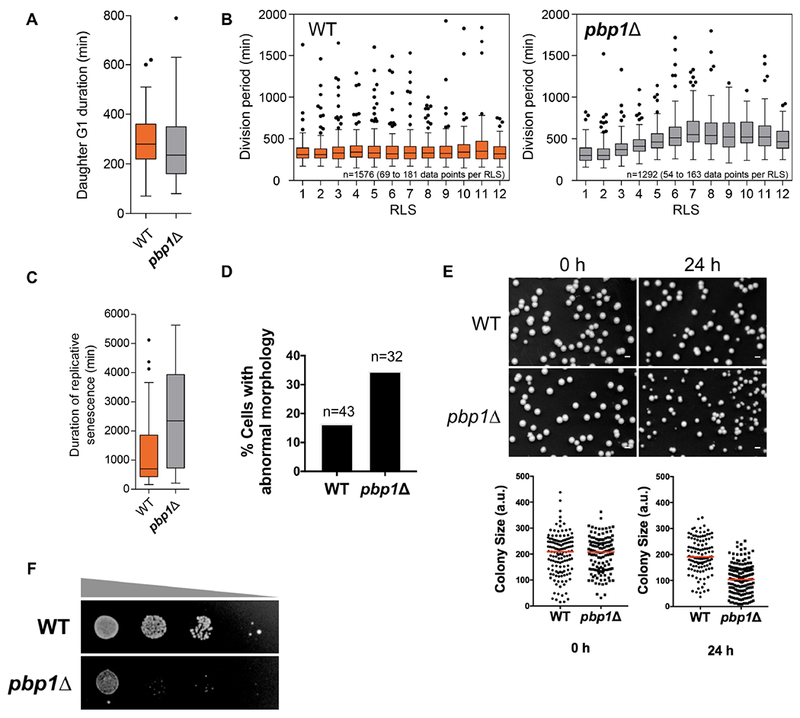
(A) Newly born pbp1Δ cells exhibited a shorter G1 phase in SL medium. Box plots showing the duration of G1 in WT (n=51) and pbp1Δ (n=44) daughter cells.
(B) pbp1Δ cells exhibited protracted division times after the first few divisions in SL medium. The division period was plotted against replicative life span (RLS) for WT and pbp1Δ cells. Each box plot contains data from n=69-181 and n=54-163 for WT and pbp1Δ cells, respectively. In total, data from 1576 (WT) and 1292 (pbp1Δ) division events were recorded.
(C) Box plots showing the duration of replicative senescence in WT (n=43) and pbp1Δ (n=34) cells.
(D) More pbp1Δ cells (11 in 32) displayed abnormal morphology at terminal stage compared to WT cells (7 in 43).
(E) pbp1Δ cells produced significantly more petites after a prolonged period in stationary phase. Cells were switched from YPL to SL medium, and grown to stationary phase. ~350 cells were plated onto YPD at indicated time points after entering stationary phase. Colony sizes were analyzed using ImageJ. Scale bar = 0.2 cm.
(F) Spotting assay on SL plates showing the survivability of WT and pbp1Δ cells at 24 h after stationary phase. Note that pbp1Δ cells exhibited reduced survivability compared to WT.
To examine a possible role for Pbp1 in maintaining mitochondrial function, we grew WT and pbp1Δ cells in SL to stationary phase as a means of chronic nutritional stress. After a prolonged period in stationary phase, pbp1Δ cells produced significantly more petites (Figure 7E), suggesting that many cells gradually lost mitochondrial respiratory function, as well as reduced survivability (Figure 7F). It thus appears that mitochondrial dysfunction and cell death may emerge due to loss of Pbp1 following prolonged metabolic or nutritional stress, or as a function of age. Consistent with this idea, the abundance of Pbp1 appears to decrease substantially in replicatively aged cells (Janssens et al., 2015). Pbp1 may therefore sense respiratory status and mitochondrial dysfunction to properly modulate TORC1 signaling.
DISCUSSION
In this study, we show that Pbp1 is a bona fide negative regulator of TORC1 signaling whose function becomes especially important when cells heavily utilize mitochondria for energy production. Loss of Pbp1 function most prominently results in phenotypes associated with hyperactive TORC1 signaling, which include the inhibition of autophagy and increased anabolic metabolism due to promoting the biosynthetic functions of mitochondria (Chen et al., 2017). There has been a lack of clarity regarding the normal physiological function of Pbp1. Previous studies have implicated the protein in various aspects of RNA processing and as a component of stress granules (Buchan et al., 2008; Mangus et al., 1998; Swisher and Parker, 2010). However, during respiratory growth under physiological temperatures and expression levels, we find no evidence that Pbp1 forms discrete, punctate-like bodies that are typically associated with stress granules. Instead, it forms a more disperse condensate whose properties are dependent on the metabolic state. When cells are growing in lactate, Pbp1 is almost exclusively in the pellet fraction and exhibits a more non-uniform localization throughout the cytosol. With the ability to associate with Kog1, this form of Pbp1 appears to be capable of inhibiting the TORC1 complex.
However, we further identified an unusual, methionine-rich low complexity region of Pbp1 that is also required for the inhibition of TORC1. This LC region readily phase separates to form droplets in vitro. Mutational analysis revealed a specific subset of methionine residues that weaken phase separation. Importantly, these same methionines are critical for inhibition of TORC1 and induction of autophagy in vivo. Taken together, our findings reveal how Pbp1 inhibits TORC1 through an unconventional mechanism involving phase separation. The C-terminal LC region enables Pbp1 to form an intracellular condensate, which is required for inhibiting TORC1 during respiratory growth. TORC1 still appears present at vacuoles in SL medium, but at reduced amounts compared to pbp1Δ cells (Figure S2A), which is potentially consistent with a physical sequestration model of inhibition (Takahara and Maeda, 2012). However, since a portion of the protein outside of the C-terminal LC region mediates actual binding to TORC1 (Figure 2E and S2E), we propose that an additional mechanism linked to phase separation of the LC region is required for the inhibition of TORC1, perhaps through modulation of distinct conformational or oligomeric states of TORC1 (Prouteau et al., 2017).
Ataxin-2 is the mammalian ortholog of yeast Pbp1. Polyglutamine expansions near the N-terminus of human ataxin-2 are linked to both ALS and spinocerebellar ataxia. However, just like yeast Pbp1, the normal physiological function of ataxin-2 remains unclear (Alves-Cruzeiro et al., 2016; Carmo-Silva et al., 2017; Lastres-Becker et al., 2008). Mutants lacking ataxin-2 have been constructed in multiple species and exhibit several phenotypes consistent with those reported here for Pbp1 as a negative regulator of TORC1. These include increased ribosomal protein amounts (Fittschen et al., 2015), and increased body size of dietary-restricted animals that is accompanied by more rapid animal development (Bar et al., 2016). In addition, ataxin-2 has been reported to cross-talk with disease-associated proteins such as C9orf72 and Gr2b (growth factor receptor-bound protein 2), pointing to putative functions in autophagy and nutrient signaling (Drost et al., 2013; Sellier et al., 2016). Consistent with results herein, a recent report also demonstrates that a C-terminal intrinsically disordered region of ataxin-2 mediates the formation of RNP granules in Drosophila cells (Bakthavachalu et al., 2018). Our findings on the function and consequences of loss of Pbp1 in yeast suggest that compromising ataxin-2 function in neurons might result in mitochondrial dysfunction, energetic crisis, and eventually apoptosis, hallmarks that have all been linked to neurodegenerative disease (Nixon, 2013; Tatton and Olanow, 1999).
Lastly, why might an intracellular condensate be required to regulate TORC1 specifically during respiratory growth? In addition to ATP synthesis, the mitochondria also play a key role in the biosynthesis of nitrogen-containing amino acids, which is promoted by activation of TORC1 (Chen et al., 2017; Laxman et al., 2014). An increased reliance on mitochondria for ATP synthesis leads to an increased dependency on inhibitors of TORC1 to toggle the mitochondria between ATP and biosynthesis modes in tune with the metabolic state or demands of the cell. Since cells lacking Pbp1 begin to exhibit mitochondrial dysfunction and reduced survivability following prolonged nutritional stress or as a function of age under respiratory conditions, we propose that Pbp1 specifically senses some aspect of mitochondrial activity or dysfunction to adjust TORC1 for purposes of sustaining mitochondrial health. In the accompanying paper, we show precisely how the methionine-rich LC region of Pbp1 senses hydrogen peroxide as a signal of mitochondrial dysfunction to subsequently modulate TORC1 signaling for metabolic adaptation (Kato et al., 2019)(accompanying manuscript). In closing, our findings have revealed an unanticipated spatial organization and regulation of signaling and metabolism within the cell necessitated by mitochondrial respiration.
STAR METHODS
CONTACT FOR REAGENT AND RESOURCE SHARING
Further information and requests for resources and reagents should be directed to and will be fulfilled by the Lead Contact, Benjamin Tu (benjamin.tu@utsouthwestern.edu)
EXPERIMENTAL MODEL AND SUBJECT DETAILS
Yeast strains
The prototrophic Saccharomyces cerevisiae CEN.PK strain (van Dijken et al., 2000) was used in all experiments. All strains used in this study are listed in the KEY RESOURCES TABLE. Gene deletions were carried out using standard PCR-based strategies to amplify resistance cassettes with appropriate flanking sequences, and replacing the target gene by homologous recombination (Longtine et al., 1998). C-terminal tags were similarly made using PCR to amplify resistance cassettes with flanking sequences. The diploid strain was constructed by standard mating procedures. Pbp1 mutants with various domain deletion or point mutations were first made using PCR and then integrated into the PBP1 locus in a pbp1Δ strain with different selection markers.
KEY RESOURCES TABLE
| REAGENT or RESOURCE | SOURCE | IDENTIFIER |
|---|---|---|
| Antibodies | ||
| Mouse monoclonal anti-Flag | Sigma | Cat#F1804; RRID: AB_262044 |
| Rabbit anti-FLAG M2 antibody | Cell signaling | Cat#2368; RRID: AB_2217020 |
| Mouse monoclonal Anti-GFP (clone 7.1 and 13.1) | Roche | Cat#11814460001; RRID: AB_390913 |
| Rabbit Anti-HA antibody | Cell signaling | Cat#3724; RRID: AB_1549585 |
| Rabbit Anti-G6PD ab2 | Sigma | Cat#A9521; RRID: AB_258454 |
| Bacterial and Virus Strains | ||
| N/A | ||
| Biological Samples | ||
| N/A | ||
| Chemicals, Peptides, and Recombinant Proteins | ||
| Rapamycin | Calbiochem | Cat#553210 |
| Cycloheximide | Sigma | Cat#C7698 |
| Ribonuclease A | Sigma | Cat#R4642 |
| H2O2 | Sigma | Cat#216763 |
| Antimycin A | Sigma | Cat#A8674 |
| Dynabeads protein G | Life technologies | Cat#10004D |
| 1,6-hexanediol | Sigma | Cat#240117 |
| 2,5-hexanediol | Sigma | Cat#411904 |
| Phos-tag Acrylamide | Wako chemical laboratory | Cat#304-93521 |
| Protease inhibitor cocktail | Roche | Cat#5056489001 |
| p-nitrophenyl phosphate | Life Technologies | Cat#002201 |
| L-Lysine:2HCl (U-13C6,99%; U-15N2,99%) | Cambridge Isotope Laboratories | Cat#CNLM-291-H-0.05 |
| L-Arginine:HCl (U-13C6,99%; U-15N4,99%) | Cambridge Isotope Laboratories | Cat#CNLM-539-H-0.1 |
| Critical Commercial Assays | ||
| BCA protein assay kit | Thermo | Cat#23227 |
| Deposited Data | ||
| N/A | ||
| Experimental Models: Cell Lines | ||
| N/A | ||
| Experimental Models: Organisms/Strains | ||
| Sccharomyces cerevisiae strain CEN.PK: genotype: ho∷ADH1P-Mito-dsRed∷KanMX, Vph1-GFP∷natNT | Wu et al., 2011 | N/A |
| S.cerevisiae strain CEN.PK: genotype: ho∷ADH1P-Mito-dsRed∷KanMX, Vph1-GFP∷natNT, pbp1Δ∷Hyg | this paper | N/A |
| S.cerevisiae strain CEN.PK: genotype: Idh1-GFP∷KanMX | Wu et al., 2011 | N/A |
| S.cerevisiae strain CEN.PK: genotype: Idh1-GFP∷KanMX, pbp1Δ∷Hyg | this paper | N/A |
| S.cerevisiae strain CEN.PK: genotype: pho8∷TEF1p-pho8∆60∷KanMX, pho13T∷natNT | Wu et al., 2011 | N/A |
| S.cerevisiae strain CEN.PK: genotype: pho8∷TEF1p-pho8∆60∷KanMX, pho13T∷natNT, pbp1Δ∷Hyg | this paper | N/A |
| S.cerevisiae strain CEN.PK: genotype: WT | van Dijken et al., 2000 | N/A |
| S.cerevisiae strain CEN.PK: genotype: pbp1Δ∷Hyg | this study | N/A |
| S.cerevisiae strain CEN.PK: genotype: Sch9-3xHA∷natNT | Laxman et al., 2014 | N/A |
| S.cerevisiae strain CEN.PK: genotype: Sch9-3xHA∷natNT, pbp1Δ∷Hyg | this paper | N/A |
| S.cerevisiae strain CEN.PK: genotype: 3HA-Atg13∷natNT | Wu et al., 2011 | N/A |
| S.cerevisiae strain CEN.PK: genotype: 3HA-Atg13∷natNT, pbp1Δ∷Hyg | this paper | N/A |
| S.cerevisiae strain CEN.PK: genotype: lys1Δ∷KanMX , arg1Δ∷Hyg | Laxman et al., 2013 | N/A |
| S.cerevisiae strain CEN.PK: genotype: lys1Δ∷KanMX , arg1Δ∷Hyg, pbp1Δ∷natNT | this paper | N/A |
| S.cerevisiae strain CEN.PK: genotype: Kog1-3xHA∷KanMX | this paper | N/A |
| S.cerevisiae strain CEN.PK: genotype: Kog1-3xHA∷KanMX, Pbp1-3xFlag∷Hyg | this paper | N/A |
| S.cerevisiae strain CEN.PK: genotype: Pbp1-GFP∷Hyg | this paper | N/A |
| S.cerevisiae strain CEN.PK: genotype: Pbp1-3xFlag∷Hyg | this paper | N/A |
| S.cerevisiae strain CEN.PK: genotype: Pbp1-GFP∷Hyg, Vph1-mCherry∷KanMX | this paper | N/A |
| S.cerevisiae strain CEN.PK: genotype: Pbp1-GFP∷Hyg, Sec63-mCherry∷KanMX | this paper | N/A |
| S.cerevisiae strain CEN.PK: genotype: ho∷ADH1P-Mito-dsRed∷KanMX, Pbp1-GFP∷Hyg | this paper | N/A |
| S.cerevisiae strain CEN.PK Diploid: genotype: WT/Pbp1-3xHA∷KanMX | this paper | N/A |
| S.cerevisiae strain CEN.PK Diploid: genotype: Pbp1-3xFlag∷Hyg/Pbp1-3xHA∷KanMX | this paper | N/A |
| S.cerevisiae strain CEN.PK: genotype: Idh1-GFP∷KanMX, pbp1Δ∷pbp1Δa.a.50-127-3xFlag∷Hyg | this paper | N/A |
| S.cerevisiae strain CEN.PK: genotype: Idh1-GFP∷KanMX, pbp1Δ∷pbp1Δa.a.226-298-3xFlag∷Hyg | this paper | N/A |
| S.cerevisiae strain CEN.PK: genotype: Idh1-GFP∷KanMX, pbp1Δ∷pbp1Δa.a.50-298-3xFlag∷Hyg | this paper | N/A |
| S.cerevisiae strain CEN.PK: genotype: pbp1Δ∷pbp1Δa.a.50-127-3xFlag∷Hyg | this paper | N/A |
| S.cerevisiae strain CEN.PK: genotype: pbp1Δ∷pbp1Δa.a.226-298-3xFlag∷Hyg | this paper | N/A |
| S.cerevisiae strain CEN.PK: genotype: pbp1Δ∷pbp1Δa.a.50-298-3xFlag∷Hyg | this paper | N/A |
| S.cerevisiae strain CEN.PK: genotype: pbp1Δ∷pbp1a.a.571-722-GFP∷Hyg | this paper | N/A |
| S.cerevisiae strain CEN.PK: genotype: pbp1Δ∷pbp1Δa.a.571-722-3xFlag∷Hyg | this paper | N/A |
| S.cerevisiae strain CEN.PK: genotype: pbp1Δ∷pbp1Δa.a.571-722-GFP∷Hyg | this paper | N/A |
| S.cerevisiae strain CEN.PK: genotype: Idh1-GFP∷KanMX, pbp1Δ∷pbp1Δa.a.571-722-3xFlag∷Hyg | this paper | N/A |
| S.cerevisiae strain CEN.PK: genotype: Idh1-GFP∷KanMX, pbp1Δ∷pbp1M614,616S-3xFlag∷Hyg | this paper | N/A |
| S.cerevisiae strain CEN.PK: genotype: Idh1-GFP∷KanMX, pbp1Δ∷pbp1M614,616, 618, 625S-3xFlag∷Hyg | this paper | N/A |
| S.cerevisiae strain CEN.PK: genotype: Idh1-GFP∷KanMX, pbp1Δ∷pbp1M605, 606, 614,616, 618, 625S-3xFlag∷Hyg | this paper | N/A |
| S.cerevisiae strain CEN.PK: genotype: Idh1-GFP∷KanMX, pbp1Δ∷pbp1M591, 595, 605, 606, 614,616, 618, 625S-3xFlag∷Hyg | this paper | N/A |
| S.cerevisiae strain CEN.PK: genotype: pbp1Δ∷pbp1M614,616S-3xFlag∷Hyg | this paper | N/A |
| S.cerevisiae strain CEN.PK: genotype: pbp1Δ∷pbp1M614,616, 618, 625S-3xFlag∷Hyg | this paper | N/A |
| S.cerevisiae strain CEN.PK: genotype: pbp1Δ∷pbp1M605, 606, 614,616, 618, 625S-3xFlag∷Hyg | this paper | N/A |
| S.cerevisiae strain CEN.PK: genotype: pbp1Δ∷pbp1M591, 595, 605, 606, 614,616, 618, 625S-3xFlag∷Hyg | this paper | N/A |
| S.cerevisiae strain CEN.PK: genotype: atg1Δ∷KanMX | Wu et al., 2011 | N/A |
| S.cerevisiae strain CEN.PK: genotype: Gln3-3xFlag∷natNT | this paper | N/A |
| S.cerevisiae strain CEN.PK: genotype: Gln3-3xFlag∷natNT, pbp1Δ∷Hyg | this paper | N/A |
| S.cerevisiae strain CEN.PK: genotype: Npr1-3xFlag∷natNT | this paper | N/A |
| S.cerevisiae strain CEN.PK: genotype: Npr1-3xFlag∷natNT, pbp1Δ∷Hyg | this paper | N/A |
| S.cerevisiae strain CEN.PK: genotype: Kog1-superfolderGFP∷KanMX | this paper | N/A |
| S.cerevisiae strain CEN.PK: genotype: Kog1-superfolderGFP∷KanMX, pbp1Δ∷Hyg | this paper | N/A |
| S.cerevisiae strain CEN.PK: genotype: Pab1-mCherry∷KanMX | this paper | N/A |
| S.cerevisiae strain CEN.PK: genotype: Pub1-mCherry∷KanMX | this paper | N/A |
| S.cerevisiae strain CEN.PK: genotype: Pbp1-3xHA∷KanMX | this paper | N/A |
| S.cerevisiae strain CEN.PK: genotype: Kog1-3xHA∷KanMX, pbp1Δ∷pbp1Δa.a.50-127-3xFlag∷Hyg | this paper | N/A |
| S.cerevisiae strain CEN.PK: genotype: Kog1-3xHA∷KanMX, pbp1Δ∷pbp1Δa.a.226-298-3xFlag∷Hyg | this paper | N/A |
| S.cerevisiae strain CEN.PK: genotype: Kog1-3xHA∷KanMX, pbp1Δ∷pbp1Δa.a.50-298-3xFlag∷Hyg | this paper | N/A |
| S.cerevisiae strain CEN.PK: genotype: Kog1-3xHA∷KanMX, pbp1Δ∷pbp1Δa.a.571-722-3xFlag∷Hyg | this paper | N/A |
| S.cerevisiae strain CEN.PK: genotype: Kog1-3xHA∷KanMX, pbp1Δ∷pbp1Δa.a.2-49-3xFlag∷Hyg | this paper | N/A |
| S.cerevisiae strain CEN.PK: genotype: Kog1-3xHA∷KanMX, pbp1Δ∷pbp1Δa.a.299-570-3xFlag∷Hyg | this paper | N/A |
| S.cerevisiae strain CEN.PK: genotype: Kog1-3xHA∷KanMX, pbp1Δ∷pbp1Δa.a.299-420-3xFlag∷Hyg | this paper | N/A |
| S.cerevisiae strain CEN.PK: genotype: Kog1-3xHA∷KanMX, pbp1Δ∷pbp1Δa.a.421-490-3xFlag∷Hyg | this paper | N/A |
| S.cerevisiae strain CEN.PK: genotype: Kog1-3xHA∷KanMX, pbp1Δ∷pbp1Δa.a.491-570-3xFlag∷Hyg | this paper | N/A |
| S.cerevisiae strain CEN.PK: genotype: Kog1-3xHA∷KanMX, pbp1Δ∷pbp1Δa.a.299-337-3xFlag∷Hyg | this paper | N/A |
| S.cerevisiae strain CEN.PK: genotype: Kog1-3xHA∷KanMX, pbp1Δ∷pbp1Δa.a.338-387-3xFlag∷Hyg | this paper | N/A |
| S.cerevisiae strain CEN.PK: genotype: Kog1-3xHA∷KanMX, pbp1Δ∷pbp1Δa.a.388-442-3xFlag∷Hyg | this paper | N/A |
| S.cerevisiae strain CEN.PK: genotype: Kog1-3xHA∷KanMX, pbp1Δ∷pbp1Δa.a.443-490-3xFlag∷Hyg | this paper | N/A |
| S.cerevisiae strain CEN.PK: genotype: pbp1Δ∷pbp1Δa.a.338-387-3xFlag∷Hyg | this paper | N/A |
| S.cerevisiae strain CEN.PK: genotype: pbp1Δ∷pbp1Δa.a.388-442-3xFlag∷Hyg | this paper | N/A |
| S.cerevisiae strain CEN.PK: genotype: Idh1-GFP∷KanMX, pbp1Δ∷pbp1Δa.a.338-387-3xFlag∷Hyg | this paper | N/A |
| S.cerevisiae strain CEN.PK: genotype: Idh1-GFP∷KanMX, pbp1Δ∷pbp1Δa.a.388-442-3xFlag∷Hyg | this paper | N/A |
| S.cerevisiae strain CEN.PK: genotype: Pbp1-yoEGFP∷KanMX | Kato et al., 2019 | N/A |
| Oligonucleotides | ||
| N/A | ||
| Recombinant DNA | ||
| Plasmid: 6xHis-Pbp1aa570-722 in pET28 backbone pHis.Parallel1 background | this paper | N/A |
| Plasmid: 6xHis-GFP-Pbp1aa570-722 in pHis.Parallel1 background | this paper | N/A |
| Plasmid: 6xHis-Pbp1aa570-722 M614,616S in pHis.Parallel1 backbone | this paper | N/A |
| Plasmid: 6xHis-Pbp1aa570-722 M614,616, 618, 625S in pHis.Parallel1 backbone | this paper | N/A |
| Plasmid: 6xHis-Pbp1aa570-722 M605, 606, 614,616, 618, 625 in pHis.Parallel1 backbone | this paper | N/A |
| Plasmid: 6xHis-Pbp1aa570-722 M591, 595, 605, 606, 614,616, 618, 625S in pHis.Parallel1 backbone | this paper | N/A |
| Plasmid: 6xHis-GFP-Pbp1aa570-722 M591, 595, 605, 606, 614,616, 618, 625S in pHis.Parallel1 backbone | this paper | N/A |
| Software and Algorithms | ||
| Image J | NIH | https://imagej.nih.gov/ij/ |
| Prism | Graphpad software | https://www.graphpad.com/ |
| MATLAB | Mathworks | https://www.mathworks.com/ |
| Code for methionine content analysis | this paper | https://github.com/tulabutsw/methionine-content-analysis- |
| Code for image analysis | this paper | https://github.com/tulabutsw/image_analysis |
| Other | ||
Yeast growth media and procedures
Media used in this study
YPL (0.5% yeast extract (Bio Basic), 2% peptone (BD Biosciences) and 2% lactate (Sigma L1375)); SL (0.17% yeast nitrogen base without amino acids (BD Biosciences), 2% lactate); SD (0.17% yeast nitrogen base without amino acids, 2% glucose); SD-N (0.17% yeast nitrogen base without amino acids and ammonium sulfate (BD Biosciences), 2% glucose); SCL-Lys-Arg (0.17% yeast nitrogen base without amino acids, CSM-Lys-Arg (Sunrise science), 2% lactate).
Media switch
Cells from overnight YPL culture were inoculated into fresh YPL to 0.1 optical density (OD600)/ml and grown for a few generations in log phase. The log-phase cells were then diluted again to very low OD600, grown overnight till the OD600 reached ~1. The cells were then spun down, washed, and re-suspended to OD600 = 0.7 in SL, SD or SD-N. Samples were collected at indicated times. Growth curves for different cells grown in SL, SD, or SD-N were performed by starting cultures at OD600 ~0.15, and then measuring OD600 periodically until saturation.
METHOD DETAILS
Assays to monitor autophagy
Imaging
A dual-color reporter strain expressing mitochondrial-localized DsRed (Mito-DsRed) and GFP-tagged vacuolar membrane protein Vph1 (Vph1-GFP) was constructed to visualize mitophagy. An increase in the signal of Mito-DsRed in the vacuole indicates the induction of mitophagy. Images were taken under a 100X oil-immersion objective lens with a Deltavision DVRT microscope. Cells grown under indicated conditions were visualized after directly mounting under a coverslip. Images were deconvolved, then processed using ImageJ.
GFP cleavage assay
A mitochondrial matrix protein, Idhl, was tagged with GFP. When mitophagy is induced, this protein accumulates in the vacuole and is degraded. The more stable GFP is detected by immunoblotting with anti-GFP monoclonal antibody (Roche, clone 7.1 and 13.1) as semi-quantitative evidence for mitophagy (Kanki et al., 2009).
ALP activity assay
pho8Δ60/pho13Δ cells with or without Pbp1 were subject to ALP activity assay before and 8 h after media switch to measure the level of general autophagy. The protocol for ALP assay essentially followed previously described methods (Noda et al., 1995) with some modifications. Briefly, cell pellets were resuspended in 400 μl of lysis buffer (250 mM Tris-HCl pH 9, 25 mM MgSO4, 1% Triton, 2X EDTA-free protease inhibitor cocktail (Roche). After adding ~100 μl of glass beads (Sigma), cells were lysed by three rounds of bead beating: 1 min of beating, then 1 min of cooling on ice. Cell debris and glass beads were separated from the cell extracts by centrifugation at maximum speed for 10 min at 4°C. For each sample, 70 μl of cell extracts were added to triplicate wells in 96-well, flat bottom plates. Plates were kept on ice before the substrate was added. Lysis buffer (70 μl) was added to the blank well. 70 μl of substrate solution (250 mM Tris-HCl pH 9, 25 mM MgSO4, 1% Triton, 2.7 mM p-nitrophenyl phosphate (MP Biomedicals Life Sciences)) was then added to each well. The plate was incubated at room temperature for 5 min before the reaction was stopped with 140 μl of stop buffer (1 M glycine, pH 11). The plate was read at 400 nm to measure the production of p-nitrophenol.
TCA-precipitated whole cell extracts preparation
Cell pellets were resuspended in 250 μl 8% TCA. After adding ~100 μl glass beads, cells were lysed by five rounds of bead-beating: 30s beating/30s cooling on ice. The lysates were then centrifuged at maximum speed for 10 min at 4°C. The pellets were then washed with 100% ice-cold acetone and resuspended in 2X SDS sample buffer (400 mM Tris-HCl pH 7.5, 4% SDS, 20% glycerol), boiled for 5 min, and briefly centrifuged. The supernatant was then separated and the protein concentration was measured using BCA protein assay kit (Thermo Scientific). Bromophenol blue and 2-mercaptoethanol were added to the lysates after concentration measurement.
TORC1 substrate phosphorylation
At the indicated time points, 5 OD of cells expressing Sch9-HA, HA-Atg13, Gln3-Flag, or Npr1-Flag were quenched by mixing with TCA to a final concentration of 10% and incubated on ice for 20 min before centrifugation. Cell pellets were then subject to whole cell TCA extraction and analyzed by Western immunoblotting. Sch9-HA samples were analyzed by phos-tag SDS-PAGE (Wako chemical laboratory) immunoblot with anti-HA antibody (Cell Signaling, C29F4). HA-Atg13, Gln3-Flag, or Npr1-Flag samples were analyzed by SDS-PAGE immunoblot with anti-HA and anti-Flag (Sigma, M2) antibodies, respectively. The loading control was immunoblotted with rabbit anti-G6PD Ab2 (Sigma). For cells treated with rapamycin and cycloheximide, 200 ng/ml rapamycin (Sigma) or 25 μg/ml cycloheximide (Sigma) was added to cells grown in YPL and grown for 30 min before harvesting.
SILAC experiments to identify changes in protein abundance
Culture preparation
WT or pbp1Δ strains auxotrophic for lysine and arginine (lys1Δ/arg4Δ) were grown in YPL for several generations and then diluted to OD600 0.01 in SCL-Lys-Arg media supplemented with 50 μg/ml lysine and 50 μg/ml arginine (Lys0+Arg0 for pbp1Δ cells, Lys+8+Arg+10 for WT cells). For efficient labeling, cells were grown for ~22 h (7-8 complete generations) until OD600 ~1. 20 OD of cells at this point were collected as SCL samples and the rest of cultures were washed with SL and resuspended to OD600 = 0.7 in SL supplemented with 50 μg/ml lysine and 50 μg/ml arginine (Lys0+Arg0 for pbp1Δ cells, Lys+8+Arg+10 for WT cells). SL samples were collected after 6 h.
Protein Extraction
Cell pellets from WT cells grown in heavy SILAC media were lysed (lysis buffer: 50 mM Tris-HCl pH 8.0, 75 mM NaCl, 50 mM NaF, 50 mM B-glycerophosphate, 1 mM sodium orthovanadate, 5 mM EDTA, 8 M urea, lysis procedures as described earlier for TCA extraction), mixed in 1:1 ratio with pbp1Δ cell lysates grown in light media. Proteins in the mixed lysates were separated by SDS-PAGE and stained with Coomassie Blue. Excised gel bands were chopped into 1 mm3 cubes for in-gel digestion.
In-gel digestion
Coomassie blue stain was removed from gel pieces by incubating for 30 min at 37°C in 50 mM triethylammonium bicarbonate (TEAB)/acetonitrile (1:1, v/v). Gel pieces were then dehydrated with acetonitrile at room temperature, followed by reduction/alkylation using DTT and iodoacetamide. Gel pieces were dehydrated by ACN and rehydrated by a 10 μg/mL solution of trypsin in 0.05% HOAc. The digestion was carried out at 37°C overnight. Peptides were extracted at 37°C for 15 min using the extraction buffer (50% acetonitrile and 3.3% TFA). All the steps above were carried out on a thermomixer shaker (Eppendorf) unless stated otherwise. Extracts were then dried using a speed vacuum concentrator and re-suspended in 2% ACN, 0.1% TFA. Salts were removed using Oasis HLB μElution plate (Waters) before LC-MS/MS analysis.
LC-MS/MS detection of peptides
Reverse phase chromatography was performed on an Ultimate 3000 nano HPLC system (Dionex), equipped with a 75 μm i.d. x 50 cm EasySpray column (Thermo). Separation of peptides was carried out at 250 nl/min by a 60min linear gradient of 1%-28% buffer B. Buffer A contained 2% (v/v) ACN and 0.1% formic acid in water, and buffer B contained 80% (v/v) ACN, 10% (v/v) trifluoroethanol, and 0.1% formic acid in water.
Mass spectrometric analyses were performed on an Orbitrap Elite Instrument (Thermo Electron). The mass spectrometer operated in positive ion mode with a source voltage of 2.4 kV and a capillary temperature of 255°C. MS scans were acquired at 240,000 resolution in the Orbitrap and up to 14 MS/MS spectra were obtained for each full spectrum acquired using collisionally-induced dissociation (CID) for ions with charges 2 or higher. The charge exclusion was applied to exclude the unassigned and charge 1 species, and dynamic exclusion was used with a duration of 15 sec.
SILAC data analysis
RAW data files were analyzed using MaxQuant (version 1.5.0.30) (Cox and Mann, 2008). Peptide and protein identification were performed against the UniProtKB yeast whole proteome sequence database. Default parameters were used for the MaxQuant analysis, with the exception that Ile-leu equivalence was disabled to ensure reported peptide and protein sequences were identical to those in the original sequence database. Precursor mass tolerances were automatically determined by MaxQuant during processing, while MS/MS mass tolerance was 20 ppm. Peptide and protein identifications were filtered to a 1% false discovery rate (FDR). Quantitation of a protein required the presence of at least two quantified peptide features for that protein.
GO term analysis
Proteins with expression level highly increased in pbp1Δ cells in SL (0.5< (pbp1Δ /WT)SCL < 1.5, (pbp1Δ /WT)SL > 2) were analyzed for GO enrichments for biological processes using the GO term finder interface on the Saccharomyces Genome Database, including a p value cutoff for significant shared GO terms of 0.01 (Ashburner et al., 2000; Boyle et al., 2004).
Immunoprecipitation
At the indicated time points, 50 OD of cells were harvested, flash frozen with liquid nitrogen, and stored at −80°C until cell lysis. The cell pellet was resuspended with 350 μl of lysis buffer A (50 mM HEPES pH 7.5, 150 mM NaCl, 10 mM MgCl2, 0.5% NP-40, 2X protease inhibitor cocktail, 1 mM PMSF, 1mM sodium orthovanadate, 5 mM NaF, 10 nM leupeptin, 5 nM pepstatin A). After adding ~300 μl of glass beads, cells were lysed by bead beating 6 times: 30s of beating / 2 min of cooling on ice. The lysed cells were then separated from glass beads by centrifugation at 6000 rpm for 2 min at 4°C, and diluted with 525 μL of lysis buffer B devoid of NP-40 (50 mM HEPES pH 7.5, 150 mM NaCl, 10 mM MgCl2, 2X protease inhibitor cocktail, 1 mM PMSF, 1 mM sodium orthovanadate, 5 mM NaF, 10 nM leupeptin, 5 nM pepstatin A). The crude cell extracts were then clarified by two successive centrifugations at maximum speed for 10 min at 4°C (Panchaud et al., 2013).
The protein concentration of the cleared lysates was then measured using Bradford assay (Bio-Rad), and adjusted to be equal among all samples in 800 μl reaction volume. For input samples, 8 μl of the reactions were taken and mixed with SDS sample dye, and denatured for 5 min at 95°C. For each co-immunoprecipitation reaction, 25 μl of dynabeads protein G (Life technologies) were washed with the IP lysis buffer and incubated with 3 μg of anti-Flag antibody (Sigma, M2) for 1 h at 4°C. The unbound antibodies were then removed by centrifugation at 500 g for 1 min at 4°, and the conjugated dynabeads-antibody were then added to the cleared lysates. If indicated, ribonuclease A (Sigma) was added to the lysates. After incubating for 2h at 4°C, the dynabeads were washed 3 times with wash buffer (50 mM HEPES pH 7.5, 150 mM NaCl, 10 mM MgCl2, 2X protease inhibitor cocktail, 0.2% NP-40), resuspended in 2X SDS sample dye, and denatured for 5 min at 95°C.
Fractionation to assess intracellular assembly formation
At the indicated time points, 20 OD of cells were harvested, flash frozen with liquid nitrogen, and stored at −80°C until cell lysis. The cell pellet was resuspended with 250 μl of lysis buffer (150 mM HEPES pH 7.5, 150 mM NaCl, 1 mM EDTA, 0.2% NP-40, 2X protease inhibitor cocktail, 1 mM PMSF, 1 mM DTT). After adding ~100 μl of glass beads, cells were lysed by bead beating 4 times: 30s of beating / 30s of cooling on ice. Cell lysates were clarified by centrifugation at 650 g for 2 min at 4°C. For total protein sample, 100 μl of lysates were taken, mixed with SDS sample dye and boiled for 5 min at 95°C. For soluble and pellet samples, 100 μl of lysates were centrifuged at 100,000 g for 1h at 4°C. The supernatant was transferred to another tube and the pellet was resuspended with 100 μl of 0.2% NP-40 lysis buffer. SDS sample dye was then added to both soluble and pellet samples and boiled for 5 min at 95°C.
Protein expression and purification
All Pbp1 fragments were amplified using PCR from yeast cDNA library and cloned into the multiple cloning sites of the pHis-parallel1 vector (Sheffield et al., 1999). Methionine to serine mutations in the Pbp1 C-terminal LC region were introduced by quickchange site-directed mutagenesis technique and confirmed by sequencing. All proteins were overexpressed in E. coli BL21(DE3) cells with 0.5 mM IPTG at 20°C overnight. Harvested cells were lysed with 0.2 mg/ml lysozyme in a lysis buffer containing 50 mM Tris-HCl pH 7.5, 500 mM NaCl, 20 mM 2-mercaptoethanol, 1% Triton X-100, 2 M guanidine hydrochloride and a protein inhibitor tablet (Sigma) for 30 min on ice, and then sonicated for 2 min (10s on / 30s off). The cell lysate was centrifuged at 35,000 rpm for 1 h. The supernatant was mixed with Ni-NTA resin (QIAGEN) for 30 min at 4°C. The Ni-NTA resin was packed in a glass column and washed with a washing buffer containing 20 mM Tris-HCl pH 7.5, 500 mM NaCl, 20 mM imidazole, 20 mM 2-mercaptoethanol, 0.1 mM PMSF and 2 M guanidine hydrochloride. The bound proteins were eluted from the resin with a elution buffer containing 20 mM Tris-HCl (pH 7.5), 500 mM NaCl, 200 mM imidazole, 20 mM 2-mercaptoethanol, 0.1 mM PMSF and 2 M guanidine hydrochloride. EDTA was added to a final concentration of 0.5 mM to the eluted protein solutions. The purified proteins were concentrated with Amicon Ultra centrifugal filters (Millipore) to the final concentration of 100-120 mg/ml. The protein solutions were stored at −80°C. The purities of the purified proteins were confirmed by SDS-PAGE, and the concentrations were determined by absorbance at UV280.
Phase-separated droplet formation
Phase-separated droplets of His6-Pbp1_LC were formed by a quick dilution of the purified protein (90 mg/ml in 6M guanidine HCl) into a gelation buffer containing 20 mM Tris-HCl (pH 7.5), 200 mM NaCl, 20 mM 2-mercaptoethanol, 0.1 mM PMSF and 0.5 mM EDTA to reach the final protein concentration of 1-2 mg/ml. The phase-separated droplet solution was incubated for 30 min to 24 h at room temperature. Images of the droplets were taken using Bio-Rad ZOE Fluorescent Cell Imager with a white light mode.
Transmission electron microscopy
To inspect fibril formation, the purified GFP-Pbp1_LC (200-300 μM) were dialyzed in a gelation buffer for overnight. The dialyzed protein solution was deposited on a surface of a TEM grid (CF-400-Cu from Electron Microscopy Sciences, USA). The surface of the grid was washed three times with 10 μl of distilled water. The grid was subsequently stained for 10 seconds with a 5 μl drop of 2% uranyl acetate. After the uranylacetate solution was blotted, the grid was dried in air. TEM images were obtained with a JEOL 1200EX electron microscope at 120 kV.
X-Ray diffraction
For fibril X-ray diffraction, His6-Pbp1_LC was diluted in a gelation buffer at 2 mg/ml. The mixture was incubated for 3 days at 4C°. Polymer pellets were collected by centrifuge at 4000 x g for 30 min. The pellets were resuspended in 0.2 ml milli-Q water and dialyzed in 1 L milli-Q water for 12 h twice. The dialyzed samples were lyophilized for overnight and then exposed to an X-ray beam to obtain cross-β diffraction as described previously (Kato et al., 2012).
Dissolution of phase-separated droplets
Dissolution of phase-separated droplets or fibrils of Pbp1_LC by aliphatic alcohols was monitored by turbidity measurements (absorbance at 395 nm wavelength) with Beckman DU800 spectrophotometer. His6-Pbp1_LC were diluted in the gelation buffer to obtain a final protein concentration of 2 mg/ml (~100 μM). The phase-separated droplet solution (0.5 ml) was dispensed in plastic cuvettes. 1.6-HD or 2,5-HD (50% w/v in gelation buffer) was added to the cuvettes to obtain the indicated concentrations and then incubated at room temperature. The OD395 was measured with Beckman DU800 spectrophotometer after 2 min incubation. Plots were calculated from 3 independent experiments.
Semi-denaturing detergent agarose gel electrophoresis (SDD-AGE)
The stability of cross-β polymers were tested by semi-denaturing detergent agarose gel electrophoresis (SDD-AGE) as described previously (Kato et al., 2012). Briefly, the polymers made from His6-tag Pbp1_LC and the amyloid polymers of yeast Sup35NM protein were diluted in a gelation buffer at 0.2 mg/ml and 0.1 mg/ml, respectively, then sonicated briefly to make the polymers short. The short polymers were incubated in the gelation buffer containing indicated concentrations of SDS (0 - 2%) at 37°C for 10 min. The reaction mixtures were loaded onto 1.5% agarose gel to separate polymers and monomers. Proteins were transferred onto a cellulose membrane and analyzed by western blotting with a His-tag antibody.
Dissolution of phase-separated droplets by dilution
Phase-separated droplets of the WT or the indicated mutants of His6-Pbp1_LC were formed as described above (2 mg/ml protein concentration). After 30 min incubation at room temperature, the phase-separated droplet solution was dispensed into a 96-well plate and mixed with different volumes of the droplet formation buffer to dilute the protein to the indicated protein concentrations (0 – 2 mg/ml in a total of 100 μl). The plate was incubated at room temperature for 5 min and turbidity of the phase-separated droplet solution was measured at 600 nm using a BIOTEK Cytation5 plate reader. All the samples were measured in triplicate.
Fluorescence recovery after photobleaching (FRAP) and quantification
To make fluorescentally-labeled phase-separated droplets, GFP-Pbp1_LC was first diluted in a gelation buffer at a final concentration of 1 μM. Immediately, His6-Pbp1_LC was diluted into this solution at a final concentration of 2 mg/ml (~100 μM). The phase-separated droplet solution was dispensed in a glass-bottomed microscope dish and incubated at room temperature for 30 min. GFP labeled phase-separated droplets were visualized by confocal microscope (Zeiss LSM880 Airyscan). Time lapse images were recorded with a 5s interval for a total of 63 images. Photobleaching of GFP signals in selected droplets was carried out after the 3rd image was recorded. GFP intensities of photobleached areas were measured for all the images using ImageJ. The intensities from individual images were normalized against those from the initial image. Plots were generated and curve-fitted using Prism 7 program.
In vivo FRAP experiments were carried out on an Andor Revolution spinning disk confocal microscope with a Nikon 100x oil objective. The 488 nm laser line was used to photobleach a small region of a yeast cell containing one or more discrete GFP puncta. Time lapse images were acquired at 100 nm intervals for three frames before and 1 to 10 sec after the bleach using an Ixon Ultra EMCCD (Andor). The Pbp1-yoEGFP strain was described in (Kato et al., 2019).
Petite formation
Cells were grown in YPL and then switched to SL as described in EXPERIMENTAL MODEL AND SUBJECT DETAILS. Cell growth in SL was constantly measured to monitor entry into stationary phase. After reaching stationary phase, ~350 cells were plated onto YPD plate at indicated time points, and grown at 30°C for 50 h.
Time-lapse microscopy
For time-lapse microscopy, a microfluidics device (Huberts et al., 2013; Lee et al., 2012) in combination with an inverted fluorescence microscope (Eclipse Ti-E; Nikon instruments, Amsterdam, The Netherlands), an iXon Ultra 897 camera (Andor Technology Ltd, Belfast, United Kingdom), and an LED-based excitation system (AURA light engine; Lumencor, Oregon, USA) were used. For every experiment, exponentially growing cells in SL medium were loaded onto the microfluidics device and were thereafter continuously supplemented with fresh SL medium. Temperature was retained constant at 30° throughout the experiment using a microscope incubator (Life Imaging Services GmbH, 448 Basel, Switzerland). Automated hardware (PFS; Nikon instruments) was used for correction of axial focus fluctuations during time-lapse imaging.
GFP images were taken every 60 min for ≈ 115 h with excitation at 485 nm (3 % LED intensity / 100 msec exposure) using a 470/40 nm bandpass filter, a 495 nm beam-splitter a 525/50 nm emission filter, and a CFI Plan Apochromat Lambda 60X objective (Nikon instruments). Bright field images were recorded every 10 minutes.
Image processing
The cell cytoplasm was determined through global intensity thresholding using Otsu’s method (Otsu, 1979). Briefly, OTSU’s method divides the pixel intensities into two classes by finding an optimum threshold that minimizes the within-class variance or, equivalently, maximizes the between-class variance (Otsu, 1979). Using this optimum threshold the images were divided into foreground, i.e. cell cytoplasm, and background. Next, connected components smaller than 25 pixels were removed and small holes in the foreground, if any, were filled using morphological closure with a 5-by-5 square-structuring element. Next, we calculated the mean and the standard deviation of the pixel intensities on the foreground. The image analysis was implemented in MATLAB 2018a. Specifically, Otsu’s method was implemented using imbinarize function and morphological closing was implemented using imclose function. The code and two example images are available at https://github.com/tulabutsw/image_analysis
Cell division period and replicative life span assays
For cell segmentation and fluorescence measurements, the semi-automated ImageJ plugin BudJ was used (Ferrezuelo et al., 2012). Fluorescent measurements were corrected for background fluorescence using the modal fluorescence value provided by BudJ for GFP. The number of buds produced by individual cells and the timing of the onset of budding and cell death were recorded manually by visual inspection of the 60X bright field images, and data were analyzed as described previously (Filer et al., 2017; Huberts et al., 2014) to estimate the RLS. Division periods were determined by estimating the time between two subsequent budding events. G1 duration of daughter cells was determined as the time between cytokinesis (indicated by the darkening of the bud neck in bright field images (Zopf et al., 2013) and the subsequent displacement of the daughter cell away from the mother cell) and bud appearance. The duration of replicative senescence was estimated by calculating the time between last budding event and cell death as indicated by the shrinkage of the cell body. Plotting and statistical analysis were performed using GraphPad Prism and Python.
Identification and quantification of cells with abnormal morphology
For characterization of terminal morphology, bright-filed images of cells that were tracked until cell-death were analyzed (n= 32 for pbp1Δ and n=43 for WT). Abnormal cellular morphology was identified by the presence of multiple interconnected and/or overly elongated buds attached to the cell body at the moment of cell death.
Proteome-wide analysis of methionine content
To estimate the significance of the enrichment of methionine in the C-terminal low complexity region (150 a.a.) of Pbp1, we counted the number of methionines in all possible windows of 150 amino acids of all protein sequences in the genome of S. cerevisiae. A total of 5917 protein sequences obtained from the Saccharomyces Genome Database were analyzed: (https://downloads.yeastgenome.org/sequence/S288C_reference/orf_protein/orf_trans.fasta.gz, 13-Jan-2015 12:21). Each protein sequence was analyzed using a sliding window of a length of 150 amino acids. Therefore, a given protein sequence of X amino acids will give (X–150+1) windows. Proteins that are shorter than 150 amino acids were treated as one window. The number of methionines in each window was counted, which serves as the null distribution of methionine enrichment. The significance (p-value) of the observed methionine enrichment of in the C-terminal low complexity region of Pbp1 was evaluated by the percentage of windows in the null distribution that contains more methionine than the observed one in the C-terminal low complexity region of Pbp1. All analysis was done using an in-house Matlab script available at: https://github.com/tulabutsw/methionine-content-analysis-
QUANTIFICATION AND STATISTICAL ANALYSIS
Low complexity sequence analysis
LC sequences were identified using the SEG program with default parameter settings available at http://mendel.imp.ac.at/METHODS/seg.server.html (Wootton, 1994).
DATA AND SOFTWARE AVAILABILITY
Methionine content analysis
Matlab script available at: https://github.com/tulabutsw/methionine-content-analysis-
Image processing analysis
The code and two example images are available at: https://github.com/tulabutsw/image_analysis
Supplementary Material
Movie S1. Live cell imaging of cells expressing Pbp1-yoEGFP. Related to Figure 3.
Figure S1. Pbp1 is a negative regulator of TORC1 that functions during respiratory growth. Related to Figure 1.
(A) Images of WT and pbp1Δ cells after switching from YPL to SD–N medium for 8 h. pbp1Δ mutant cells were able to induce mitophagy following switch to SD-N medium. Scale bar = 1 μm.
(B) GFP cleavage assay showing pbp1Δ cells are able to induce mitophagy following switch to SD-N.
(C) Growth of WT and pbp1Δ cells in SD and SD–N medium. pbp1Δ cells exhibited comparable cell growth to WT in the presence of glucose. Data were mean ± s.d. from 3 independent experiments.
(D) SILAC quantitative proteomic approach for assessing global changes in protein levels in pbp1Δ versus WT cells. The ratio of the expression amounts of all 608 proteins detected in pbp1Δ versus WT cells were plotted. Proteins present at increased amounts in pbp1Δ in SL ((pbp1Δ / WT)SL > 1.5), but not in SCL (0.5 < (pbp1Δ / WT)SCL < 1.5) are highlighted in red, and listed in Table S1.
(E) Gene ontology analysis for proteins that exhibit increased abundance in pbp1Δ cells in SL medium (proteins highlighted in red in (D)).
(F) Correlation plot comparing the amounts of ribosomal proteins in pbp1Δ versus WT cells in SCL (X-axis) and SL (Y-axis). Ribosomal proteins were increased in abundance in pbp1Δ cells in SL medium. Protein identities are listed in Table S2.
Figure S2. Regions of the Pbp1 protein required for interaction and inhibition of TORC1. Related to Figure 2.
(A) Images of Kog1-superfolderGFP expressed at endogenous levels in WT and pbp1Δ cells in SL medium. Vph1: vacuolar membrane protein. Scale bar = 1 μm.
(B) RNase A treatment did not affect the interaction between Kog1 and Pbp1. 200 μg/ml RNase A was added to cell lysates before immunoprecipitation of Pbp1.
(C) GFP cleavage assay showing autophagy in cells expressing Pbp1 mutants lacking the putative RNA-binding domains alone or in combination. Deletion of these domains did not affect autophagy.
(D) Growth curves of cells expressing the indicated variants of Pbp1. Data were mean ± s.d. from 3 independent experiments.
(E) Immunoprecipitation assessing the interaction between Kog1 and various Pbp1 deletion mutants shown in Figure 2C. Cell culture and immunoprecipitation were performed as described in Figure 2A. Note that the Pbp1 mutants lacking a.a.338-442 (mutant 6, 8, 9, 12, 13) showed reduced interaction with Kog1. *non-specific signal
Figure S3. Pbp1 and other stress granule-associated proteins do not form foci-like granules when expressed at endogenous levels during respiratory growth. Related to Figure 3.
(A) Images of Pab1-mCherry or Pub1-mCherry expressed at endogenous levels in WT cells. (Top) 6 h after switching from YPL to SL medium. (Bottom) 25 min after switching from SCD to SC medium (glucose deprivation). Scale bar = 1 μm.
(B) Images of Pbp1-yoEGFP (yeast optimized EGFP) in cells growing 3 h in SL medium and then treated with indicated concentrations of 1,6-hexanediol (1,6-HD) for 10 min. Scale bar = 1 μm.
(C) Images of Pbp1-GFP in cells growing in SL medium with DMSO or 25 μg/ml cycloheximide (CHX). Images were taken 1 h after switch. Note that CHX treatment did not change the distribution pattern of Pbp1. Scale bar = 1 μm.
Figure S4. Low complexity regions within the Pbp1 protein and sensitivity of Pbp1_LC fibrils to hexanediols. Related to Figure 4.
(A) Low complexity sequences analysis identified using the SEG program. (Left column) low complexity region. (Right column) non-low complexity region.
(B) Dissolution of the Pbp1_LC fibrils by the 1,6- or 2,5-hexanediols (HD). Note that the fibrils were more sensitive to 1,6-HD. Data were mean ± s.d. from 3 independent experiments.
Figure S5. Localization of Pbp1 in relation to organelle markers. Related to Figure 5.
Images of cells expressing Pbp1-GFP with either Vphl-mCherry (vacuole), Sec63-mCherry (endoplasm reticulum), or Mito-DsRed (mitochondria) in SL medium. Note that the localization of Pbp1 is completely exclusive of mitochondria, suggesting it may form a condensate surrounding mitochondria. Scale bar = 1 μm.
Figure S6. Properties of fibrils or phase-separated droplets formed by the indicated M -> S mutants within the LC region of Pbp1. Related to Figure 6.
(A) Electron micrographs of purified GFP-Pbp1_LC bearing indicated M to S mutations. All 3 Pbp1_LC variants showed reduced ability to form fibrils. M11,12S showed the weakest ability. Scale bar = 500 nm.
(B) Phase-separated droplet formation by purified His6-Pbp1_LC containing indicated methionine to serine mutations. Images were taken 30 min and 24 h after lowering the salt concentration. Scale bar = 10 μm.
(C) Dissolution of phase-separated droplets formed from the indicated proteins by dilution. Turbidity was measured by light scattering at 600 nm. Phase-separated droplets formed by the variant bearing 8 methionine mutations dissolved more readily following dilution of the protein concentration. Data were mean ± s.d. from 3 independent experiments.
Figure S7. Microfluidic imaging and analysis of cell division for WT and pbp1Δ cells in glucose medium. Related to Figure 7.
(A) pbp1Δ cells exhibited comparable division times compared to WT in the presence of glucose. The division period was plotted against replicative life span (RLS) for WT and pbp1Δ cells. Each box plot contains data from n=5-77 and n=5-69 for WT and pbp1Δ cells, respectively. In total, data from 468 (WT) and 382 (pbp1Δ) division events were recorded.
(B) Bright field images of representative WT and pbp1Δ cells with abnormal morphology at terminal stage.
Movie S2. FRAP analysis of phase-separated droplets formed by purified His6-Pbp1_LC and GFP-Pbp1_LC. Related to Figure 6.
Movie S3. FRAP analysis of phase-separated droplets formed by purified His6-Pbp1_LC M7-14S and GFP-Pbp1_LC M7-14S. Related to Figure 6.
Table S1. List of proteins detected in SILAC experiment in pbp1Δ versus WT cells. Related to Figure 1.
Proteins present at increased amounts in pbp1Δ in SL ((pbp1Δ / WT)SL > 1.5), but not in SCL (0.5 < (pbp1Δ / WT)SCL < 1.5) are highlighted in red.
Table S2. List of ribosomal proteins detected in SILAC experiment in pbp1Δ versus WT cells. Related to Figure S1.
Highlights.
Pbp1 is a negative regulator of TORC1 required during respiratory growth
A methionine-rich low complexity region of Pbp1 mediates formation of a condensate
Mutations that weaken phase separation in vitro compromise TORC1 inhibition in vivo
Loss of Pbp1 function leads to mitochondrial dysfunction and reduced survivability
ACKNOWLEDGMENTS
B.P.T. is supported by grants from the NIH (R01GM094314), the Welch Foundation (I-1797), the David and Lucile Packard Foundation, and a HHMI-Simons Faculty Scholars Award. M.K. is funded by the support of an anonymous donor to the laboratory of S.L.M. N.E.W. is supported by Cancer Prevention and Research Institute of Texas (RR150058) and Welch Foundation (I-1919), which are obtained by Andreas Doncic. We thank K. Luby-Phelps and the UTSW Live Cell Imaging Core Facility for assistance with microscopy experiments.
Footnotes
Publisher's Disclaimer: This is a PDF file of an unedited manuscript that has been accepted for publication. As a service to our customers we are providing this early version of the manuscript. The manuscript will undergo copyediting, typesetting, and review of the resulting proof before it is published in its final citable form. Please note that during the production process errors may be discovered which could affect the content, and all legal disclaimers that apply to the journal pertain.
DECLARATION OF INTERESTS
The authors declare no competing interests.
SUPPLEMENTAL INFORMATION
Supplemental Information contains 7 figures, 2 tables, and 3 movies.
REFERENCES
- Alves-Cruzeiro JM, Mendonca L, Pereira de Almeida L, and Nobrega C (2016). Motor Dysfunctions and Neuropathology in Mouse Models of Spinocerebellar Ataxia Type 2: A Comprehensive Review. Front Neurosci 10, 572. [DOI] [PMC free article] [PubMed] [Google Scholar]
- Ashburner M, Ball CA, Blake JA, Botstein D, Butler H, Cherry JM, Davis AP, Dolinski K, Dwight SS, Eppig JT, et al. (2000). Gene ontology: tool for the unification of biology. The Gene Ontology Consortium. Nat Genet 25, 25–29. [DOI] [PMC free article] [PubMed] [Google Scholar]
- Astbury WT, Dickinson S, and Bailey K (1935). The X-ray interpretation of denaturation and the structure of the seed globulins. Biochem J 29, 2351–2360 2351. [DOI] [PMC free article] [PubMed] [Google Scholar]
- Bakthavachalu B, Huelsmeier J, Sudhakaran IP, Hillebrand J, Singh A, Petrauskas A, Thiagarajan D, Sankaranarayanan M, Mizoue L, Anderson EN, et al. (2018). RNP-Granule Assembly via Ataxin-2 Disordered Domains Is Required for Long-Term Memory and Neurodegeneration. Neuron 98, 754–766 e754. [DOI] [PubMed] [Google Scholar]
- Banani SF, Lee HO, Hyman AA, and Rosen MK (2017). Biomolecular condensates: organizers of cellular biochemistry. Nat Rev Mol Cell Biol 18, 285–298. [DOI] [PMC free article] [PubMed] [Google Scholar]
- Bar DZ, Charar C, Dorfman J, Yadid T, Tafforeau L, Lafontaine DL, and Gruenbaum Y (2016). Cell size and fat content of dietary-restricted Caenorhabditis elegans are regulated by ATX-2, an mTOR repressor. Proc Natl Acad Sci U S A 113, E4620–4629. [DOI] [PMC free article] [PubMed] [Google Scholar]
- Bar-Peled L, Chantranupong L, Cherniack AD, Chen WW, Ottina KA, Grabiner BC, Spear ED, Carter SL, Meyerson M, and Sabatini DM (2013). A Tumor suppressor complex with GAP activity for the Rag GTPases that signal amino acid sufficiency to mTORC1. Science 340, 1100–1106. [DOI] [PMC free article] [PubMed] [Google Scholar]
- Boland B, Kumar A, Lee S, Platt FM, Wegiel J, Yu WH, and Nixon RA (2008). Autophagy induction and autophagosome clearance in neurons: relationship to autophagic pathology in Alzheimer’s disease. J Neurosci 28, 6926–6937. [DOI] [PMC free article] [PubMed] [Google Scholar]
- Boyle EI, Weng S, Gollub J, Jin H, Botstein D, Cherry JM, and Sherlock G (2004). GO∷TermFinder--open source software for accessing Gene Ontology information and finding significantly enriched Gene Ontology terms associated with a list of genes. Bioinformatics 20, 3710–3715. [DOI] [PMC free article] [PubMed] [Google Scholar]
- Buchan JR, Muhlrad D, and Parker R (2008). P bodies promote stress granule assembly in Saccharomyces cerevisiae. The Journal of cell biology 183, 441–455. [DOI] [PMC free article] [PubMed] [Google Scholar]
- Carmo-Silva S, Nobrega C, Pereira de Almeida L, and Cavadas C (2017). Unraveling the Role of Ataxin-2 in Metabolism. Trends Endocrinol Metab 28, 309–318. [DOI] [PubMed] [Google Scholar]
- Chen J, Sutter BM, Shi L, and Tu BP (2017). GATOR1 regulates nitrogenic cataplerotic reactions of the mitochondrial TCA cycle. Nat Chem Biol 13, 1179–1186. [DOI] [PMC free article] [PubMed] [Google Scholar]
- Drost J, Nonis D, Eich F, Leske O, Damrath E, Brunt ER, Lastres-Becker I, Heumann R, Nowock J, and Auburger G (2013). Ataxin-2 modulates the levels of Grb2 and SRC but not ras signaling. J Mol Neurosci 51, 68–81. [DOI] [PMC free article] [PubMed] [Google Scholar]
- Elden AC, Kim HJ, Hart MP, Chen-Plotkin AS, Johnson BS, Fang X, Armakola M, Geser F, Greene R, Lu MM, et al. (2010). Ataxin-2 intermediate-length polyglutamine expansions are associated with increased risk for ALS. Nature 466, 1069–1075. [DOI] [PMC free article] [PubMed] [Google Scholar]
- Ferrezuelo F, Colomina N, Palmisano A, Gari E, Gallego C, Csikasz-Nagy A, and Aldea M (2012). The critical size is set at a single-cell level by growth rate to attain homeostasis and adaptation. Nat Commun 3, 1012. [DOI] [PubMed] [Google Scholar]
- Filer D, Thompson MA, Takhaveev V, Dobson AJ, Kotronaki I, Green JWM, Heinemann M, Tullet JMA, and Alic N (2017). RNA polymerase III limits longevity downstream of TORC1. Nature. [DOI] [PMC free article] [PubMed] [Google Scholar]
- Fittschen M, Lastres-Becker I, Halbach MV, Damrath E, Gispert S, Azizov M, Walter M, Muller S, and Auburger G (2015). Genetic ablation of ataxin-2 increases several global translation factors in their transcript abundance but decreases translation rate. Neurogenetics 16, 181–192. [DOI] [PMC free article] [PubMed] [Google Scholar]
- Geddes AJ, Parker KD, Atkins ED, and Beighton E (1968). “Cross-beta” conformation in proteins. J Mol Biol 32, 343–358. [DOI] [PubMed] [Google Scholar]
- Han TW, Kato M, Xie S, Wu LC, Mirzaei H, Pei J, Chen M, Xie Y, Allen J, Xiao G, et al. (2012). Cell-free formation of RNA granules: bound RNAs identify features and components of cellular assemblies. Cell 149, 768–779. [DOI] [PubMed] [Google Scholar]
- Huberts DH, Gonzalez J, Lee SS, Litsios A, Hubmann G, Wit EC, and Heinemann M (2014). Calorie restriction does not elicit a robust extension of replicative lifespan in Saccharomyces cerevisiae. Proc Natl Acad Sci U S A 111, 11727–11731. [DOI] [PMC free article] [PubMed] [Google Scholar]
- Huberts DH, Sik Lee S, Gonzales J, Janssens GE, Vizcarra IA, and Heinemann M (2013). Construction and use of a microfluidic dissection platform for long-term imaging of cellular processes in budding yeast. Nat Protoc 8, 1019–1027. [DOI] [PubMed] [Google Scholar]
- Janssens GE, Meinema AC, Gonzalez J, Wolters JC, Schmidt A, Guryev V, Bischoff R, Wit EC, Veenhoff LM, and Heinemann M (2015). Protein biogenesis machinery is a driver of replicative aging in yeast. Elife 4, e08527. [DOI] [PMC free article] [PubMed] [Google Scholar]
- Kanki T, Kang D, and Klionsky DJ (2009). Monitoring mitophagy in yeast: the Om45-GFP processing assay. Autophagy 5, 1186–1189. [DOI] [PMC free article] [PubMed] [Google Scholar]
- Kato M, Han TW, Xie S, Shi K, Du X, Wu LC, Mirzaei H, Goldsmith EJ, Longgood J, Pei J, et al. (2012). Cell-free formation of RNA granules: low complexity sequence domains form dynamic fibers within hydrogels. Cell 149, 753–767. [DOI] [PMC free article] [PubMed] [Google Scholar]
- Kato M, Yang Y-S, Sutter BM, Wang Y, McKnight SL, and Tu BP (2019). Redox State Controls Phase Separation of the Yeast Ataxin-2 Protein via Reversible Oxidation of its Methionine-Rich Low Complexity Domain. [DOI] [PMC free article] [PubMed]
- Kroschwald S, Maharana S, Mateju D, Malinovska L, Nuske E, Poser I, Richter D, and Alberti S (2015). Promiscuous interactions and protein disaggregases determine the material state of stress-inducible RNP granules. Elife 4, e06807. [DOI] [PMC free article] [PubMed] [Google Scholar]
- Lastres-Becker I, Rub U, and Auburger G (2008). Spinocerebellar ataxia 2 (SCA2). Cerebellum 7, 115–124. [DOI] [PubMed] [Google Scholar]
- Laxman S, Sutter BM, Shi L, and Tu BP (2014). Npr2 inhibits TORC1 to prevent inappropriate utilization of glutamine for biosynthesis of nitrogen-containing metabolites. Sci Signal 7, ra120. [DOI] [PMC free article] [PubMed] [Google Scholar]
- Laxman S, Sutter BM, Wu X, Kumar S, Guo X, Trudgian DC, Mirzaei H, and Tu BP (2013). Sulfur amino acids regulate translational capacity and metabolic homeostasis through modulation of tRNA thiolation. Cell 154, 416–429. [DOI] [PMC free article] [PubMed] [Google Scholar]
- Lee SS, Avalos Vizcarra I, Huberts DH, Lee LP, and Heinemann M (2012). Whole lifespan microscopic observation of budding yeast aging through a microfluidic dissection platform. Proc Natl Acad Sci U S A 109, 4916–4920. [DOI] [PMC free article] [PubMed] [Google Scholar]
- Levine B, and Klionsky DJ (2004). Development by self-digestion: molecular mechanisms and biological functions of autophagy. Dev Cell 6, 463–477. [DOI] [PubMed] [Google Scholar]
- Lin Y, Mori E, Kato M, Xiang S, Wu L, Kwon I, and McKnight SL (2016). Toxic PR Poly-Dipeptides Encoded by the C9orf72 Repeat Expansion Target LC Domain Polymers. Cell 167, 789–802 e712. [DOI] [PMC free article] [PubMed] [Google Scholar]
- Longtine MS, McKenzie A 3rd, Demarini DJ, Shah NG, Wach A, Brachat A, Philippsen P, and Pringle JR (1998). Additional modules for versatile and economical PCR-based gene deletion and modification in Saccharomyces cerevisiae. Yeast 14, 953–961. [DOI] [PubMed] [Google Scholar]
- Mangus DA, Amrani N, and Jacobson A (1998). Pbp1p, a factor interacting with Saccharomyces cerevisiae poly(A)-binding protein, regulates polyadenylation. Mol Cell Biol 18, 7383–7396. [DOI] [PMC free article] [PubMed] [Google Scholar]
- Molliex A, Temirov J, Lee J, Coughlin M, Kanagaraj AP, Kim HJ, Mittag T, and Taylor JP (2015). Phase separation by low complexity domains promotes stress granule assembly and drives pathological fibrillization. Cell 163, 123–133. [DOI] [PMC free article] [PubMed] [Google Scholar]
- Nixon RA (2013). The role of autophagy in neurodegenerative disease. Nat Med 19, 983–997. [DOI] [PubMed] [Google Scholar]
- Noda T, Matsuura A, Wada Y, and Ohsumi Y (1995). Novel system for monitoring autophagy in the yeast Saccharomyces cerevisiae. Biochem Biophys Res Commun 210, 126–132. [DOI] [PubMed] [Google Scholar]
- Nonhoff U, Ralser M, Welzel F, Piccini I, Balzereit D, Yaspo ML, Lehrach H, and Krobitsch S (2007). Ataxin-2 interacts with the DEAD/H-box RNA helicase DDX6 and interferes with P-bodies and stress granules. Mol Biol Cell 18, 1385–1396. [DOI] [PMC free article] [PubMed] [Google Scholar]
- Otsu N (1979). A threshold selection method from gray-level histograms. IEEE transactions on systems, man, and cybernetics 9, 62–66. [Google Scholar]
- Panchaud N, Peli-Gulli MP, and De Virgilio C (2013). Amino acid deprivation inhibits TORC1 through a GTPase-activating protein complex for the Rag family GTPase Gtr1. Sci Signal 6, ra42. [DOI] [PubMed] [Google Scholar]
- Prouteau M, Desfosses A, Sieben C, Bourgoint C, Lydia Mozaffari N, Demurtas D, Mitra AK, Guichard P, Manley S, and Loewith R (2017). TORC1 organized in inhibited domains (TOROIDs) regulate TORC1 activity. Nature 550, 265–269. [DOI] [PMC free article] [PubMed] [Google Scholar]
- Ralser M, Albrecht M, Nonhoff U, Lengauer T, Lehrach H, and Krobitsch S (2005). An integrative approach to gain insights into the cellular function of human ataxin-2. J Mol Biol 346, 203–214. [DOI] [PubMed] [Google Scholar]
- Ravikumar B, Vacher C, Berger Z, Davies JE, Luo S, Oroz LG, Scaravilli F, Easton DF, Duden R, O’Kane CJ, et al. (2004). Inhibition of mTOR induces autophagy and reduces toxicity of polyglutamine expansions in fly and mouse models of Huntington disease. Nat Genet 36, 585–595. [DOI] [PubMed] [Google Scholar]
- Ribbeck K, and Gorlich D (2002). The permeability barrier of nuclear pore complexes appears to operate via hydrophobic exclusion. Embo J 21, 2664–2671. [DOI] [PMC free article] [PubMed] [Google Scholar]
- Romero CM, Paez MS, Miranda JA, Hernandez DJ, and Oviedo LE (2007). Effect of temperature on the surface tension of diluted aqueous solutions of 1,2-hexanediol, 1,5-hexanediol, 1,6-hexanediol and 2,5-hexanediol. Fluid Phase Equilibr 258, 67–72. [Google Scholar]
- Sellier C, Campanari ML, Julie Corbier C, Gaucherot A, Kolb-Cheynel I, Oulad-Abdelghani M, Ruffenach F, Page A, Ciura S, Kabashi E v et al. (2016). Loss of C9ORF72 impairs autophagy and synergizes with polyQ Ataxin-2 to induce motor neuron dysfunction and cell death. Embo J 35, 1276–1297. [DOI] [PMC free article] [PubMed] [Google Scholar]
- Sheffield P, Garrard S, and Derewenda Z (1999). Overcoming expression and purification problems of RhoGDI using a family of “parallel” expression vectors. Protein Expr Purif 15, 34–39. [DOI] [PubMed] [Google Scholar]
- Shi KY, Mori E, Nizami ZF, Lin Y, Kato M, Xiang S, Wu LC, Ding M, Yu Y, Gall JG, et al. (2017). Toxic PRn poly-dipeptides encoded by the C9orf72 repeat expansion block nuclear import and export. Proc Natl Acad Sci U S A 114, E1111–E1117. [DOI] [PMC free article] [PubMed] [Google Scholar]
- Sunde M, and Blake C (1997). The structure of amyloid fibrils by electron microscopy and X-ray diffraction. Adv Protein Chem 50, 123–159. [DOI] [PubMed] [Google Scholar]
- Sutter BM, Wu X, Laxman S, and Tu BP (2013). Methionine inhibits autophagy and promotes growth by inducing the SAM-responsive methylation of PP2A. Cell 154, 403–415. [DOI] [PMC free article] [PubMed] [Google Scholar]
- Swisher KD, and Parker R (2010). Localization to, and effects of Pbp1, Pbp4, Lsm12, Dhh1, and Pab1 on stress granules in Saccharomyces cerevisiae. PLoS One 5, e10006. [DOI] [PMC free article] [PubMed] [Google Scholar]
- Takahara T, and Maeda T (2012). Transient sequestration of TORC1 into stress granules during heat stress. Mol Cell 47, 242–252. [DOI] [PubMed] [Google Scholar]
- Tatton WG, and Olanow CW (1999). Apoptosis in neurodegenerative diseases: the role of mitochondria. Biochim Biophys Acta 1410, 195–213. [DOI] [PubMed] [Google Scholar]
- van Dijken JP, Bauer J, Brambilla L, Duboc P, Francois JM, Gancedo C, Giuseppin ML, Heijnen JJ, Hoare M, Lange HC, et al. (2000). An interlaboratory comparison of physiological and genetic properties of four Saccharomyces cerevisiae strains. Enzyme Microb Technol 26, 706–714. [DOI] [PubMed] [Google Scholar]
- Wootton JC (1994). Non-globular domains in protein sequences: automated segmentation using complexity measures. Comput Chem 18, 269–285. [DOI] [PubMed] [Google Scholar]
- Wu X, and Tu BP (2011). Selective regulation of autophagy by the Iml1-Npr2-Npr3 complex in the absence of nitrogen starvation. Mol Biol Cell 22, 4124–4133. [DOI] [PMC free article] [PubMed] [Google Scholar]
- Wullschleger S, Loewith R, and Hall MN (2006). TOR signaling in growth and metabolism. Cell 124, 471–484. [DOI] [PubMed] [Google Scholar]
- Zopf CJ, Quinn K, Zeidman J, and Maheshri N (2013). Cell-cycle dependence of transcription dominates noise in gene expression. PLoS Comput Biol 9, e1003161. [DOI] [PMC free article] [PubMed] [Google Scholar]
Associated Data
This section collects any data citations, data availability statements, or supplementary materials included in this article.
Supplementary Materials
Movie S1. Live cell imaging of cells expressing Pbp1-yoEGFP. Related to Figure 3.
Figure S1. Pbp1 is a negative regulator of TORC1 that functions during respiratory growth. Related to Figure 1.
(A) Images of WT and pbp1Δ cells after switching from YPL to SD–N medium for 8 h. pbp1Δ mutant cells were able to induce mitophagy following switch to SD-N medium. Scale bar = 1 μm.
(B) GFP cleavage assay showing pbp1Δ cells are able to induce mitophagy following switch to SD-N.
(C) Growth of WT and pbp1Δ cells in SD and SD–N medium. pbp1Δ cells exhibited comparable cell growth to WT in the presence of glucose. Data were mean ± s.d. from 3 independent experiments.
(D) SILAC quantitative proteomic approach for assessing global changes in protein levels in pbp1Δ versus WT cells. The ratio of the expression amounts of all 608 proteins detected in pbp1Δ versus WT cells were plotted. Proteins present at increased amounts in pbp1Δ in SL ((pbp1Δ / WT)SL > 1.5), but not in SCL (0.5 < (pbp1Δ / WT)SCL < 1.5) are highlighted in red, and listed in Table S1.
(E) Gene ontology analysis for proteins that exhibit increased abundance in pbp1Δ cells in SL medium (proteins highlighted in red in (D)).
(F) Correlation plot comparing the amounts of ribosomal proteins in pbp1Δ versus WT cells in SCL (X-axis) and SL (Y-axis). Ribosomal proteins were increased in abundance in pbp1Δ cells in SL medium. Protein identities are listed in Table S2.
Figure S2. Regions of the Pbp1 protein required for interaction and inhibition of TORC1. Related to Figure 2.
(A) Images of Kog1-superfolderGFP expressed at endogenous levels in WT and pbp1Δ cells in SL medium. Vph1: vacuolar membrane protein. Scale bar = 1 μm.
(B) RNase A treatment did not affect the interaction between Kog1 and Pbp1. 200 μg/ml RNase A was added to cell lysates before immunoprecipitation of Pbp1.
(C) GFP cleavage assay showing autophagy in cells expressing Pbp1 mutants lacking the putative RNA-binding domains alone or in combination. Deletion of these domains did not affect autophagy.
(D) Growth curves of cells expressing the indicated variants of Pbp1. Data were mean ± s.d. from 3 independent experiments.
(E) Immunoprecipitation assessing the interaction between Kog1 and various Pbp1 deletion mutants shown in Figure 2C. Cell culture and immunoprecipitation were performed as described in Figure 2A. Note that the Pbp1 mutants lacking a.a.338-442 (mutant 6, 8, 9, 12, 13) showed reduced interaction with Kog1. *non-specific signal
Figure S3. Pbp1 and other stress granule-associated proteins do not form foci-like granules when expressed at endogenous levels during respiratory growth. Related to Figure 3.
(A) Images of Pab1-mCherry or Pub1-mCherry expressed at endogenous levels in WT cells. (Top) 6 h after switching from YPL to SL medium. (Bottom) 25 min after switching from SCD to SC medium (glucose deprivation). Scale bar = 1 μm.
(B) Images of Pbp1-yoEGFP (yeast optimized EGFP) in cells growing 3 h in SL medium and then treated with indicated concentrations of 1,6-hexanediol (1,6-HD) for 10 min. Scale bar = 1 μm.
(C) Images of Pbp1-GFP in cells growing in SL medium with DMSO or 25 μg/ml cycloheximide (CHX). Images were taken 1 h after switch. Note that CHX treatment did not change the distribution pattern of Pbp1. Scale bar = 1 μm.
Figure S4. Low complexity regions within the Pbp1 protein and sensitivity of Pbp1_LC fibrils to hexanediols. Related to Figure 4.
(A) Low complexity sequences analysis identified using the SEG program. (Left column) low complexity region. (Right column) non-low complexity region.
(B) Dissolution of the Pbp1_LC fibrils by the 1,6- or 2,5-hexanediols (HD). Note that the fibrils were more sensitive to 1,6-HD. Data were mean ± s.d. from 3 independent experiments.
Figure S5. Localization of Pbp1 in relation to organelle markers. Related to Figure 5.
Images of cells expressing Pbp1-GFP with either Vphl-mCherry (vacuole), Sec63-mCherry (endoplasm reticulum), or Mito-DsRed (mitochondria) in SL medium. Note that the localization of Pbp1 is completely exclusive of mitochondria, suggesting it may form a condensate surrounding mitochondria. Scale bar = 1 μm.
Figure S6. Properties of fibrils or phase-separated droplets formed by the indicated M -> S mutants within the LC region of Pbp1. Related to Figure 6.
(A) Electron micrographs of purified GFP-Pbp1_LC bearing indicated M to S mutations. All 3 Pbp1_LC variants showed reduced ability to form fibrils. M11,12S showed the weakest ability. Scale bar = 500 nm.
(B) Phase-separated droplet formation by purified His6-Pbp1_LC containing indicated methionine to serine mutations. Images were taken 30 min and 24 h after lowering the salt concentration. Scale bar = 10 μm.
(C) Dissolution of phase-separated droplets formed from the indicated proteins by dilution. Turbidity was measured by light scattering at 600 nm. Phase-separated droplets formed by the variant bearing 8 methionine mutations dissolved more readily following dilution of the protein concentration. Data were mean ± s.d. from 3 independent experiments.
Figure S7. Microfluidic imaging and analysis of cell division for WT and pbp1Δ cells in glucose medium. Related to Figure 7.
(A) pbp1Δ cells exhibited comparable division times compared to WT in the presence of glucose. The division period was plotted against replicative life span (RLS) for WT and pbp1Δ cells. Each box plot contains data from n=5-77 and n=5-69 for WT and pbp1Δ cells, respectively. In total, data from 468 (WT) and 382 (pbp1Δ) division events were recorded.
(B) Bright field images of representative WT and pbp1Δ cells with abnormal morphology at terminal stage.
Movie S2. FRAP analysis of phase-separated droplets formed by purified His6-Pbp1_LC and GFP-Pbp1_LC. Related to Figure 6.
Movie S3. FRAP analysis of phase-separated droplets formed by purified His6-Pbp1_LC M7-14S and GFP-Pbp1_LC M7-14S. Related to Figure 6.
Table S1. List of proteins detected in SILAC experiment in pbp1Δ versus WT cells. Related to Figure 1.
Proteins present at increased amounts in pbp1Δ in SL ((pbp1Δ / WT)SL > 1.5), but not in SCL (0.5 < (pbp1Δ / WT)SCL < 1.5) are highlighted in red.
Table S2. List of ribosomal proteins detected in SILAC experiment in pbp1Δ versus WT cells. Related to Figure S1.
Data Availability Statement
Methionine content analysis
Matlab script available at: https://github.com/tulabutsw/methionine-content-analysis-
Image processing analysis
The code and two example images are available at: https://github.com/tulabutsw/image_analysis