

Abstract
Background:
Timely treatment for melanoma may affect survival, and characterizing the predictors of delay may inform intervention strategies.
Objective:
To determine characteristics associated with the interval between diagnosis and surgery in melanoma.
Methods:
The National Cancer Database was used to examine factors associated with the interval between diagnosis and surgery among 213 146 patients with stage I, II, or III cutaneous melanoma.
Results:
Among privately insured patients, time to surgery was longer for patients aged 50 to 70 years (hazard ratio [HR], 0.96) and older than 70 years (HR, 0.83) compared with those younger than 50 years. In contrast, patients without private insurance experienced a shorter surgical wait time if older (HR for age 5070 years, 1.07; HR for age >70 years, 1.05). Other factors associated with longer surgical interval included nonwhite race, less education, higher comorbidity burden, advanced stage, and head or neck melanoma location.
Limitations:
Use of zip code—level data for income and education level.
Conclusion:
Patients with melanoma experience disparities in timely receipt of surgery.
Keywords: epidemiology, melanoma, National Cancer Data Base, patient disparities, surgical interval
The overall incidence of melanoma in the United States is rising, most rapidly among those aged 50 years and older.1–3 Survival decreases with higher disease stage; 5-year relative survival rates are 99%, 63%, and 20% for localized, regional, and distant disease, respectively.1,4,5
A recent National Cancer Database (NCDB) analysis showed that the interval between melanoma diagnosis and receipt of treatment is a determinant of survival.6 This was especially true for early stage disease; compared with patients with stage I melanoma who received surgical treatment within 1 month after biopsy, those who waited 30 to 59, 60 to 89, 90 to 119, and at least 120 days experienced decreases in overall survival by 5%, 16%, 29%, and 41%, respectively.6
Because delay of definitive surgery may affect survival, it is imperative to identify possible targets for interventions aimed at improving pathways to timely care. Although an earlier NCDB-based publication highlighted the prognostic value of timely surgery, it did not examine factors affecting wait time.6 This study aimed to ascertain patient-, provider-, and disease-related independent predictors of the interval between melanoma diagnosis and definitive surgical treatment.
METHODS
Database and patient selection
The NCDB is a facility- based, prospectively acquired database and a joint project of the American College of Surgeons and the American Cancer Society.7–9 The NCDB was queried for patients with diagnosis of melanoma reported between January 1, 2004, and December 31, 2015. The study population included patients with American Joint Committee on Cancer pathologic stage I, II, or III melanoma who received definitive surgical therapy (Fig 1). The primary outcome was defined as the number of days between diagnosis and definitive surgical procedure. Reasons for exclusion were zero value for the primary outcome, missing primary outcome and last contact date, or missing covariate data.
Fig 1.
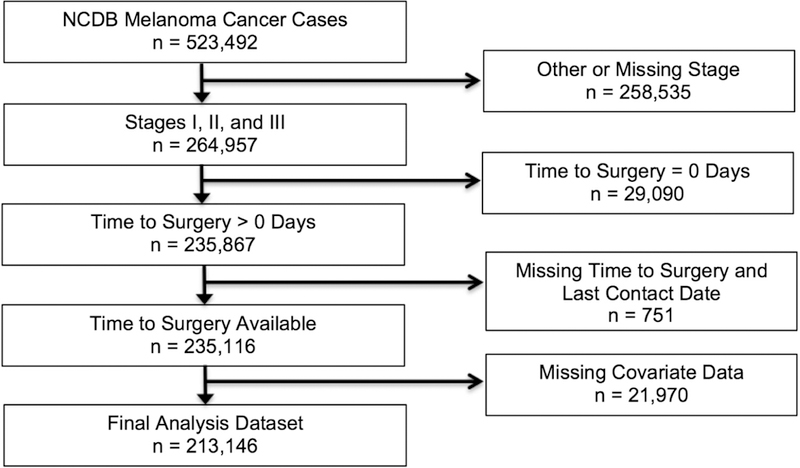
Flow diagram depicting exclusions to arrive at the analytic data set.
Each study participant was characterized with respect to age (<50 years, younger; 50–70 years, middle; >70 years, older), sex, race (white, nonwhite), insurance status (no insurance, private insurance, Medicaid, Medicare, other government insurance), residence (metropolitan [metro], urban, rural), distance to facility (≤25 miles, >25 miles), income, education, and comorbidities as assessed by Charlson-Deyo score (0, 1, ≥2).10,11 Household income and educational attainment were estimated by matching zip codes to 2012 American Community Survey data, categorizing the data into quartiles, and, for income only, adjusting for inflation to 2012 US dollar values.
Disease characteristics of interest included site (head and neck; trunk; extremity, shoulder, and hip), stage (1, 2, 3), laterality (right; left; midline; not paired/not specified/bilateral), histologic subtype, Breslow depth (≤1 mm, 1.01–2.00 mm, 2.01–4.00 mm, ≥4.01 mm), ulceration, mitoses, lymph vascular invasion, and year of diagnosis (2004–2006, 2007–2009, 2010–2012, 2013–2015).
The NCDB suppresses data on facility type and location (categorized into US Northeast, South, Midwest, or West) for patients younger than 40 years.
Statistical methods
Statistical analyses were performed in SAS, version 9.4 (Cary, NC). The unadjusted association between patient age and time from diagnosis to definitive surgery was examined by constructing Kaplan-Meier survival curves accompanied by the corresponding log-rank test. Multivariable Cox proportional hazards models were used to examine the same association after controlling for co-variates, with results expressed as adjusted hazard ratios (HRs) and 95% confidence intervals (CIs). An HR greater than 1 signifies a shorter time between diagnosis and surgery. To assess the clinical significance of observed results, we used model-derived adjusted HRs to estimate median wait time for patients with and without several risk factors considered simultaneously.12
Variables were tested for the proportional hazard assumption by evaluating log-log survival plots. Residency categories violated the proportional hazard assumption, prompting data-driven reclassification. Data on residence and proximity to reporting facility were subsequently combined to create a single variable with 4 categories: metro ≤25 miles, nonmetro ≤25 miles, metro >25 miles, and nonmetro >25 miles.
Models were examined for interaction between age and each covariate by evaluating the corresponding product terms; statistically significant terms underwent additional analyses to compare stratum-specific results. Many of these terms reflected the large sample size rather than meaningful effect modification. However, the interaction between age and insurance status showed pronounced differences across stratum-specific results. The association between age and time to surgery was evident among persons with private insurance but was not statistically significant or was in the opposite direction among those receiving Medicaid, Medicare, or other government insurance and those without insurance. Thus, multivariable analyses were conducted separately for persons with and without private health insurance. Data were further explored through 2 sensitivity analyses: one evaluated the effect of facility characteristics, and the other examined the data among Medicaid and Medicare patients.
RESULTS
Study cohort characteristics
The analytic cohort included 213 146 patients with melanoma (Fig 1). The majority of participants were white men; the median age at diagnosis was 61 years. Table I further describes the study cohort characteristics.
Table I.
Patient, facility, and disease characteristics by age category
| Variables | Total n (%) |
<50 years n (%) |
50–70 years n (%) |
>70 years n (%) |
|---|---|---|---|---|
| Sex | ||||
| Male | 122 032 (57.3) | 22 682 (41.9) | 59 244 (60.5) | 40 106 (65.6) |
| Female | 91 114 (42.8) | 31 420 (58.1) | 38 640 (39.5) | 21 054 (34.4) |
| Race | ||||
| White | 210 561 (98.8) | 53 368 (98.6) | 96 728 (98.8) | 60 465 (98.9) |
| Nonwhite | 2 585 (1.2) | 734 (1.4) | 1,156 (1.2) | 695 (1.1) |
| Insurance type | ||||
| Private | 119 541 (56.1) | 47 325 (87.5) | 65 539 (67.0) | 6677 (10.9) |
| Medicaid | 5070 (2.4) | 2611 (4.8) | 2064 (2.1) | 395 (0.7) |
| Medicare | 81 436 (38.2) | 1192 (2.2) | 26 717 (27.3) | 53 527 (87.5) |
| Other government | 2130 (1.0) | 635 (1.2) | 1141 (1.2) | 354 (0.6) |
| Uninsured | 4969 (2.3) | 2339 (4.3) | 2423 (2.5) | 207 (0.3) |
| Area and proximity to hospital | ||||
| Metro and far* | 38 894 (18.3) | 10 538 (19.5) | 18 379 (18.8) | 9977 (16.3) |
| Nonmetro and far | 25 088 (11.8) | 5950 (11.0) | 12 080 (12.3) | 7058 (11.5) |
| Metro and close | 141 034 (66.2) | 35 619 (65.8) | 63 671 (65.1) | 41 744 (68.3) |
| Nonmetro and close | 8130 (3.8) | 1995 (3.7) | 3754 (3.8) | 2381 (3.9) |
| Area-based income category† | ||||
| $63 0001+ | 88 500 (41.5) | 23 197 (42.9) | 41 331 (42.2) | 23 972 (39.2) |
| $48 000-$62 999 | 58 483 (27.4) | 14 816 (27.4) | 26 623 (27.2) | 17 044 (27.9) |
| $38 000-$47 999 | 43 134 (20.2) | 10 491 (19.4) | 19 600 (20.0) | 13 043 (21.3) |
| <$38 000 | 23 029 (10.8) | 5598 (10.4) | 10 330 (10.6) | 7101 (11.6) |
| Residents without high school degree, %† | ||||
| <7.0 | 72 079 (33.8) | 18 615 (34.4) | 33 468 (34.2) | 19 996 (32.7) |
| 7.0–12.9 | 74 689 (35.0) | 18 787 (34.7) | 34 169 (34.9) | 21 773 (35.5) |
| 13–20 | 45 398 (21.3) | 11 454 (21.2) | 20 703 (21.2) | 13 241 (21.7) |
| ≥21 | 20 980 (9.8) | 5246 (9.7) | 9544 (9.8) | 6190 (10.1) |
| Comorbidities (Charlson-Deyo score)‡ | ||||
| 0 | 184 944 (86.8) | 51 242 (94.7) | 84 938 (86.8) | 46 764 (79.7) |
| 1 | 23 456 (11.0) | 2598 (4.8) | 10 995 (11.2) | 9863 (16.1) |
| 2 | 4746 (2.2) | 262 (0.5) | 1951 (2.0) | 2533 (4.1) |
| Facility location§ | ||||
| Northeast | 41 970 (19.7) | 6281 (11.6) | 21 435 (21.9) | 14 254 (23.3) |
| Midwest | 48 095 (22.6) | 8201 (15.2) | 25 217 (25.8) | 14 677 (24.0) |
| South | 63 761 (29.9) | 9501 (17.6) | 32 924 (33.6) | 21 336 (34.9) |
| West | 34 324 (16.1) | 5123 (9.5) | 18 308 (18.7) | 10 893 (17.8) |
| Missing | 24 996 (11.7) | 24 996 (46.2) | 0 | 0 |
| Facility type | ||||
| Academic/research program | 91 320 (42.8) | 14 758 (27.3) | 48 602 (49.7) | 27 960 (45.7) |
| Community cancer program | 10 795 (5.1) | 1612 (3.0) | 5448 (5.6) | 3735 (6.1) |
| Comprehensive community cancer program | 67 677 (31.8) | 9742 (18.0) | 34 345 (35.1) | 23 590 (38.6) |
| Integrated network cancer program | 18 358 (8.6) | 2994 (5.5) | 9489 (9.7) | 5875 (9.6) |
| Missing | 24 996 (11.7) | 24 996 (46.2) | 0 | 0 |
| Stage | ||||
| 1 | 139 311 (65.4) | 38 657 (71.5) | 65 537 (67.0) | 35 117 (57.4) |
| 2 | 44 600 (20.9) | 7166 (13.3) | 18 953 (19.4) | 18 481 (30.2) |
| 3 | 29 235 (13.7) | 8279 (15.3) | 13 394 (13.7) | 7562 (12.4) |
| Site | ||||
| Head and neck | 45 480 (21.3) | 7240 (13.4) | 18 955 (19.4) | 19 285 (31.5) |
| Extremity, shoulder, and hip | 98 432 (46.2) | 26 212 (48.5) | 45 211 (46.2) | 27 009 (44.2) |
| Trunk | 69 234 (32.5) | 20 650 (38.2) | 33 718 (34.5) | 14 866 (24.3) |
| Breslow depth (mm) | ||||
| ≤1.00 | 113 501 (53.3) | 32 517 (60.1) | 52 908 (54.1) | 28 076 (45.9) |
| 1.01–2.00 | 49 190 (23.1) | 12 300 (22.7) | 23 171 (23.7) | 13 719 (22.4) |
| 2.01–4.00 | 29 855 (14.0) | 5931 (11.0) | 12 967 (13.3) | 10 957 (17.9) |
| ≥4.01 | 20 600 (9.7) | 3354 (6.2) | 8838 (9.0) | 8408 (13.8) |
| Year of diagnosis | ||||
| 2004–2006 | 40 887 (19.2) | 12 810 (23.7) | 17 381 (17.8) | 10 696 (17.5) |
| 2007–2009 | 47 141 (22.1) | 13 256 (24.5) | 21 198 (21.7) | 12 687 (20.7) |
| 2010–2012 | 56 750 (26.6) | 13 573 (25.1) | 26 472 (27.0) | 16 705 (27.3) |
| 2013–2015 | 68 368 (32.1) | 14 463 (26.7) | 32 833 (33.5) | 21 072 (34.5) |
| Laterality | ||||
| Right | 86 007 (40.4) | 22 445 (41.5) | 39 666 (40.5) | 23 896 (39.1) |
| Left | 91 728 (43.0) | 23 755 (43.9) | 42 175 (43.1) | 25 798 (42.2) |
| Midline | 14 678 (6.9) | 3995 (7.4) | 6936 (7.1) | 3747 (6.1) |
| Other∥ | 20 733 (9.7) | 3907 (7.2) | 9107 (9.3) | 7719 (12.6) |
| Histology | ||||
| Not specified | 96 332 (45.2) | 25 105 (46.4) | 43 928 (44.9) | 27 299 (44.6) |
| Nodular | 23 363 (11.0) | 4848 (9.0) | 10 434 (10.7) | 8081 (13.2) |
| Amelanotic | 458 (0.2) | 55 (0.1) | 217 (0.2) | 186 (0.3) |
| Lentigo maligna | 10 484 (4.9) | 519 (1.0) | 4610 (4.7) | 5355 (8.8) |
| Superficial spreading | 70 757 (33.2) | 21 663 (40.0) | 33 509 (34.2) | 15 585 (25.5) |
| Acral lentiginous | 3293 (1.5) | 562 (1.0) | 1517 (1.6) | 1214 (2.0) |
| Desmoplastic | 3589 (1.7) | 402 (0.7) | 1535 (1.6) | 1652 (2.7) |
| Other | 4870 (2.3) | 948 (1.8) | 2134 (2.2) | 1788 (2.9) |
| Ulceration | ||||
| Absent | 166 283 (78.0) | 44 712 (82.6) | 77 468 (79.1) | 44 103 (72.1) |
| Present | 40 580 (19.0) | 7668 (14.2) | 17 615 (18.0) | 15 297 (25.0) |
| Unknown or missing | 6283 (3.0) | 1722 (3.2) | 2801 (2.9) | 1760 (2.9) |
| Mitoses | ||||
| Absent | 42 506 (20.0) | 10 072 (18.6) | 20 672 (21.1) | 11 762 (19.2) |
| Present | 68 216 (32.0) | 14 798 (27.4) | 31 945 (32.6) | 21 273 (35.1) |
| Unknown or missing | 102 424 (48.1) | 29 232 (54.0) | 45 267 (46.3) | 27 925 (45.7) |
| Lymph vascular invasion | ||||
| Absent | 96 895 (45.5) | 21 665 (40.0) | 46 199 (47.2) | 29 041 (47.5) |
| Present | 5493 (2.6) | 1071 (2.0) | 2466 (2.5) | 1956 (3.2) |
| Unknown or missing | 110 758 (52.0) | 31 376 (58.0) | 49 219 (50.3) | 30 163 (49.3) |
metro, Metropolitan.
Far is defined as residence >25 miles from the nearest facility.
Based on zip code—level data.
Comorbidity score includes myocardial infarction, congestive heart failure, peripheral vascular disease, cerebrovascular disease, dementia, chronic pulmonary disease, rheumatologic disease, peptic ulcer disease, liver disease, diabetes, hemiplegia, paraplegia, renal disease, and AIDS.
Northeast (CT, MA, ME, NH, RI, VT, NY, NJ, PA), South (DC, DE, FL, GA, MD, NC, SC, VA, WV, AL, KY, MS, TN, AR, LA, OK, TX), Midwest (IL, IN, MI, OH, WI, IA, KS, MN, MO, ND, NE, SD), West (AZ, CO, ID, MT, NM, NV, UT, WY, AK, CA, HI, OR, WA).
Not paired, not specified, or bilateral.
Overall time to surgery
The median interval between diagnosis and surgery was 29 days among patients younger than 50 years, 30 days in 50- to 70-year-olds, and 33 days in those older than 70 years. The difference in surgical interval across these 3 groups was statistically significant (log-rank, P < .0001).
Patients with private insurance
Among 119 541 patients with private insurance, the average wait time was longer for those 50 to 70 years of age (HR, 0.96; 95% CI, 0.95–0.97; P < .0001) and older than 70 years (HR, 0.83; 95% CI, 0.81–0.85; P < .0001) compared with those younger than 50 years (Table II).
Table II.
Factors associated with interval between diagnosis to definitive melanoma surgery among privately insured patients (n = 119 541)
| Variables | Categories | Hazard ratio | 95% Confidence interval | P value | |
|---|---|---|---|---|---|
| Age category, years | <50 | Ref | |||
| 50–70 | 0.96 | 0.95 | 0.97 | <.0001 | |
| >70 | 0.83 | 0.81 | 0.85 | <.0001 | |
| Sex | Male | Ref | |||
| Female | 1.01 | 1.00 | 1.03 | .0273 | |
| Race | White | Ref | |||
| Nonwhite | 0.88 | 0.83 | 0.93 | .0001 | |
| Area and proximity to hospital | Metro and far* | Ref | |||
| Nonmetro and far* | 1.08 | 1.05 | 1.10 | <.0001 | |
| Metro and close | 1.16 | 1.15 | 1.18 | <.0001 | |
| Nonmetro and close | 1.30 | 1.26 | 1.35 | <.0001 | |
| Area-based income category† | $63 000+ | Ref | |||
| $48 000-$62 999 | 1.13 | 1.12 | 1.15 | <.0001 | |
| $38 000-$47 999 | 1.18 | 1.15 | 1.20 | <.0001 | |
| <$38 000 | 1.21 | 1.17 | 1.24 | <.0001 | |
| Residents without high school degree, %† | <7 | Ref | |||
| 7.0–12.9 | 0.89 | 0.87 | 0.90 | <.0001 | |
| 13–20 | 0.85 | 0.83 | 0.87 | <.0001 | |
| ≥21 | 0.82 | 0.80 | 0.84 | <.0001 | |
| Comorbidities (Charlson-Deyo score)‡ | 0 | Ref | |||
| 1 | 0.99 | 0.97 | 1.01 | .2650 | |
| 2 | 0.95 | 0.89 | 1.00 | .0610 | |
| Stage | 1 | Ref | |||
| 2 | 0.96 | 0.95 | 0.98 | .0002 | |
| 3 | 0.92 | 0.90 | 0.93 | <.0001 | |
| Site | Head and neck | Ref | |||
| Extremity, shoulder, and hip | 1.23 | 1.20 | 1.26 | <.0001 | |
| Trunk | 1.23 | 1.21 | 1.26 | <.0001 | |
| Year | 2004–2006 | Ref | |||
| 2007–2009 | 0.94 | 0.93 | 0.96 | <.0001 | |
| 2010–2012 | 0.86 | 0.83 | 0.89 | <.0001 | |
| 2013–2015 | 0.90 | 0.86 | 0.93 | <.0001 | |
metro, Metropolitan; Ref, reference.
Far is defined as residence >25 miles from the nearest facility.
Based on zip code—level data.
Comorbidity score includes myocardial infarction, congestive heart failure, peripheral vascular disease, cerebrovascular disease, dementia, chronic pulmonary disease, rheumatologic disease, peptic ulcer disease, liver disease, diabetes, hemiplegia, paraplegia, renal disease, and AIDS.
Other patient-related characteristics associated with longer interval from diagnosis to surgery included nonwhite race, low educational attainment, residence in a city suburb (ie, metropolitan area not in close proximity to reporting hospital), and 2 or more comorbidities. A longer wait time was also observed in patients with head or neck melanoma site and higher stage.
The clinical significance of the observed results is better understood by considering 2 sociodemographically distinct groups of patients. The first group includes white patients diagnosed with stage 1 melanoma of the trunk; all patients in this group are younger than 50 years, have no comorbidities, and reside in a nonmetro area with high average educational attainment that is close to a hospital. Based on the available data, the median interval between diagnosis and surgery in this group is 31 days. By contrast, a group that consists of nonwhite patients with stage 3 head or neck melanoma who are older than 70 years, have 2 or more comorbidities, and live in a metro area with low average education and located far from a hospital have a median wait time of 59 days. The difference in median time to surgery between the groups is 28 days.
Patients without private insurance
Unlike privately insured patients, those with other types of insurance (n = 93 605) had a shorter surgical wait time if they were older (Table III). With patients younger than 50 years used as a reference, the HR for those 50 to 70 years of age and those older than 70 years was similar (HR, 1.07; 95% CI, 1.04–1.10; P < .0001 and HR, 1.05; 95% CI, 1.02–1.08; P = .0006).
Table III.
Factors associated with interval between diagnosis and definitive melanoma surgery among patients without private insurance* (n = 93 605)
| Variables | Categories | Hazard ratio | 95% Confidence interval | P value | |
|---|---|---|---|---|---|
| Age category, years | <50 | Ref | |||
| 50–70 | 1.07 | 1.04 | 1.10 | <.0001 | |
| >70 | 1.05 | 1.02 | 1.08 | .0006 | |
| Sex | Male | Ref | |||
| Female | 0.98 | 0.96 | 0.99 | .0007 | |
| Race | White | Ref | |||
| Nonwhite | 0.81 | 0.76 | 0.86 | <.0001 | |
| Area and proximity to hospital‡ | Metro and far† | Ref | |||
| Nonmetro and far† | 1.06 | 1.04 | 1.09 | <.0001 | |
| Metro and close | 1.13 | 1.11 | 1.15 | <.0001 | |
| Nonmetro and close | 1.23 | 1.18 | 1.27 | <.0001 | |
| Area-based income category* | $63 000+ | Ref | |||
| $48 000-$62 999 | 1.15 | 1.13 | 1.17 | <.0001 | |
| $38 000-$47 999 | 1.20 | 1.18 | 1.23 | <.0001 | |
| <$38 000 | 1.21 | 1.18 | 1.24 | <.0001 | |
| Residents without high school degree, %‡ | <7 | Ref | |||
| 7.0–12.9 | 0.88 | 0.86 | 0.90 | <.0001 | |
| 13–20 | 0.83 | 0.81 | 0.85 | <.0001 | |
| ≥21 | 0.81 | 0.79 | 0.84 | <.0001 | |
| Comorbidities (Charlson-Deyo score) § | 0 | Ref | |||
| 1 | 0.99 | 0.98 | 1.01 | .4836 | |
| 2 | 0.93 | 0.90 | 0.96 | <.0001 | |
| Stage | 1 | Ref | |||
| 2 | 0.92 | 0.90 | 0.94 | <.0001 | |
| 3 | 0.85 | 0.83 | 0.87 | <.0001 | |
| Site | Head and neck | Ref | |||
| Extremity, shoulder, and hip | 1.21 | 1.19 | 1.24 | <.0001 | |
| Trunk | 1.22 | 1.19 | 1.25 | <.0001 | |
| Year | 2004–2006 | Ref | |||
| 2007–2009 | 0.92 | 0.90 | 0.94 | <.0001 | |
| 2010–2012 | 0.86 | 0.82 | 0.89 | <.0001 | |
| 2013–2015 | 0.89 | 0.85 | 0.92 | <.0001 | |
Ref, Reference.
Includes patients with Medicaid or Medicare without supplement, those with other government insurance, and the uninsured.
Far is defined as residence >25 miles from the nearest facility.
Based on zip code—level data.
Comorbidity score includes myocardial infarction, congestive heart failure, peripheral vascular disease, cerebrovascular disease, dementia, chronic pulmonary disease, rheumatologic disease, peptic ulcer disease, liver disease, diabetes, hemiplegia, paraplegia, renal disease, and AIDS.
The associations of most patient-related factors with surgical wait time did not differ by insurance status; however, racial differences and associations with lower area-based levels of educational attainment were more pronounced. Although most associations with disease-related characteristics were similar in patients with and without private insurance, the results for stage were stronger in the second group.
Extending the previous example to persons without private insurance, the median wait time among white patients with stage 1 trunk melanoma who are older than 70 years, have no comorbidities, and reside in a nonmetro area characterized by a highly educated population and located close to a hospital was 30 days. This is in contrast to an estimated median wait time of 58 days for a group of nonwhite patients with stage 3 head or neck melanoma who are younger than 50 years, have 2 or more comorbidities, and are living in a metro area characterized by low average educational attainment and located far from the hospital. Thus, there is a 28-day difference in median wait time between the groups.
Sensitivity analyses
The results of sensitivity analyses controlling for facility location and type showed similar associations between patient age and surgery delay. Comparing 50- to 70-year-olds and those older than 70 years versus the reference group produced HRs (95% CIs) of 0.96 (0.95–0.98) and 0.86 (0.83–0.88) among patients with private insurance. The corresponding HRs (95% CIs) for patients without private insurance were 1.07 (1.04–1.11) and 1.05 (1.02–1.09). Subgroup analyses conducted separately for patients with Medicare and Medicaid produced similar associations between age and time to surgery in the former group, but the results in latter group were not significantly different from the null value.
DISCUSSION
Median time to definitive melanoma surgery differed between age groups, with older people experiencing the longest delay. A meaningful interaction between age and insurance type was observed: among patients with private insurance, older age was associated with a longer time to surgery when controlling for other factors. Conversely, older age was associated with a shorter time to surgery among patients without private insurance. Among either insurance type, factors associated with a longer time to surgery included nonwhite race, less education, farther distance from hospital facility, head or neck site, higher disease stage, and greater comorbidity burden.
Lott et al13 investigated delay of surgery, defined as more than 6 weeks between biopsy and surgical excision, for melanoma among Medicare beneficiaries using the linked Surveillance, Epidemiology, and End Results—Medicare database. After adjustment, the incidence of surgical delay was highest among patients older than 85 years with a history of previous melanoma and more comorbidities.13 More recently, Adamson et al14 examined how surgical delays vary by insurance type among patients with melanoma in North Carolina. The patients most likely to experience delay, defined as surgery more than 6 weeks after diagnosis, included those with Medicaid, of nonwhite race, and who did not have diagnosis or surgical treatment performed by a dermatologist.14
The impact of surgical wait time on survival in melanoma remains an area of uncertainty. In a retrospective analysis of 986 Scottish patients, the time between biopsy and excision was found to have no effect on overall disease-free or recurrence-free survival after adjustment.15 Carpenter et al16 performed a prospective study with similar results: using a benchmark of 28 days from biopsy to surgery they found no difference in overall survival. However, a trend of decreased overall survival was observed with an interval longer than 56 days.16 More recently, Conic et al6 showed that time to definitive surgical treatment longer than 90 days is associated with decreases in overall survival. For patients with stage I melanoma, a higher risk of mortality was seen for every group treated beyond 30 days after biopsy.6 Outside of mortality benefit, the time to treatment interval is an important quality measure in melanoma care.
A notable finding of this study is the difference in the effect of age on surgical interval by insurance status. Older patients experience a delay to surgery more frequently than younger patients among the privately insured, but this result is the opposite among those without private insurance. This finding may be due to coverage differences between Medicare (without supplement) and Medicaid and access among people with these insurance types. A previous study found that only 41% of dermatologists surveyed would accept new patients with Medicaid.17 Among dermatology practices, the new patient acceptance rate is lower and mean appointment wait time is 13 days longer for patients with Medicaid compared with Medicare or private insurance.18 It has been shown that patients with melanoma who are younger than 65 years and have Medicaid or are uninsured have worse all-cause and cause-specific survival,19 and perhaps a longer surgical interval, along with poor access, is contributing to this disparity.
Nonwhite patients are more likely to experience surgical delays than white patients. Despite composing a small proportion of those with melanoma diagnoses, nonwhite patients have poorer survival outcomes and present with more advanced disease, often attributed to low suspicion for melanoma in nonwhite patients by health care providers.20–22 Equalizing the surgical interval for nonwhite patients could be a step in improving melanoma care for all patients, regardless of skin color.
In all analyses, patients who lived closer to the hospital experienced shorter times to surgery, perhaps due to patient-related and logistical factors. Longer travel distances mean more time away from work, greater transportation expenses, and conceivably less psychosocial support. Increasing distance from a health care provider has been shown to be associated with with greater tumor depth at presentation and reflects overall access to care.23,24 Remote care through telemedicine may help in this regard, especially for preoperative visits.
Although income bracket was not a significant predictor after adjustment for facility-level factors, education appears to be important. Among patients with new melanoma diagnoses, those with a high school education were more likely to believe that their diagnosis was not serious compared with college-educated patients.25 Similarly, they were less likely to report that a physician had discussed melanoma risk factors, screening, or detection, reflecting suboptimal communication and health education practices.25 Perhaps the importance of timely surgery for melanoma is also not communicated.
Increasing time to surgery was seen in patients with more comorbidities, higher disease stage, and melanoma located on the head or neck. These factors may lead to complicated surgical approaches, perhaps limiting who can perform the surgery. It could also be that patients with greater comorbidity burdens require an additional anesthesia workup. Further research is warranted to identify specific roadblocks that patients face when navigating the health care system between diagnosis and surgical treatment.
Limitations
Although the NCDB captures almost 50% of new melanoma diagnoses in the United States,8 it is a hospital-based registry and therefore may not include patients diagnosed and treated in community-based private practice settings.9,26 However, most melanomas treated in such outpatient settings are in situ or stage I and have low impact on mortality. Limitations include the use of zip code—level data on income and education, which may not provide an accurate measure of patient-level characteristics. Additionally, we did not analyze whether each patient’s biopsy and definitive surgery were performed at the same institution. It is also reasonable to expect that a patient with a second primary melanoma would be more easily linked to care and, thus, timely surgery.
CONCLUSION
Patients with melanoma who are of nonwhite race, live farther from the health care facility, have less educational attainment, have more comorbidities, have melanoma of higher American Joint Committee on Cancer stage, or have melanoma located on the head or neck are more likely to have longer wait times from diagnosis to definitive surgical treatment than their peers. Elderly patients with private insurance experienced a longer time to surgery than nonelderly patients with private insurance, whereas those without private insurance experienced a shorter surgical interval than their younger counterparts. Public health intervention is warranted to address patient-, provider-, and facility-level factors contributing to surgical delay to improve care for all patients with melanoma.
The content is solely the responsibility of the authors and does not necessarily represent the official views of the National Institutes of Health. The data used in the study are derived from a deidentified NCDB file. The American College of Surgeons and the Commission on Cancer have not verified and are not responsible for the analytic or statistical methodology used or the conclusions drawn from these data by the investigator.
CAPSULE SUMMARY.
Longer time to surgery may affect melanoma survival; older, privately insured patients and younger patients without private insurance experience delay more often.
Interventions aimed at decreasing the interval between diagnosis and surgery should be targeted to specific populations.
Acknowledgments
Funding sources: Supported in part by the Biostatistics and Bioinformatics Shared Resource of Winship Cancer Institute of Emory University and National Institutes of Health/National Cancer Institute under award number P30CA138292 and in part by the National Institutes of Health/National Center for Advancing Translational Sciences under award numbers UL1TR002378 and KL2TR002381 (to Dr Yeung).
The abstract was presented in part at the American Association for Cancer Research Conference on “The Science of Cancer Health Disparities in Racial/Ethnic Minorities and the Medically Underserved” in New Orleans, LA, November 2-5, 2018.
Abbreviations used:
- CI
confidence interval
- HR
hazard ratio
- metro
metropolitan
- NCDB
National Cancer Database
Footnotes
Conflicts of interest: None disclosed.
REFERENCES
- 1.Siegel RL, Miller KD, Jemal A. Cancer statistics, 2018. CA Cancer J Clin. 2018;68(1):7–30. [DOI] [PubMed] [Google Scholar]
- 2.Nikolaou V, Stratigos AJ. Emerging trends in the epidemiology of melanoma. Br J Dermatol. 2014;170(1):11–19. [DOI] [PubMed] [Google Scholar]
- 3.Tsai S, Balch C, Lange J. Epidemiology and treatment of melanoma in elderly patients. Nat Rev Clin Oncol. 2010;7(3): 148–152. [DOI] [PubMed] [Google Scholar]
- 4.Enninga EAL, Moser JC, Weaver AL, et al. Survival of cutaneous melanoma based on sex, age, and stage in the United States, 1992–2011. Cancer Med. 2017;6(10):2203–2212. [DOI] [PMC free article] [PubMed] [Google Scholar]
- 5.Pollack LA, Li J, Berkowitz Z, et al. Melanoma survival in the United States, 1992 to 2005. J Am Acad Dermatol. 2011;65(5 Suppl 1):S78–S86. [DOI] [PMC free article] [PubMed] [Google Scholar]
- 6.Conic RZ, Cabrera CI, Khorana AA, Gastman BR. Determination of the impact of melanoma surgical timing on survival using the National Cancer Database. J Am Acad Dermatol. 2018;78(1): 40–46.e47. [DOI] [PMC free article] [PubMed] [Google Scholar]
- 7.American College of Surgeons. National Cancer Database. Available at: https://www.facs.org/quality-programs/cancer/ncdb. Accessed April 12, 2019.
- 8.Bilimoria KY, Stewart AK, Winchester DP, Ko CY. The National Cancer Data Base: a powerful initiative to improve cancer care in the United States. Ann Surg Oncol. 2008;15(3):683–690. [DOI] [PMC free article] [PubMed] [Google Scholar]
- 9.Boffa DJ, Rosen JE, Mallin K, et al. Using the National Cancer Database for outcomes research: a review. JAMA Oncol. 2017; 3(12):1722–1728. [DOI] [PubMed] [Google Scholar]
- 10.Charlson ME, Pompei P, Ales KL, MacKenzie CR. A new method of classifying prognostic comorbidity in longitudinal studies: development and validation. J Chronic Dis. 1987; 40(5):373–383. [DOI] [PubMed] [Google Scholar]
- 11.Deyo RA, Cherkin DC, Ciol MA. Adapting a clinical comorbidity index for use with ICD-9-CM administrative databases. J Clin Epidemiol. 1992;45(6):613–619. [DOI] [PubMed] [Google Scholar]
- 12.Christensen E Multivariate survival analysis using Cox’s regression model. Hepatology. 1987;7(6):1346–1358. [DOI] [PubMed] [Google Scholar]
- 13.Lott JP, Narayan D, Soulos PR, Aminawung J, Gross CP. Delay of surgery for melanoma among Medicare beneficiaries. JAMA Dermatol. 2015;151(7):731–741. [DOI] [PubMed] [Google Scholar]
- 14.Adamson AS, Zhou L, Baggett CD, Thomas NE, Meyer AM. Association of delays in surgery for melanoma with insurance type. JAMA Dermatol. 2017;153(11):1106–1113. [DOI] [PMC free article] [PubMed] [Google Scholar]
- 15.McKenna DB, Lee RJ, Prescott RJ, Doherty VR. The time from diagnostic excision biopsy to wide local excision for primary cutaneous malignant melanoma may not affect patient survival. Br J Dermatol. 2002;147(1):48–54. [DOI] [PubMed] [Google Scholar]
- 16.Carpenter S, Pockaj B, Dueck A, et al. Factors influencing time between biopsy and definitive surgery for malignant melanoma: do they impact clinical outcome? Am J Surg. 2008; 196(6):834–842. discussion 842–833. [DOI] [PubMed] [Google Scholar]
- 17.Resneck JS Jr, Isenstein A, Kimball AB. Few Medicaid and uninsured patients are accessing dermatologists. J Am Acad Dermatol. 2006;55(6):1084–1088. [DOI] [PubMed] [Google Scholar]
- 18.Resneck J Jr, Pletcher MJ, Lozano N. Medicare, Medicaid, and access to dermatologists: the effect of patient insurance on appointment access and wait times. J Am Acad Dermatol. 2004;50(1):85–92. [DOI] [PubMed] [Google Scholar]
- 19.Amini A, Rusthoven CG, Waxweiler TV, et al. Association of health insurance with outcomes in adults ages 18 to 64 years with melanoma in the United States. J Am Acad Dermatol. 2016;74(2):309–316. [DOI] [PubMed] [Google Scholar]
- 20.Rouhani P, Hu S, Kirsner RS. Melanoma in Hispanic and black Americans. Cancer Control. 2008;15(3):248–253. [DOI] [PubMed] [Google Scholar]
- 21.Dawes SM, Tsai S, Gittleman H, Barnholtz-Sloan JS, Bordeaux JS. Racial disparities in melanoma survival. J Am Acad Dermatol. 2016;75(5):983–991. [DOI] [PubMed] [Google Scholar]
- 22.Harvey VM, Patel H, Sandhu S, Wallington SF, Hinds G. Social determinants of racial and ethnic disparities in cutaneous melanoma outcomes. Cancer Control. 2014;21(4):343–349. [DOI] [PMC free article] [PubMed] [Google Scholar]
- 23.Stitzenberg KB, Thomas NE, Dalton K, et al. Distance to diagnosing provider as a measure of access for patients with melanoma. Arch Dermatol. 2007;143(8):991–998. [DOI] [PMC free article] [PubMed] [Google Scholar]
- 24.Snyder BM, Mounessa JS, Fazzari M, et al. Greater distance to an academic medical center is associated with poorer melanoma prognostic factors: the University of Colorado Experience. Derm Online J. 2017;23(11). PMID: 29447632. [PubMed] [Google Scholar]
- 25.Pollitt RA, Swetter SM, Johnson TM, Patil P, Geller AC. Examining the pathways linking lower socioeconomic status and advanced melanoma. Cancer. 2012;118(16):4004–4013. [DOI] [PubMed] [Google Scholar]
- 26.Institute of Medicine National Research Council National Cancer Policy Board. Status of the Cancer Care Data System. Chapter 5 In: Hewitt M, Simone JV, eds. Enhancing Data Systems to Improve the Quality of Cancer Care. Washington, DC: National Academies Press; 2000. [PubMed] [Google Scholar]