Abstract
In order to better characterize thermistors, a group of 405 bead-in-glass and disc thermistors were aged in constant temperature baths. Samples of 135 thermistors were aged in each of three constant temperature baths held at 0, 30, and 60 °C. Each sample was composed of 65 bead-in-glass and 70 disc thermistors which represented a total of six manufacturers and six resistance values. The thermistors were maintained at temperature for 550 to 770 days and their resistances and the bath temperatures were periodically monitored.
Analysis of the data revealed systematic differences between bead-in-glass and disc thermistors upon ageing and indicated a dependence of ageing behavior on bath temperature and resistance value. Drift rates within groups of thermistors from each manufacturer were fairly uniform. Large initial changes in the drift rate for the disc thermistors at 30 and 60 °C (and to a much lesser extent in the bead-in-glass thermistors) require that thermistors for use at an accuracy level of a few tens of millikelvins be aged prior to use.
Keywords: Clinical laboratory; medical thermometry; resistance thermometer; semiconductor thermometer, aging; thermistor; thermometer
1. Introduction
The use of thermistors has grown rapidly over the past few years and thermistors are now used in a wide variety of industries. In some cases, e.g., in the medical instrumentation industry, in clinical laboratories, and in other biomedical applications, they play a critical role in crucially important diagnostic procedures. In spite of their widespread use and in spite of the fact that they are used in vitally important clinical applications, they have not heretofore been adequately characterized with regard to their stability while being maintained at a fixed temperature or to their stability upon thermal cycling. In order to remedy this situation, especially in regard to their use by the biomedical community, we undertook a program to investigate the behavior of a large number of thermistors obtained from the major manufacturers. In this paper we report the results of an investigation of the stability of thermistors while they were being maintained at a fixed temperature.
Thermistors are ceramic semiconductors which exhibit large changes in resistance with changes in temperature. In this article, we shall consider only those thermistors which are composed of metal oxides and which have large, negative temperature coefficients of resistance. Among the advantages of thermistors are that they can be made small enough to be inserted into a cuvette or into a patient; they are rugged enough to withstand use by untrained personnel and they are sensitive enough that sophisticated measuring equipment is not needed. In addition, they are relatively inexpensive.
Thermistors are very non-linear in their response to temperature. To a first approximation, the resistance, R, of a thermistor obeys the relation
| (1) |
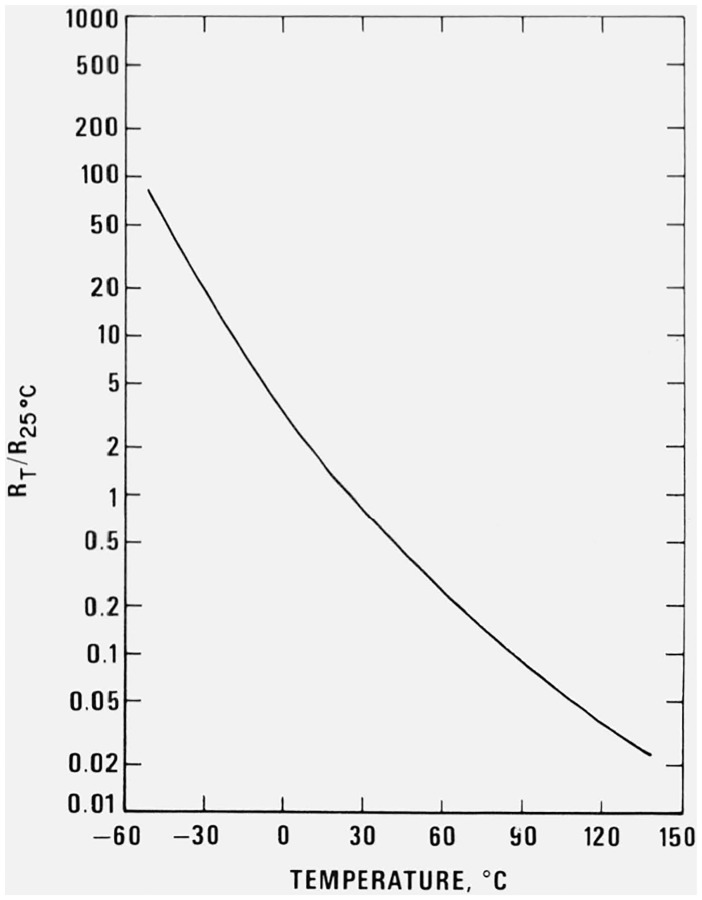
where R0 is the resistance at T0, β is a constant, and T is in kelvins. A graph of the logarithm of resistance as a function of temperature for a typical thermistor is shown in figure 1. There we see that the simple exponential is not adequate and that more terms are needed in the exponent to completely describe the resistance-temperature relationship [1–4].1 Although of intrinsic interest, the development of a more complete resistance-temperature relationship is beyond the scope of this paper.
Figure 1.
Ratio of thermistor resistance at temperature T to that at 25 °C versus temperature.
All of the commercially available forms of thermistors–discs, beads, rods, washers, and flakes–may be made from the same material and therefore obey the same resistance-temperature relationship. Because we chose to study bead-in-glass (hereinafter referred to as bead) and disc thermistors as representative of all thermistors, we will discuss the construction of only these two types.
Both beads and discs are prepared from a mixture of metal oxides, predominantly those of Mn and Ni, to which are added dopants (usually glass or oxides of Cu, Co, or Fe) to adjust the final resistance of the unit. For beads, the oxide mixture is added to a binder to create a slurry, a drop of which is placed across two taut lead wires. The bead is then dried and sintered, its leads are trimmed, and it is then coated with glass and heat treated. For discs, the oxide mixture is usually compressed under high pressure. The resulting pellet is sintered and its flat faces are coated with a paste consisting of silver and glass. The paste is fired, lead wires are soldered to the silvered faces with a tin-lead solder, and then the unit is heat treated. For discs, the resistance behaves much like that of a wire resistor (the resistance is proportional to the thickness and inversely proportional to the cross-sectional area of the disc) while for the beads, the resistance depends on a complex set of current paths between the two embedded lead wires. During sintering, the value of β (see eq 1) is fixed for both beads and discs. Thus, after sintering, the manufacturer can change the value of a thermistor’s resistance by changing its size and shape but he cannot change its temperature coefficient, α [α = (1/R)(dR/dT) = −β/T2].
2. Experimental Aspects
2.1. Thermistors Selected for Investigation.
Bead and disc thermistors were selected for the study because they are the most widely used by the medical industry, because they are representative of all forms of thermistors, and because their manufacture involves very different processes. Included in this study were resistance values which the medical instrumentation industry and clinical laboratories would find useful. For a given resistance value, we tried to assure that all of the thermistors had closely matched resistance-temperature characteristics between 0 and 125 °C. This was accomplished by choosing thermistors whose values of β were nearly identical. This was most important for the thermistors whose resistances at 25 °C are 5, 10 and 15 kΩ. These units can be made from either a high resistance oxide mixture to which are added resistance reducing dopants or a low resistance oxide mixture to which are added resistance increasing dopants. The 5, 10, 15 and 30 kΩ thermistors were made from a high resistance oxide mixture. The 1 and 2 kΩ thermistors were made from a low resistance oxide mixture.
As a final criterion, we selected those manufacturers which sell large numbers of thermistors to medical instrument manufacturers and clinical laboratories. While not all thermistor manufacturers were included, the six we chose represent the bulk of bead and disc sales in the United States. They are listed in table 1. The final choice of thermistor resistance values and the number of manufacturers for each value are shown in table 2.
Table 1.
Manufacturers from whom thermistors for this study were obtained
| Fenwal Electronics, Inc. |
| Gulton Industries, Inc. |
| Keystone Carbon Company |
| Thermometries, Inc. |
| Victory Engineering Corporation |
| Yellow Springs Instrument Company |
Table 2.
Thermistors used in this study
| Beads | Discs | ||
|---|---|---|---|
| Resistance at 25 °C, Ohms | Number of Manufacturers | Resistance at 25 °C, Ohms | Number of Manufacturers |
| 2,000 | 4 | 1,000 | 2 |
| 10,000 | 3 | 2,000 | 4 |
| 15,000 | 1 | 5,000 | 4 |
| 30,000 | 5 | 10,000 | 4 |
2.2. Equipment
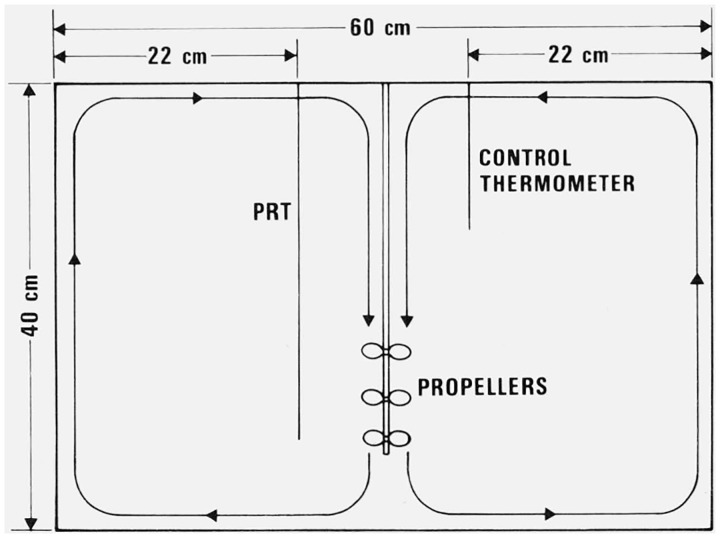
Three commercially available constant temperature baths were used in these experiments and they were similar in construction. Each bath was 55 × 35 × 35 cm in size and held approximately 60 L of non-conductive oil. There was a co-axial coil in each bath which served two purposes–the coolant from a small refrigeration unit circulated through the inner tube and the outer tube was the heater. This meant that the heating and cooling systems were in intimate contact and could work with each other smoothly, thereby producing better control of the temperature. The baths were stirred constantly by use of propellers and a stirring motor which produced the flow pattern shown in figure 2. In addition, there were shallow (~1 cm) vertical baffles along the sides of the bath to insure the circulation of the oil at the edges toward the center. By means of a commercially available controller, the temperature of each bath was controlled to within ±2 mK of its set point over the course of a day.
Figure 2.
Flow pattern of the oil in a constant temperature bath (front view) showing the positions of the monitoring (PRT) and control thermometers.
The baths were checked for uniformity with a 25.5 Ω platinum resistance thermometer. In horizontal planes 5.5 and 8 cm below the oil level of the bath, the largest non-uniformity occurred in the center of the bath where the oil is drawn down over the heating/cooling coil. At that position, the oil was approximately 2 mK colder than that at the sides of the bath. Temperature gradients along a vertical line were measured at the position of the platinum resistance thermometer (see fig. 2). The results of this check are given in table 3.
Table 3.
Temperature gradients in the constant temperature baths
| Nominal Temperature of Bath | Difference between temp, at top of bath and temp, at bottom of bath | Number of cm below top of bath liquid at which bottom measurements were made |
|---|---|---|
| 0 °C | 2 mK | 22.3 cm |
| 30 °C | − 3 mK | 24.2 cm |
| 60 °C | − 5 mK | 22.3 cm |
Because the initially installed bath fluids were non-conducting, the thermistor lead junctions were not electrically insulated from the fluid. Each of the two lead wires from the thermistor was connected to a current and a potential lead which went through a selector switch (see below) to a resistance bridge. Shrinkable insulation was put on each junction to provide mechanical strength and to prevent short circuits.
Two problems were encountered which were unique to the 0 °C bath. The first was a gradual accumulation of water in the bath fluid which was discovered when the accumulated ice on the heating/cooling coil severely inhibited temperature control. Readings were temporarily stopped after set 35 (elapsed day 232) while that water was removed (a set is defined throughout this paper as a complete measurement of the 135 thermistors and generally encompasses one or two days of effort). Approximately 600 mL of water were removed from the 60 L bath. Although water is not miscible with the bath fluid, it did circulate because of the stirring and some water collected in the shrinkable insulation surrounding the lead junctions. This water should have had the effect of shunting the thermistors since their lead wires were not electrically insulated. The water in the insulation was removed by manual flushing with an oil-filled syringe. After the bulk of the water had been removed, the bath fluid was pumped through a calcium sulfate drying column and through a filtering funnel whenever measurements were not being taken. In addition, the bath lid was loosely sealed and the nitrogen gas boil-off from a dewar of liquid nitrogen was channeled into the gas space above the fluid in the bath in an attempt to keep the bath dry. This system prevented further water from collecting in the bath fluid.
The second problem concerned the collection of minute particles in the insulation around the lead junctions. It is not known whether they were a corrosion product from the solder flux or residue from the drying column. Although most of the accumulated particles were removed either mechanically or by manually flushing the insulation, the filtering funnel was put into the drying line to clean the fluid.
These problems manifested themselves as a slow, asymptotic increase in resistance from some of the thermistors during the measurements (especially those thermistors whose resistances at 25 °C are 10 and 30 kΩ). The increases occurred over periods of tens of minutes and when the current was reversed the same increase was observed. It was thought that perhaps this was due to a small battery effect or contamination because of the particles or their solution in water surrounding the lead junctions. Cleaning the lead junctions helped considerably but did not always solve the problem.
Three 25.5 Ω standard platinum resistance thermometers (PRTs) were used to monitor the bath temperatures [5]. The PRT is a four-lead device and thereby the effects of lead resistance are eliminated. The resistances of the PRTs were measured with an a.c. resistance bridge (operating at 400 Hz) which was built at NBS [6]. The bridge measures the ratio of the resistance of a PRT to that of a 100 Ω standard resistor and its accuracy is stated to be 3 in the eighth dial corresponding to approximately 0.03 mK for a 25.5 Ω PRT. By this means also, resistances of the three PRTs were checked periodically at the triple-point-of-water using the a.c. resistance bridge as a check on the PRTs themselves.
Two commercially available systems were used to measure thermistor resistances. The resistances of those thermistors held at 30 and 60 °C were measured with a d.c. current comparator which measured the ratio of the thermistor resistance to that of a standard resistor [7]. With this comparator one makes four-lead measurements for resistances less than 10 kΩ and two-terminal measurements for resistances greater than 10 kΩ. Its stated inaccuracy is 2 in 107 plus 1 step in the eighth dial (1 × 10⁻⁷ times the value of the standard resistor).
The resistances of the thermistors held at 0 °C were measured with a d.c. direct-reading resistance bridge. Two three-lead measurements, R1 and R2, were taken for each thermistor and the result averaged according to the following formula:
where S is the value of the “range” resistor, a resistor in the ratio arm of the bridge. The stated inaccuracy of this bridge is 0.01 percent or 1 place in the sixth dial, whichever is greater.
The 1 kΩ and 10 kΩ standard resistors for the current comparator were maintained in boxes whose temperatures were thermostatically controlled and which remained constant to within ±0.003 °C. The temperatures of the 100 Ω standard resistors used with the a.c. bridge and the current comparator were not controlled but the resistors were used in a temperature controlled room. In addition, these resistors were thermally lagged with several centimeters of insulation (oil or foam rubber) in order to keep temperature fluctuations small and slow. All of the standard resistors had nominal temperature coefficients of 1 ppm/°C. The 1 kΩ and 10 kΩ standard resistors were calibrated by the Electrical Reference Standards Section at NBS in February, 1974. The resistances of the 100 Ω standard resistors were checked frequently by measuring them against the 1 kΩ standard resistor. Just before the experiment ended, we obtained two additional uncalibrated 100 Ω standard resistors which were kept in constant temperature boxes. Since the temperature controlled boxes removed uncertainties due to temperature fluctuations in the resistors, they were used in place of the non-temperature-controlled 100 Ω standard resistors for the last few sets of data at 0 °C. Their resistance values were checked against the 1 kΩ standard resistor.
A switching arrangement was used for the 135 thermistors in each of the three baths in order to avoid manually attaching each thermistor to the bridge when its resistance was to be measured. Heavy duty stepping switches were used and two switches were required to accommodate the 540 lead wires (4 leads × 135 thermistors) from each bath. The wipers of the six stepping switches were connected to a rotary switch which in turn was connected to the appropriate measuring system. Because of the large amounts of data involved and in order to eliminate transcription errors, the data were automatically recorded. The shafts of all the bridge switches were extended and additional switches were added to encode the switch positions. The data, thermistor measuring current, and standard resistor code were set manually on a bank of encoding switches. The current comparator had been internally wired by the manufacturer to transmit switch positions. All of the encoding switches were wired directly to a card punch. Each data card for the thermistors held at 30 and 60 °C contained the date and bridge ratios for two thermistors with their associated PRT ratios, thermistor number (generated by the stepping switch), measuring current and standard resistor code. For the thermistors held at 0 °C, each card contained the date as well as the bridge settings and associated data for the two measurements of each thermistor. In addition to eliminating operator error, this data logging system saved vast amounts of time–several thousand data cards were generated with little operator intervention.
2.3. Design of the Experiment
The basic design of the experiment was very straightforward. Five thermistors of each available manufacturer-bead/disc-resistance combination (a total of 135) were placed in each of three constant temperature baths for approximately two years while their resistances were monitored. The nominal temperatures at which the baths were kept and the dates during which the thermistors were measured are given in table 4. The thermistors were all received during July and August, 1973 and so had 9 to 19 months of ageing at NBS at room temperature prior to the experiment.
Table 4.
Dates during which thermistors were maintained at the indicated temperatures
| Temperature | Starting Date | Stopping Date |
|---|---|---|
| 0 °C | 10/10/74 | 11/18/76 |
| 30 °C | 5/30/74 | 7/7/76 |
| 60 °C | 1/9/75 | 7/15/76 |
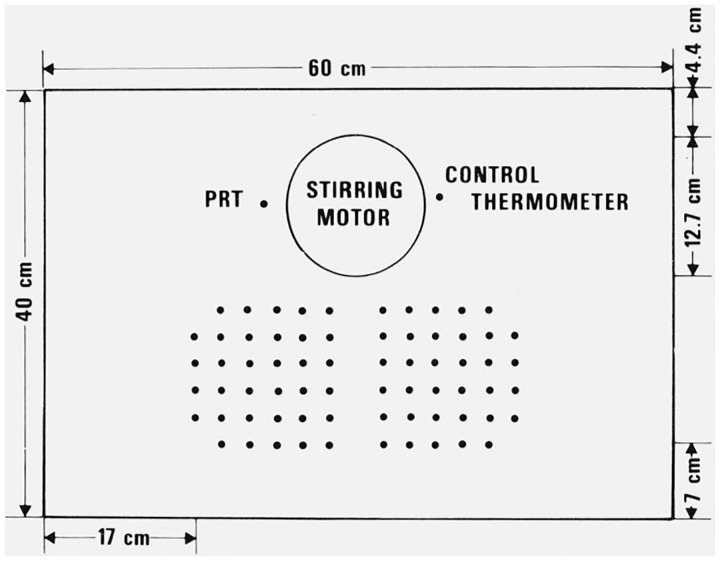
The help of the NBS Statistical Engineering Laboratory was sought to plan the placement of the thermistors in the bath in such a way as to maximize the information we could obtain about the effects of position in the bath on the drift rates and to assure that major factors in the study would not be affected by the minor factors. The center of the bath (which had a slightly cold zone) was avoided. Each bath lid contained openings as shown in figure 3 to accommodate the 135 thermistors (2 per hole) while avoiding the cold zone.
Figure 3. Diagram of the lid of a constant temperature bath.
Two thermistors were placed in each hole. The center of the bath was avoided because of a cold zone.
The major factors to be considered in the design were construction (bead or disc), manufacturer, and resistance value. The minor factors were row, column, quadrant, and edge versus center of the bath. Beads and discs were uniformly distributed throughout the bath. At least one thermistor from each manufacturer was in each row and in each column. One each of the 27 types of thermistors appeared in each quadrant and the fifth replicate appeared in the same hole as one of the other four. Each row in each quadrant contained at least one bead replication and at least one disc replication. All in all, each level of every major factor appeared at least once at each level of every minor factor. The thermistor placements for the 0 and 60 °C baths were permutations of the 30 °C bath placements:
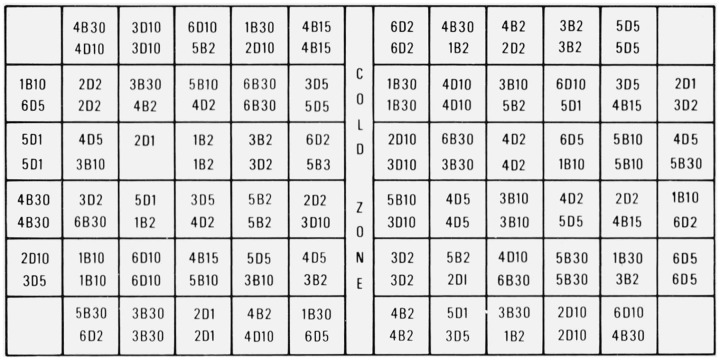
A detailed distribution for the 30 °C bath is given in figure 4. Each of the thermistors in figure 4 is coded according to its manufacturer, whether it is a bead or a disc, and its resistance value at 25 °C. The first number denotes one of the six manufacturers. The letter stands for bead (B) or disc (D). The last number gives the resistance of the thermistor at 25 °C in thousands of ohms. For example, thermistor 4B30 is a 30 kΩ bead thermistor from manufacturer 4 and 3D10 is a 10 kΩ disc thermistor from manufacturer 3.
Figure 4.
Diagram of the placement of the 135 thermistors held at 30 °C. The thermistors are coded with a number denoting the manufacturer, a B or D for bead or disc, and a number denoting the resistance in kilohms at 25 °C.
Using these designs, we were able to extract information about any effect that position in the bath might have and, more importantly, we were able to estimate the effect of each major factor unaffected by any of the minor factors.
Upon the advice of the Statistical Engineering Laboratory of NBS, each set of measurements was started with a different thermistor. Ideally, we would have measured the thermistors in random order within each set but time constraints made that impossible. The compromise of starting each set with a different thermistor and then proceeding cyclically was adopted to eliminate any effect that time-of-day might have. An attempt was made to eliminate the effect of measurement sequence by randomizing the positions of the thermistors on the stepping switches within each resistance value for each of the three baths.
2.4. Measurement Techniques
Each time a thermistor’s resistance was measured, the bath temperature was recorded with the PRT. There are two points of note associated with this procedure. First, the PRT element was located in the lower back corner of the bath. This meant that it was much deeper in the bath fluid than were the thermistors, and, as a result, it was in thermal contact with fluid which had recently passed over the heating/cooling coil. The thermistors were immersed several centimeters into the fluid and were exposed to it much later in the circulation pattern. The second point is that the PRT sensor is much larger and responds more slowly (its time constant is 3 to 6 s) than the thermistors (whose time constants range from subsecond to a few seconds) so a short-term average bath temperature was recorded. The temperature differences resulting from the placement of the PRT remained constant during the experiment because neither the relative placement of the thermistors and PRT nor the stirring rate changed.
The measuring current in the PRT was 1 mA. The thermistor current was 10 μA, a value chosen to make the effects of self-heating negligible. When the thermistors were not being measured, there was no current flowing through them.
The PRT was read to ±2.5 × 10⁻⁵ ohm (±0.25 mK). The thermistors were generally read to parts in 105 (~1 mK). This was the case for almost all of the thermistors in the 30 and 60 °C baths and for most of the thermistors in the 0 °C bath.
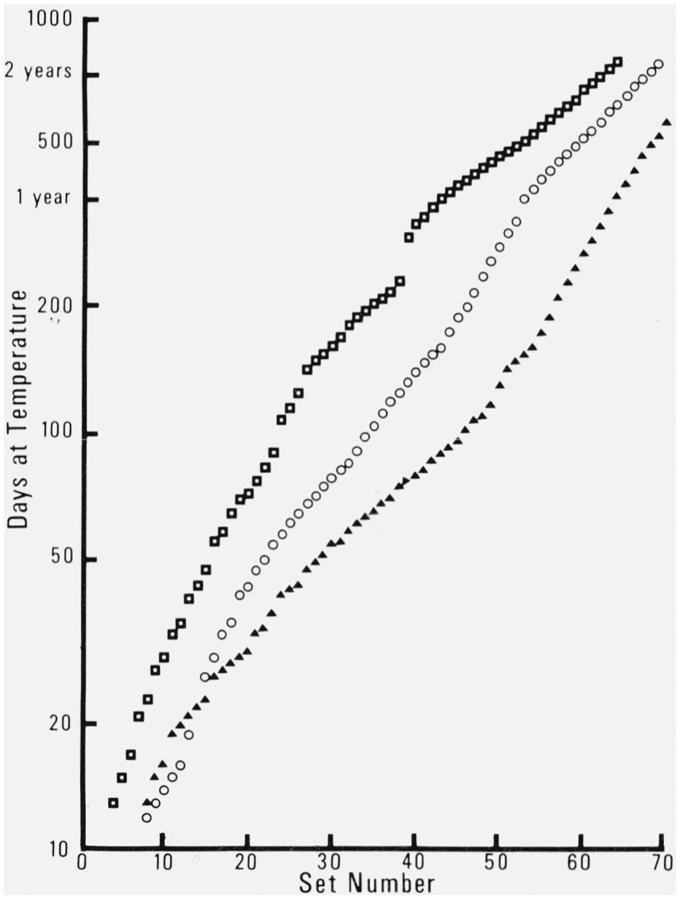
Thermistor resistances were initially measured daily and then with exponentially decreasing frequency until monthly measurements were being taken (see fig. 5). Measurements continued on a monthly basis for the duration of the experiment. This procedure enabled us to define with high resolution initial changes in the thermistors without having to take large amounts of data when changes were very small and quite linear.
Figure 5.
The correlation between set number and elapsed days at temperature. □ = 0 °C, ○ = 30 °C, and △ = 60 °C.
3. Discussion of Errors
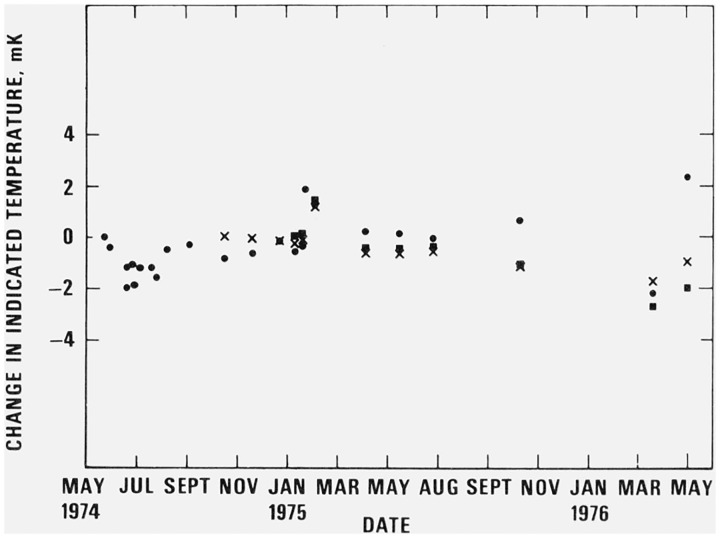
The data for the PRTs at the triple-point-of-water are shown in figure 6. The large scatter of the data is disappointing. A possible explanation is that the PRT elements were under increasing amounts of strain because of their constant vibration in the baths and because of mechanical strain involved in handling them during the triple-point-of-water measurements. Another explanation to partially account for this scatter is associated with the fact that the resistances of the PRTs approached their triple-point resistances, Rtp, very slowly (about h being required after insertion into the cell of the precooled thermometers). Thus, the measured value of Rtp depended on how long the thermometer had been in the triple-point cell before measurements were taken. No explanation of this behavior was found. Two different standard resistors were used with the resistance bridge in making the triple-point-of-water measurements. The one used for most of the data was not thermostated but its resistance was checked against the 1 kΩ standard resistor every time it was used. In any case, one would not expect its variations to produce both positive and negative drifts of the PRT resistances in the triple-point cell.
Figure 6. Data taken at the triple-point-of-water.
× = PRT used at 0 °C ● = PRT used at 30 °C, ■ = PRT used at 60 °C.
The two PRTs used at 0 and 60 °C had stainless steel sheaths and their resistances drifted downward. The PRT used at 30 °C had a glass sheath, was made by a different manufacturer, and its resistance increased in value. The difference in manufacturers is the only factor which we could correlate with such different drift behaviors.
Accuracy was not as important in this experiment as the precision of the measurements because it was the characterization of resistance changes that was of primary interest. Therefore, the potential problem of the PRT immersion relative to the thermistor immersion was of little consequence as long as the temperature gradients in the baths were constant. We have no reason to believe that the gradients were changing since the flow patterns were stable. Slowly varying sources of error were more important however. These include the drift of the PRT resistances at the triple-point-of-water and the 0.001 percent change in the resistance of the 1 kΩ standard resistor. The PRT drifts had only a small effect because the total drift was only a few millikelvins over several hundred days. The change in the 1 kΩ standard resistor was small but we have no way of determining when or at what rate the change occurred. The size of the change (0.001%) was determined by comparing the 1 kΩ standard resistor with two calibrated, temperature-controlled 100 Ω standard resistors which were calibrated in February 1977 by the Electrical Reference Standards Section at NBS.
Other errors arise from problems of a variable nature. These problems are associated with the PRT and thermistor resistance measurements, the effect of the water in the 0 °C bath, the changes in the two 100 Ω standards, and electrical noise picked up by the a.c. resistance bridge from the bath heaters. As mentioned above, the PRT resistances in the constant temperature baths were measured with a precision corresponding to ±0.25 mK. Conversion of the PRT resistance measurement to temperature involved both the PRT resistance at the triple-point-of-water and the resistance of one of the 100 Ω standard resistors. Both of these quantities varied by very small amounts but the variation in each nonetheless exceeded 0.5 mK over the total time of the study. The total measured variation of the 100 Ω standard resistor was less than 0.001% over a period of two years so the total error from this source amounts to ±0.25 mK. While neither of these problems of a variable nature was large in toto, they contributed significantly to the scatter seen in figure 15, displayed later in section 5 of the text.
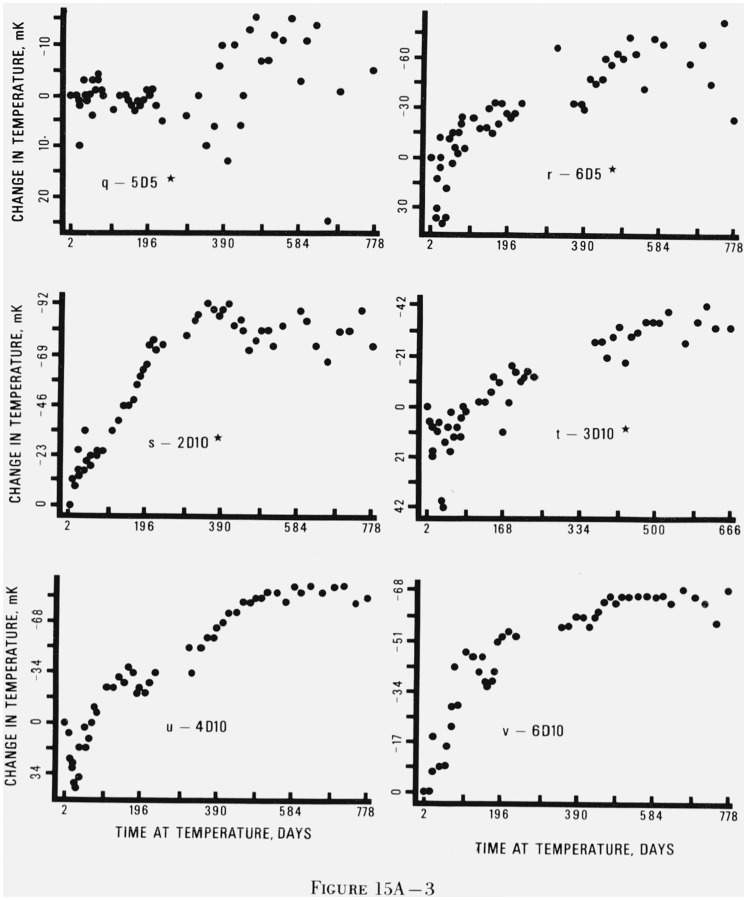
Figure 15. Graphs of changes in indicated temperature of thermistors as a function of elapsed days at temperature.
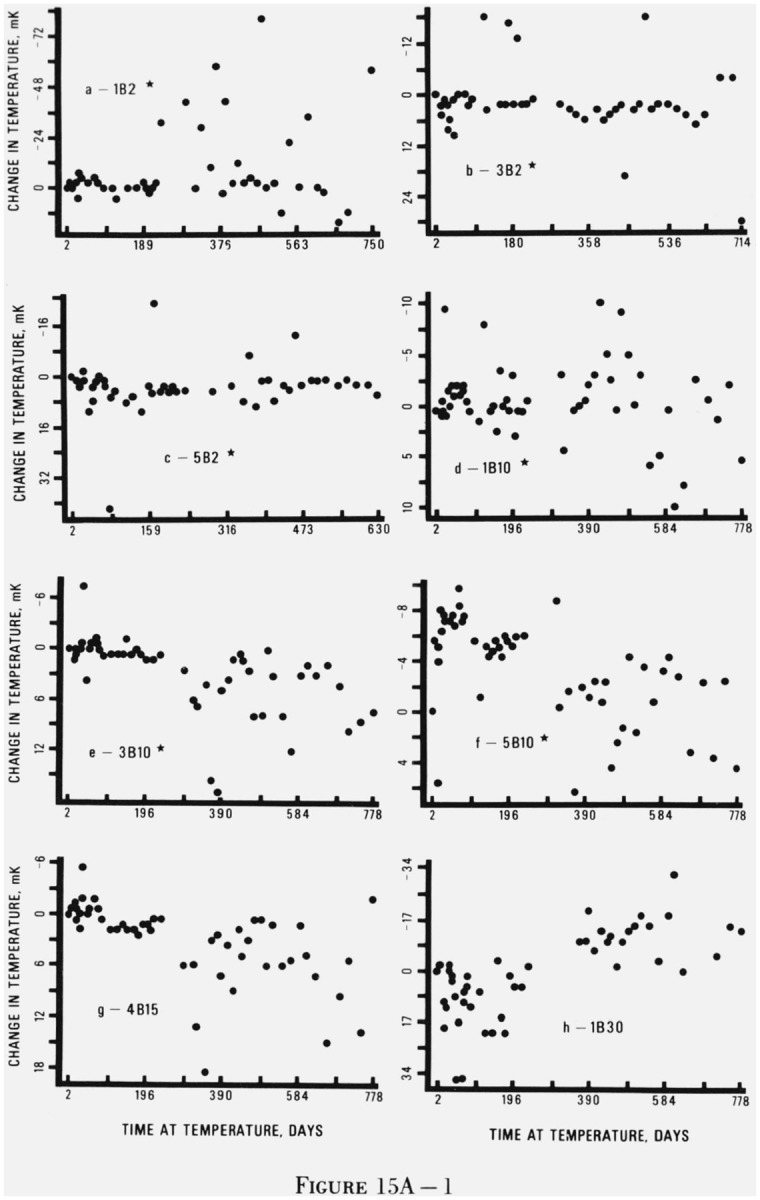
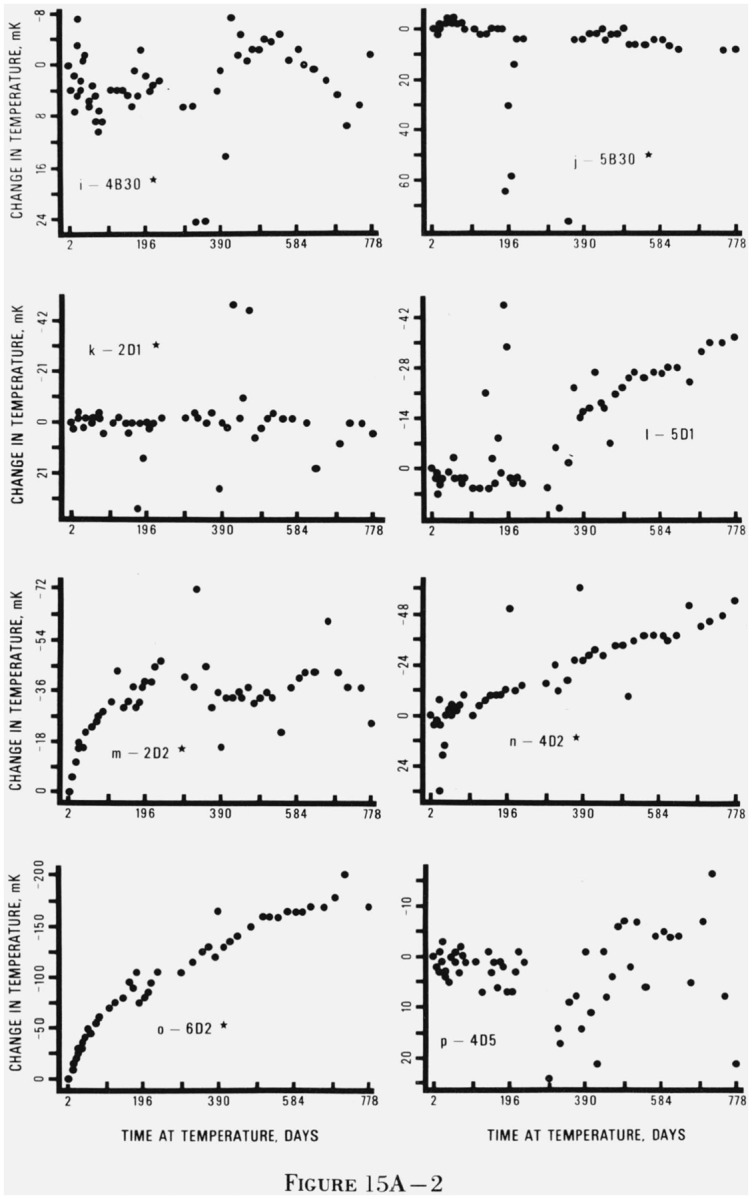
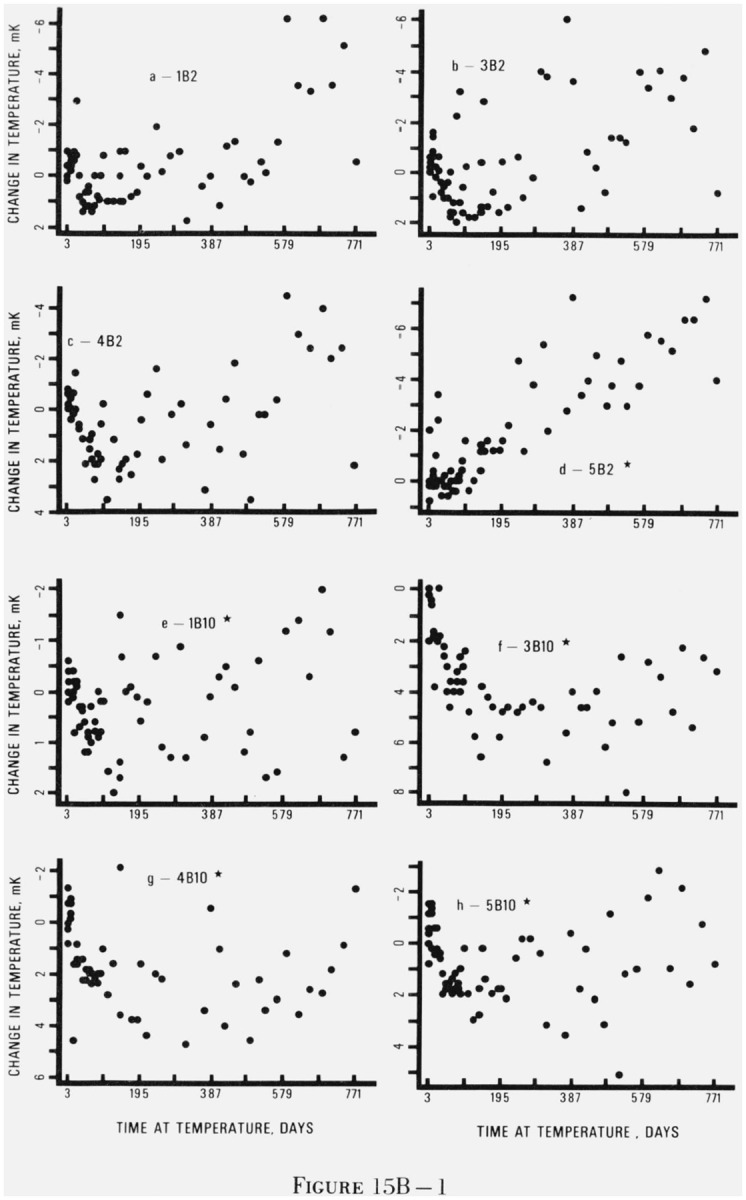
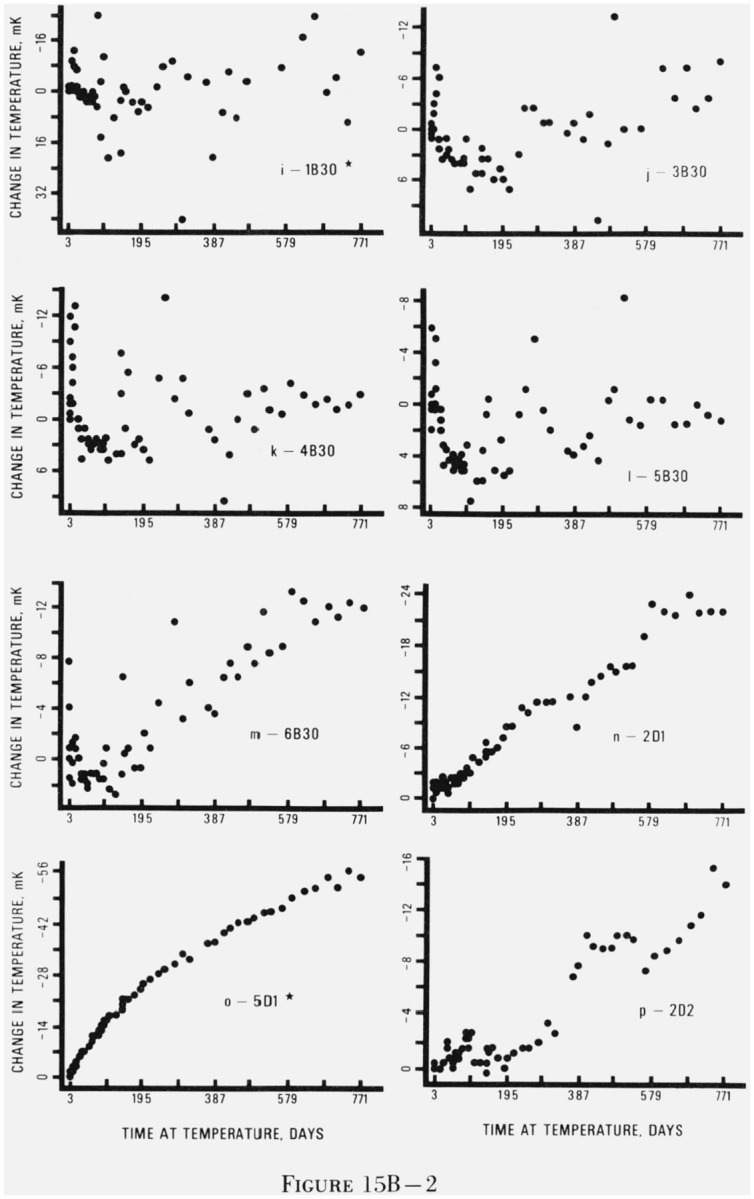
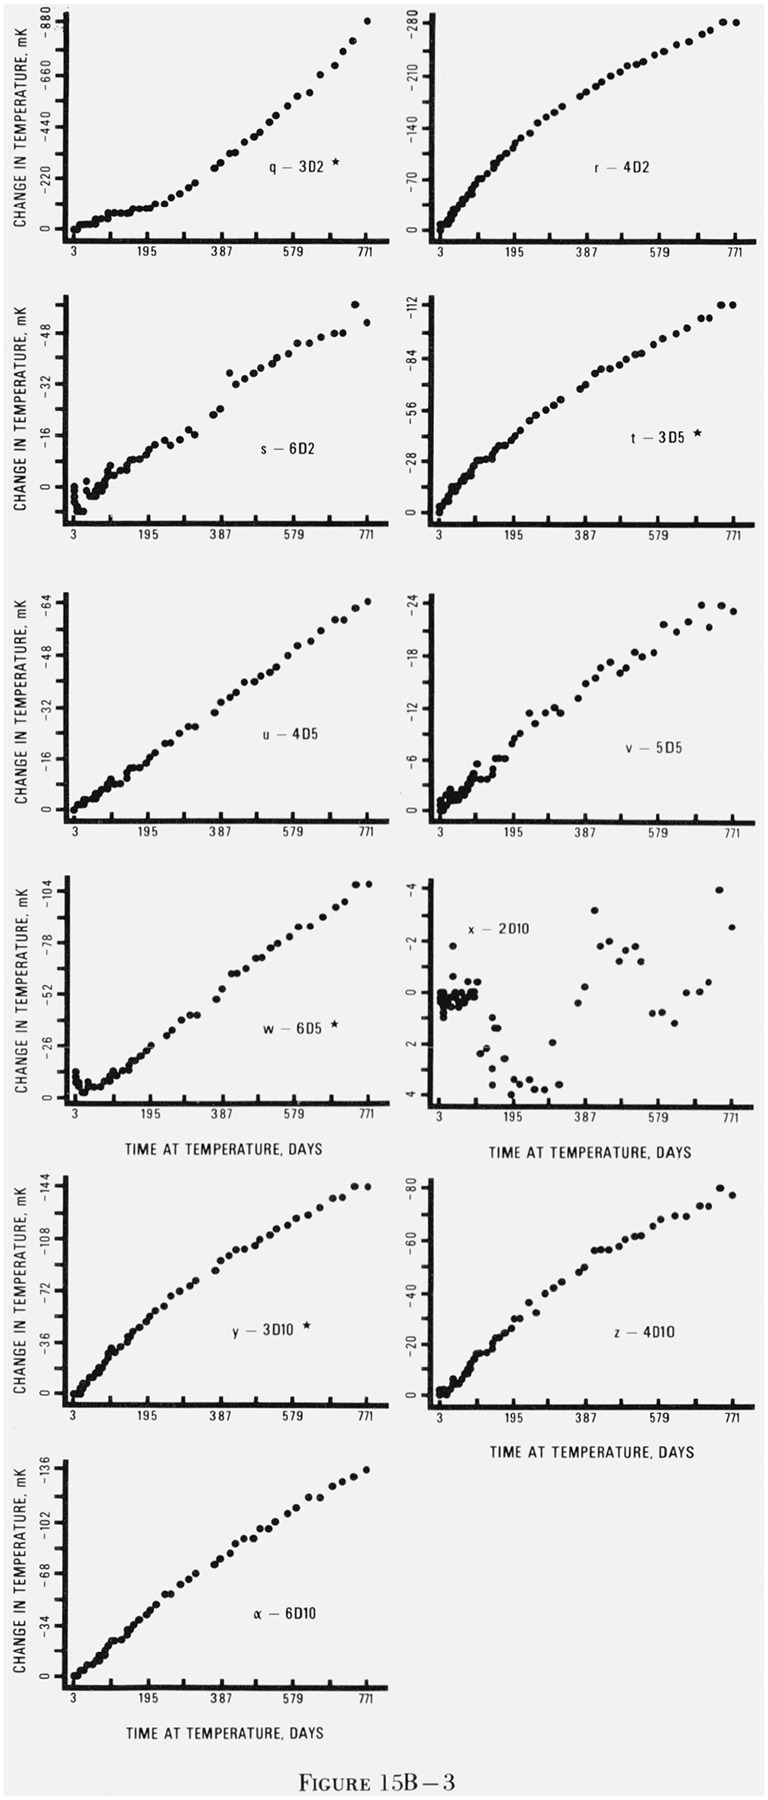
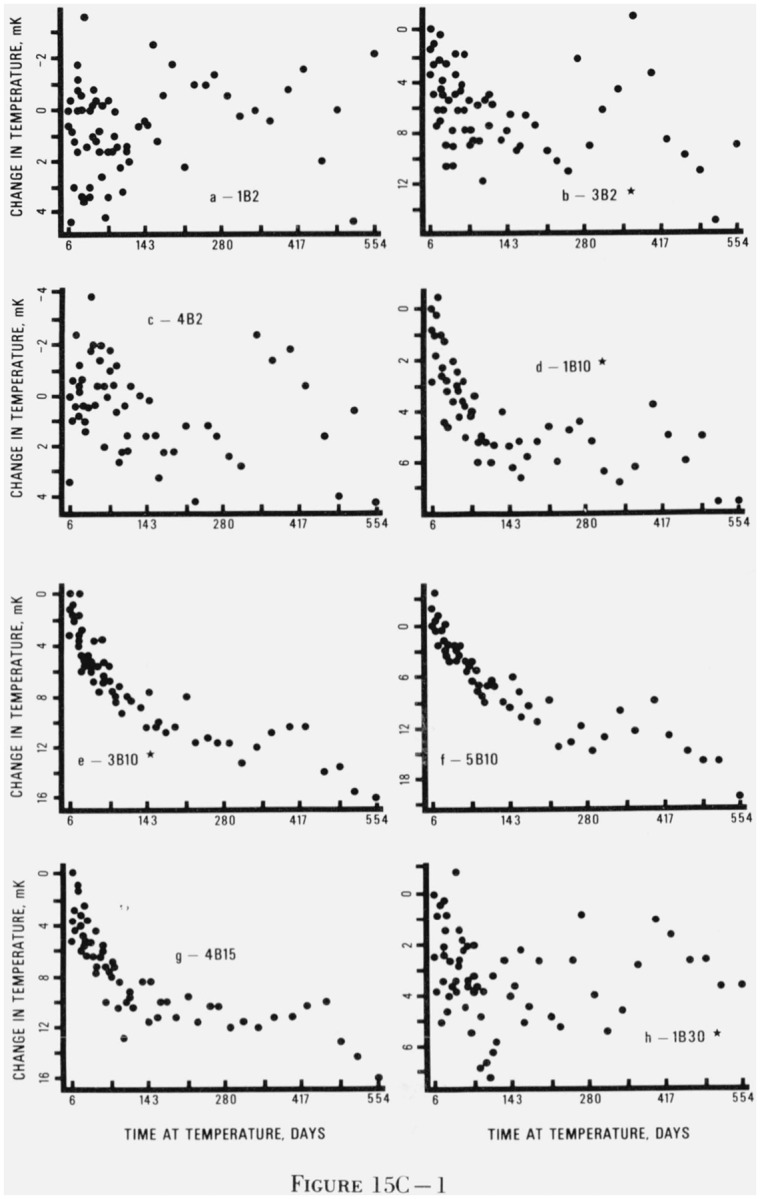
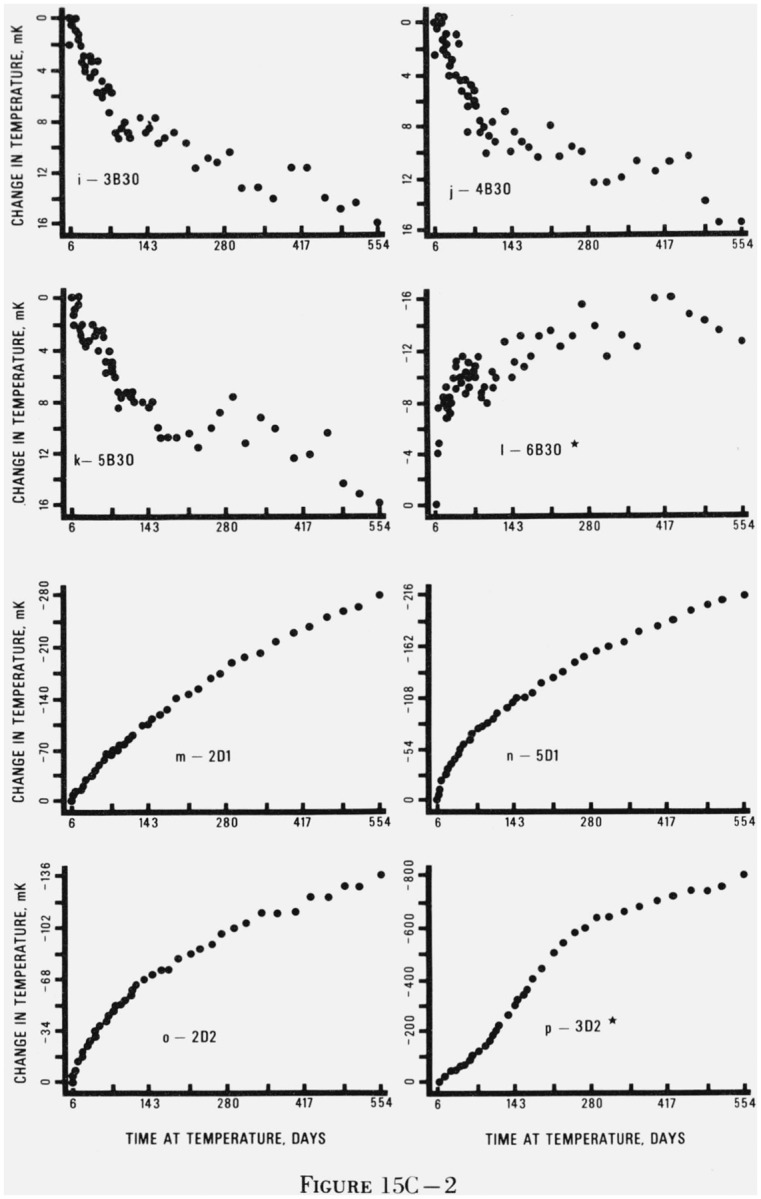
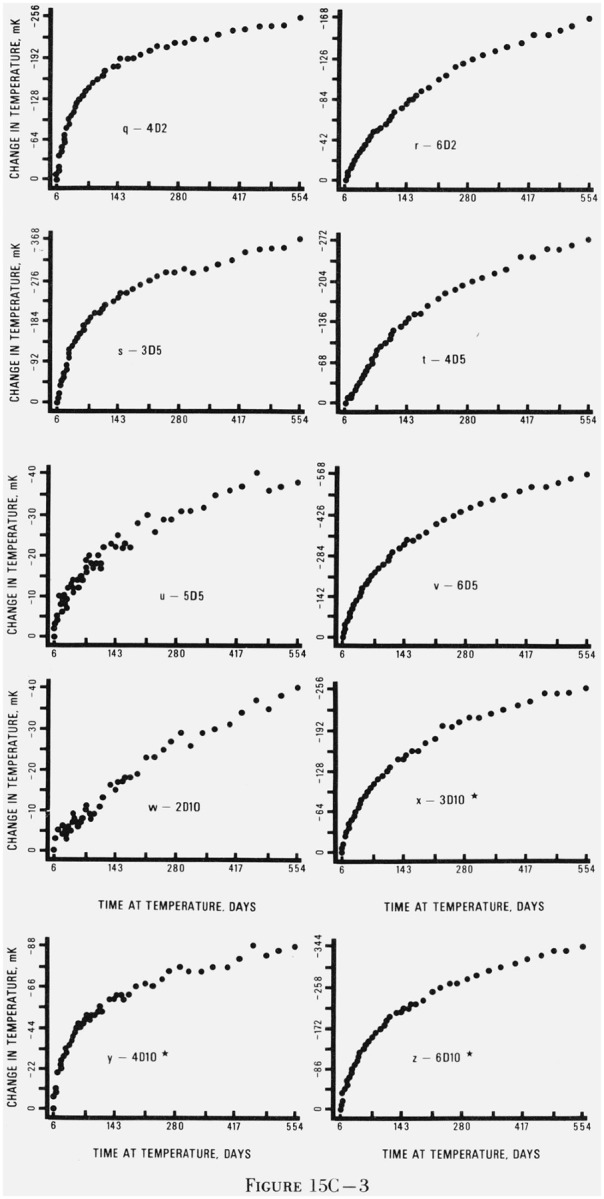
The asterisks indicate that not all of the five replicates of each thermistor type had the general behavior pattern shown in this figure. The thermistors are coded with a number denoting the manufacturer, a B or D for bead or disc, and a number denoting the resistance in kilohms at 25 °C. Figures 15Aa–15Av are for thermistors held at 0 °C, figures 15Ba–15Bα are for thermistors held at 30 °C, and figures 15Ca–15Cz are for thermistors held at 60 °C.
The electrical noise in the a.c. resistance bridge measurements reduced our ability to measure the bath temperature. The noise was equivalent to as much as ±1 mK and was superimposed on oscillations of the bath temperature of ±1 mK over a period of a minute. The resistance of the PRT was recorded only after the operator had watched a chart recorder tracing of the a.c. resistance bridge signal for a few minutes in order to “integrate” the noisy signal.
The errors which were variable in nature contributed most heavily to the scatter in the results shown in figures 15B and 15C. The data on thermistors held at 0 °C were subjected to two additional sources of error–the water in the bath and the use of the d.c. resistance bridge for measuring the resistances of the thermistors (as stated in section 2.2, the d.c. resistance bridge is not as accurate as the current comparator). On the other hand, none of the thermistor resistance measurements at 0 °C involved using a 100 Ω standard resistor.
4. Analysis of Data
The primary purpose of the analysis was to obtain a drift rate for each of the 405 thermistors (135 per bath) and then check for patterns in drift rate as a function of thermistor type, resistance, manufacturer, ageing temperature, and position in the bath. In the discussion which follows, we will describe the analysis of the data from the thermistors in the 30 °C bath with the understanding that the data generated at 0 and 60 °C were treated in the same manner. As mentioned above, each thermistor resistance measurement had associated with it a PRT measurement, the date, the measuring current through the thermistor, and the value of the standard resistor (or bridge range in the case of the direct-reading bridge). These were recorded in the data file. There was a total of over 60,000 measurements of thermistors and PRTs in the data file in addition to the auxiliary data.
Although the analysis was done with a computer, a large amount of work had to be done by treating the thermistors individually and making judgements about individual data points. Some thermistors were not analyzed because of problems that they developed during the measurements. Five thermistors which were maintained at 0 °C were eliminated because there were ten or more sets in which no data were obtained for them. It was decided that this left too many gaps in the data for these thermistors to be considered. Twenty-three thermistors (five at 60 °C and 18 at 0 °C) physically failed during the study because of broken lead wires near the thermistor or because of failure of the oxide-silver-solder junction and so were not analyzed. Thus, the resultant number of thermistors analyzed for each ageing temperature was 112 thermistors at °C, 135 thermistors at 30 °C, and 130 thermistors at 60 °C.
The computer program required that data for a given thermistor appear in each set. Consequently, if there were no data for a thermistor in a given set, the data which were used for that thermistor in that set were obtained from either the preceding or the succeeding set. Normally, data from the preceding set were chosen. Only a small amount of data was involved in augmenting the data file in this fashion except for results obtained at 0 °C where, because of the problems with the bath, several thermistors could not always be measured and this resulted in considerable amounts of missing data.
Following the organization of the data file, the thermistor resistance measurements were converted to ohms either by multiplying them by the value of the appropriate standard resistor or by averaging, depending on the measuring system used. Corrections were made for bath temperature fluctuations by the following algorithm; computation of an average bath temperature over all days at a given temperature for each thermistor; calculation of the deviation from that temperature for each day; conversion of the temperature deviation into a resistance deviation (using the manufacturer’s temperature coefficient α where known); and correction of the measured resistance by that amount. Where α was not known, it was calculated from the relation α = −β/T2.
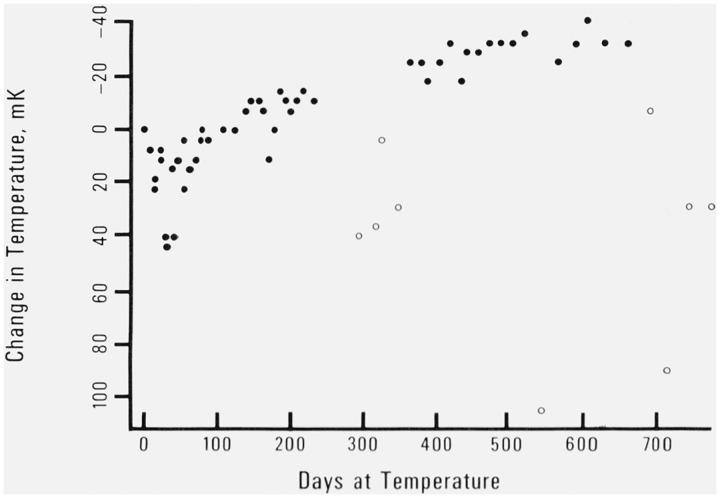
The corrected thermistor resistances were next graphed as a function of elapsed number of days at temperature. Outlying measurements could thus be easily detected and grossly outlying points were removed on the basis of these graphs. This was generally a straightforward procedure except for the thermistors in the 0 °C bath whose results had considerable scatter. This made it difficult to differentiate outliers from valid data. Our criterion was that the removal of a point should not change the “true” drift rate of the thermistor. This implied, for example, that data near the end-points of the graph were more likely to be removed if they deviated significantly because they intrinsically carried greater weight in the usual least-squares fitting procedure. Mid-points were not as likely to be removed unless they were quite distinct from the bulk of the data. Figure 7 shows a typical example of the data points likely to be removed as outliers. Table 5 gives the number of data points removed from the results for each temperature as a percentage of the total number of points taken at that temperature. Finally, certain sets were removed because the data were generally outlying for most of the thermistors, possibly because of an initial release of strain. Data from elapsed days one and two were removed from the 30 and 60 °C data files for that reason. Data from elapsed days one, seven, and twenty-four were removed from the 0 °C data file because so few measurements were made on those days.
Figure 7. Typical thermistor data at 0 °C.
The open circles (○) are data points which were not included in the analysis because they were outliers.
Table 5.
Number of data points removed from data file
| No. Data Points | No. Data Points Removed | Temperature | % Data Points Removed |
|---|---|---|---|
| 6832 | 291 | 0°C | 4 |
| 9180 | 76 | 30 °C | 1 |
| 8840 | 14 | 60 °C | 0.2 |
The drift rate calculated from the results is a least-squares estimate for the slope in the linear fit of apparent temperature change as a function of elapsed days. Drift rates in ohms per day were calculated and then converted to millikelvins per day using the manufacturers’ values for α.
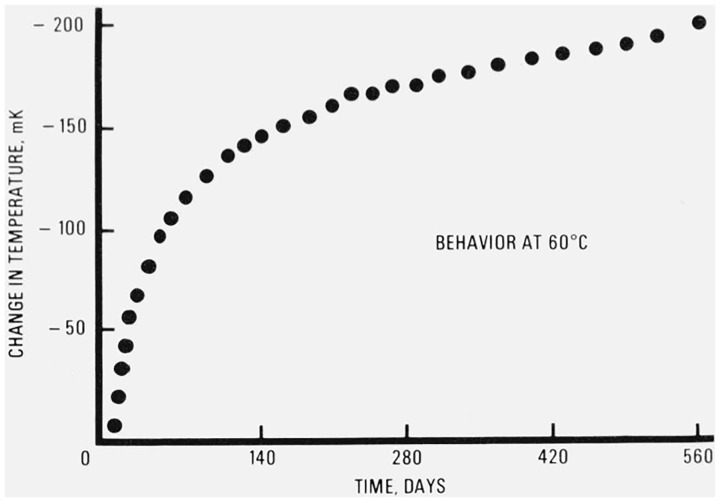
The non-linear drift of the discs at 60 °C was such that a linear fit of the data was not appropriate (see fig. 8). In fact, the data obeyed an exponential relationship. It was felt, however, that a linear fit of the drift might be more useful than an exponential one, if the drift is easily predictable after a long time at a given temperature. Therefore, a second drift was calculated for each thermistor from the data for sets 55–70 (elapsed days 174 to 554). Set 55 was the time at which most of the discs had completed their rapid rise. Both groups of drift rates are presented in table 6.
Figure 8.
Typical exponential behavior of a disc at 60 °C.
Table 6.
Thermistor drift rates, mk/100d
| 0°C | 30 °C | |||||||||||||||
|---|---|---|---|---|---|---|---|---|---|---|---|---|---|---|---|---|
| Bead Resistance at 25°C, k Ω | Disc Resistance at 25°C, k Ω | Bead Resistance at 25 °C, k Ω | Disc Resistance at 25 °C, k Ω | |||||||||||||
| 2 | 10 | 15 | 30 | 1 | 2 | 5 | 10 | 2 | 10 | 15 | 30 | 1 | 2 | 5 | 10 | |
| Manufacturer 1 | −0 | 0 | −3 | −0 | 2 | −1 | ||||||||||
| 2 | 0 | −6 | −0 | −0 | −0 | |||||||||||
| 0 | 0 | −0 | −0 | −1 | ||||||||||||
| −2 | 0 | −0 | −0 | −0 | ||||||||||||
| −1 | −0 | 0 | −1 | |||||||||||||
| Manufacturer 2 | −1 | −3 | −12 | − 6 | −3 | −0 | ||||||||||
| −2 | −5 | −16 | − 3 | −3 | −0 | |||||||||||
| −0 | −38 | −13 | −3 | −3 | −1 | |||||||||||
| −1 | −2 | −15 | −3 | −4 | −0 | |||||||||||
| 8 | −7 | −3 | −3 | −1 | ||||||||||||
| Manufacturer 3 | 1 | 0 | 1 | −2 | −0 | 0 | −0 | −34 | −15 | −13 | ||||||
| −0 | 1 | −3 | −10 | −0 | 0 | 1 | −127 | −14 | −13 | |||||||
| −1 | 0 | 0 | −6 | −0 | 1 | 0 | −107 | −38 | −20 | |||||||
| −1 | 1 | 1 | −9 | −0 | 0 | −0 | −12 | −20 | −19 | |||||||
| 1 | 1 | −5 | −10 | −0 | 0 | −o | −10 | −16 | −16 | |||||||
| Manufacturer 4 | −0 | 0 | −1 | −10 | 0 | −10 | −0 | 0 | 0 | −41 | −8 | −10 | ||||
| −1 | 1 | 2 | −8 | −2 | −10 | −0 | 0 | −o | −44 | − 7 | −10 | |||||
| 1 | 2 | −0 | −8 | −0 | −17 | −0 | −0 | −0 | −43 | −7 | −10 | |||||
| 1 | 1 | 3 | −4 | 1 | −0 | 0 | −0 | −42 | −8 | −9 | ||||||
| 1 | 1 | −9 | −o | −0 | −0 | −0 | −38 | −9 | −11 | |||||||
| Manufacturer 5 | 0 | 1 | −23 | −6 | −0 | −2 | −0 | −0 | −15 | −3 | ||||||
| −1 | 1 | −2 | −6 | −1 | −1 | 0 | −1 | − 7 | −3 | |||||||
| 1 | 0 | 1 | −4 | −2 | −1 | 0 | −0 | −8 | −3 | |||||||
| −1 | 2 | −5 | −1 | −0 | −35 | −o | −10 | −4 | ||||||||
| 4 | 1 | −8 | −0 | −1 | −0 | −1 | −7 | −3 | ||||||||
| Manufacturer 6 | 0 | −21 | −16 | −16 | −2 | −8 | −9 | −15 | ||||||||
| 3 | −31 − | −11 | − 7 | −2 | −8 | −14 | −13 | |||||||||
| 1 | −29 | −11 | −2 | −6 | −13 | −16 | ||||||||||
| −5 | −25 | −13 | −2 | −8 | −13 | −12 | ||||||||||
| 0 | −46 | −8 | −1 | −6 | −13 | −16 | ||||||||||
| 0 | 0.5 | 1.0 | 0 | −3.0 | −9.5 | −1.0 | −10.0 | 0 | 0 | 0 | 0 | −6.5 | 9.0 | −9.0 | −11.5 | |
| Mean | 0.2 | 0.6 | 1.0 | −3.5 | −2.5 | −17.0 | −4.3 | −10.7 | −0.2 | −2.1 | 0 | −0.5 | −6.5 | −27.5 | −11.0 | −10.2 |
| Manufacturer 1 | −0 | 1 | 1 | 0 | 0 | 1 | ||||||||||
| −0 | 1 | 0 | 0 | 1 | 0 | |||||||||||
| −0 | 1 | 0 | 0 | 0 | 0 | |||||||||||
| 0 | 1 | −1 | 0 | 0 | −1 | |||||||||||
| −1 | 1 | −0 | 1 | |||||||||||||
| Manufacturer 2 | −46 | −25 | −7 | −38 | −14 | − 5 | ||||||||||
| −53 | −22 | −5 | −42 | −12 | −3 | |||||||||||
| −46 | −25 | −6 | −36 | −l4 | − 5 | |||||||||||
| −54 | −20 | −8 | −40 | −11 | −6 | |||||||||||
| −57 | −21 | −7 | −44 | −13 | −6 | |||||||||||
| Manufacturer 3 | 1 | 2 | 3 | −64 | −47 | −35 | 0 | 1 | 2 | −72 | −21 | −17 | ||||
| 0 | 1 | 4 | −514 | −54 | −41 | 1 | 0 | 2 | −89 | −23 | −21 | |||||
| 0 | 3 | 2 | −169 | −44 | −36 | −0 | 2 | 1 | −87 | −20 | −13 | |||||
| 1 | −27 | 2 | −471 | −44 | −101 | 1 | −13 | 1 | −807 | −17 | −72 | |||||
| 0 | 2 | 1 | −43 | −41 | 0 | 1 | 1 | −17 | −20 | |||||||
| Manufacturer 4 | 0 | 2 | 2 | −38 | −49 | −9 | 0 | 1 | 1 | −14 | −27 | −6 | ||||
| 1 | 2 | 2 | −33 | −49 | −12 | 1 | 1 | 1 | −12 | −27 | −6 | |||||
| 0 | 1 | 2 | −44 | −50 | −11 | 1 | 1 | 1 | −18 | −26 | −4 | |||||
| 0 | 2 | 2 | −39 | −48 | −20 | −0 | 1 | 1 | −13 | −26 | −17 | |||||
| 2 | −36 | −53 | 1 | −12 | −30 | |||||||||||
| Manufacturer 5 | 1 | 2 | 1 | −37 | −6 | 1 | 2 | 0 | −25 | −3 | ||||||
| 0 | 3 | 3 | −39 | −11 | 0 | 2 | 1 | −30 | −6 | |||||||
| 0 | 2 | 3 | −21 | −10 | 0 | 1 | 1 | −13 | −8 | |||||||
| −3 | 2 | 2 | −27 | −6 | −0 | 1 | 1 | −15 | −3 | |||||||
| −0 | 2 | 3 | −29 | −5 | 0 | 1 | 1 | −22 | −2 | |||||||
| Manufacturer 6 | −1 | −28 | −87 | −48 | −0 | −18 | −43 | −24 | ||||||||
| −1 | −35 | −88 | −38 | −0 | −21 | −44 | −20 | |||||||||
| −1 | −29 | −91 | −41 | −0 | −20 | −46 | −22 | |||||||||
| −1 | −32 | −86 | −51 | −o | −21 | −45 | −25 | |||||||||
| −2 | −31 | −90 | −58 | −1 | −18 | −48 | −24 | |||||||||
| 0 | 2.0 | 2.0 | 2.0 | −42.5 | −32.0 | −48.5 | −35.0 | 0 | 1.0 | 1.0 | 1.0 | −30.5 | −18.0 | −24.5 | −17.0 | |
| Mean | 0 | −0.2 | 1.8 | 1.1 | −40.9 | −88.2 | −48.0 | −30.3 | 0.3 | 0 | 1.0 | 0.6 | −30.5 | −67.7 | −23.8 | −16.6 |
The final step in the analysis was to check for correlations between drift rate and construction (bead or disc), resistance value, manufacturer, temperature, and bath position.
5. Discussion of Results
5.1. Ageing
No correlation was found between thermistor drift rate and position in the bath except for a small dependency on bath row at 30 °C. This was not apparent at 0 or 60 °C.
Table 6 and figure 15 together give a good picture of the behavior of the thermistors at 0, 30, and 60 °C. Table 6 gives an idea of how much each thermistor changed during the course of the study and figure 15 shows how that change took place for most of the thermistors.
Table 6 is the principal summary table of this manuscript. It contains information regarding the effect on drift rate of the following three controlled factors:
temperature (0, 30, and 60 °C)
thermistor type (bead or disc)
resistance value (four levels for each bead/disc type)
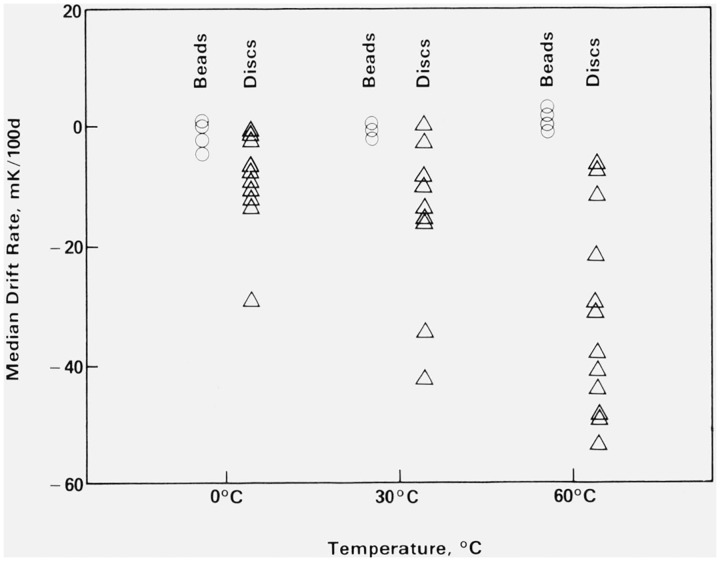
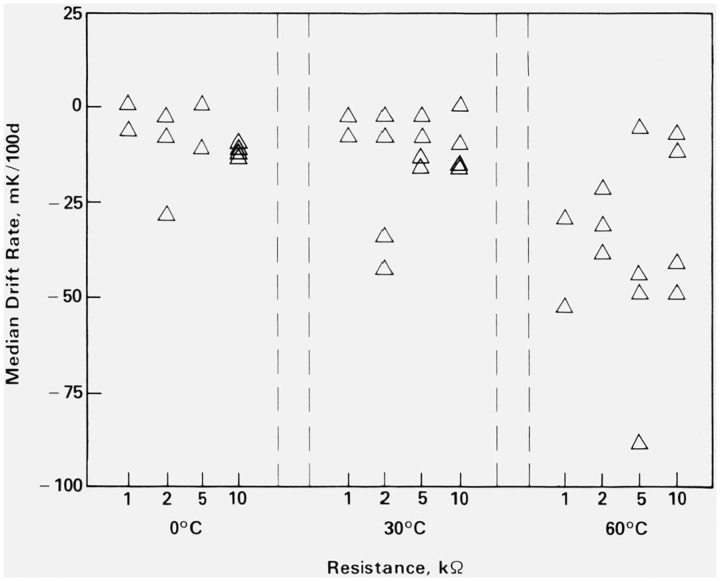
This table gives the drift rates for all of the thermistors in the study in units of millikelvin per 100 days, mK/100 d. Each row contains the results for thermistors from a single manufacturer and each column contains the results for thermistors of a single resistance value. At the bottom of each column are given the median and the mean drift rates for the column. Two features of table 6 should be noted. The first is the large difference between the over-all drift rates of the beads and of the discs. This can also be seen in figure 9. The second feature is the close agreement of the drift rates within each group of five discs.
Figure 9. Median drift rate versus ageing temperature.
The beads and discs have been separated for clarity. ○ = bead thermistor and △ = disc thermistor.
The information contained in table 6 is amplified in figures 9–14. Each point on these figures represents the median drift rate of the replicated thermistors in each bath. Points are denoted with either a ○ (for bead thermistors) or a Δ (for discs). For better resolution of the discs, a median drift rate of −320 mK/100 days has been omitted from all the disc figures. This point was the median of the four 3D2 thermistors which were held at 60 °C.
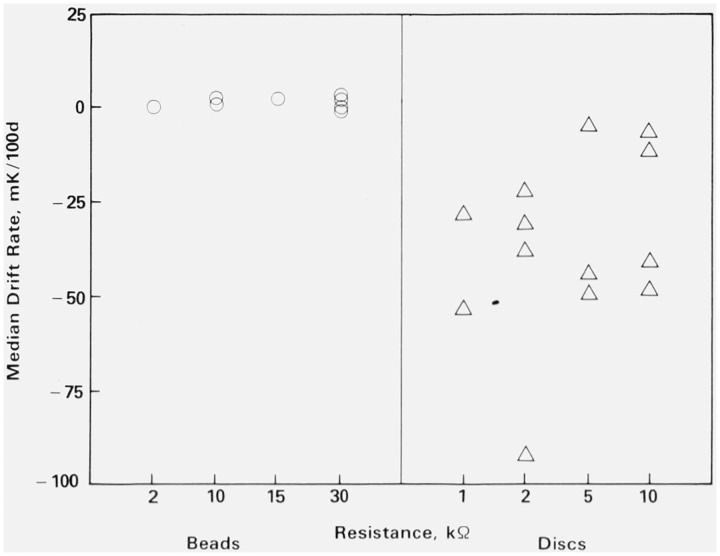
Figure 14. Median drift rate versus resistance at 60 °C.
Note that the resistance values are not in order but are arranged so that the beads and discs are segregated. ○ = bead and △ = disc.
Figure 9 summarizes the effect of temperature on drift rate. The beads are virtually unaffected while two phenomena occur for the discs. The first is the tendency toward a larger magnitude of drift rate as the temperature increases and the second is the increasing variability within the discs with increasing temperature. Note also that the bead drift rates are all very small.
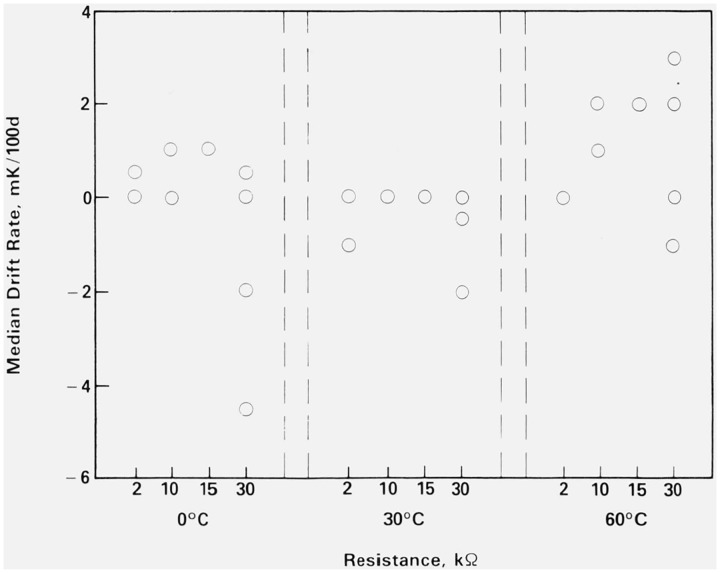
The increasing variability in the discs drift rates and the large difference between the bead and disc drift rates in general are more clearly seen in figures 10 and 11 (fig. 10 presents only beads and fig. 11 presents only discs). Note the different vertical scales for these two figures. The horizontal axes are resistance-temperature combinations, i.e., the four levels of resistance have been separated at each temperature. As noted in figure 9, there is virtually no temperature effect on the beads. The most noteworthy point is the larger variability among the 30 kΩ beads at all three temperatures.
Figure 10. Median drift rates of the beads versus resistance and temperature.
The four resistance values have been separated at each temperature.
Figure 11. Median drift rates of the discs versus resistance and temperature.
The four resistance values have been separated at each temperature.
The disc drift rates increased in magnitude very slightly between 0 and 30 °C. At 60 °C, both the beads and discs changed much more noticeably (although the change in the bead drift rates was still small). Possible mechanisms for this are discussed in section 5.1.3.
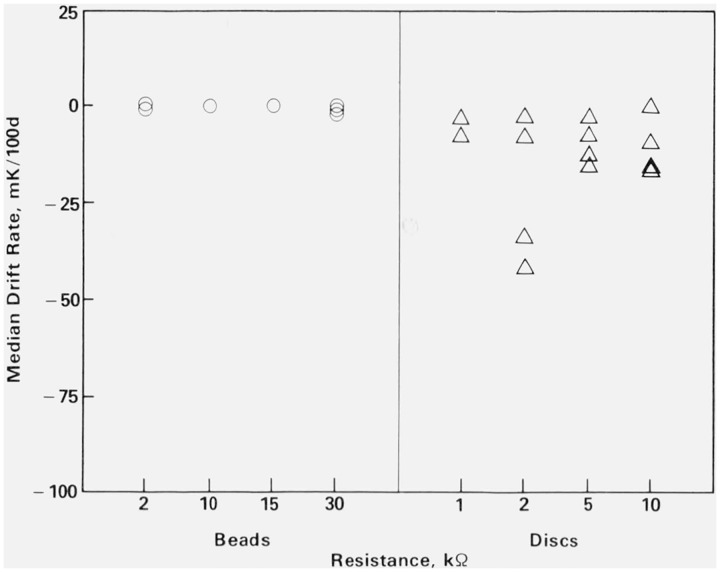
Figures 12, 13, and 14 summarize the effect of resistance value. These three figures show median drift rate versus resistance value at the three temperatures. The left half of each figure shows the drift rates for the beads and the right half shows the drift rates for the discs. The primary question here is whether earlier conclusions regarding the magnitude and variability of the drift rates are true for all, or only some, resistance values. Close scrutiny of figures 12 (0 °C), 13 (30 °C), and 14 (60 °C) supports our conclusion for all resistance values. The effect of the resistance value of a thermistor on its drift rate is small compared to whether it is a bead or disc and the temperature at which it is held.
Figure 12. Median drift rate versus resistance at 0 °C.
Note that the resistance values are not in order but are arranged so that the beads and discs have been segregated. ○ = bead and △ = disc.
Figure 13. Median drift rate versus resistance at 30 °C.
Note that the resistance values are not in order but are arranged so that the beads and discs are segregated. ○ = bead and △ = disc.
These same conclusions will be applicable to figure 15 but in this figure, the focus will be on behavior patterns (such as the linearity of the drift) instead of on numerical results.
Figure 15 gives representative plots of thermistor resistance versus time at temperature for each of the 27 types of thermistors at each of the three temperatures. Plots for all the thermistors were examined and a thermistor which was representative of its type at a given temperature was selected for inclusion in figure 15. For most cases, the general behavior (change in resistance with time) of the selected thermistor is quite representative of its replicates at the same temperature. Although all of the replicates changed qualitatively with the same pattern, they changed by different amounts. For example, in figure 15As the total change is −92 mK but the other four replicates changed by −16, −216, −32, and −96 mK. Looking at the graphs, one could image the same set of points with five different scales on the vertical axis. An indication of the variation within each type of thermistor at each temperature may be seen in the drift rates given in table 6.
For many of the 27 types of thermistors, there were individuals within the group of replicates which did not follow the general behavior pattern. For these cases, marked with an asterisk, the behavior shown in figure 15 is characteristic of the majority of the replicates. There were a few types of thermistors for which no single thermistor was typical. In these cases, no graph appears in figure 15.
Perhaps the two most striking pieces of information in figure 15 are (1) the very small drift of the beads and (2) the initial rapid decrease in apparent temperature for the discs. The discs did not decrease sharply initially at 30 °C but the pattern at 60 °C was particularly pronounced.
In figure 15A, the degradation of the bath’s performance and the polarization problem are obvious. There is a slight gap in each graph at elapsed day 232 when the data collection was interrupted for two months.
5.1.1. Thermistors Aged at 0 °C.
The plots for 22 of the 27 types of thermistors held at 0 °C are given in figure 15A. All of the 3D2 and 3D5 thermistors failed during the test, and no single plot could characterize the 4B2, 3B30, or 6B30 thermistors. The bead thermistors (fig. 15Aa–15Aj) exhibit essentially no drift in indicated temperature with time. There is little correlation between drift rate and resistance value but, as seen in figure 10, the 30 kΩ beads had slightly larger drift rates than any of the others. Because the beads had such small drift rates, it is difficult to see any correlation between drift rate and manufacturer.
The discs show definite negative drift rates with some indication of exponential behavior. The initial rapid decrease in indicated temperature lasted from 200 to 500 days depending on the particular type of disc. The 1 and 5 kΩ discs are unusual in that they show none of the exponential behavior.
There is little correlation between manufacturer and drift rate except that the discs from manufacturer 6 had slightly larger drift rates than the discs of the same resistance value from the other manufacturers.
For both beads and discs, the effect of the accumulated water in the bath was often noticeable but not predictable. A few of the thermistors stabilized when the water was removed (e.g., 5B30, fig. 15Aj). More often, the thermistor was less stable after the removal of the water (e.g., 4D5, fig. 15Ap). Most of the drift rates were not affected by the removal of the water.
5.1.2. Thermistors Aged at 30 °C
As shown in figure 15B, the thermistors held at 30 °C behaved much like those held at 0 and 60 °C. At 30 °C, the beads had very small drift rates, and the discs had larger negative drift rates and showed a tendency toward the exponential behavior seen at 60 °C.
Some of the beads showed the small initial increase in apparent temperature which was also evident in the beads held at 60 °C. The increases were smaller, however, than they were for the corresponding beads held at 60 °C. This pattern did not appear in the beads held at 0 °C. The drift rates could not be correlated with resistance value. There was even less difference among the beads from different manufacturers at 30 °C than there had been at 0 °C but this may be due to the problems encountered with the measurements of the thermistors in the 0 °C bath.
The discs generally behaved at 30 °C as did those held at 0 and 60 °C with the exception of the 2D10 discs (figure 15Bx). The drifts of the discs held at 30 °C were the most linear of the disc drifts in the study and the drift rates generally fell between those of the corresponding discs held at 0 and 60 °C.
There is more differentiation among manufacturers in the discs held at 30 °C than there was among those held at 0 °C. The median drift rates for all the discs from manufacturers 2 were the smallest of all the discs at 30 °C. The discs from manufacturer 5 and 6 also had uniformly small median drift rates. The median drift rates for the discs from manufacturers 2 and 6 were smaller than they were at 0 °C, contrary to the general trend of the data.
The 3D2 series of discs (figure 15Bg) had the largest drift rates of all the thermistors at 30 and 60 °C and the greatest likelihood of physical failure. The 3D2 discs were the smallest discs in the study and so were more susceptible to problems at the silver-solder interface.
5.1.3. Thermistors Aged at 60 °C
Twenty-six of the 27 thermistor types held at 60 °C are shown in figure 15C. There was no single plot characteristic of the 5B2 thermistors so none is given. The thermistors held at 60 °C showed the largest effects of ageing. This is not surprising because any mechanism involving the motion of charge carriers in the thermistor, strain relaxation, or migration of ions in the lead contacts would be expected to proceed faster at a higher temperature. The general behavior of the beads at 60 °C was the same as it was at 0 and 30 °C.
The beads, with the exception of 6B30 (fig. 15C1) had small positive drift rates or they had no observable drift. There was a small initial rise in indicated temperature for the first 100–150 days followed by a slower rise for the remainder of the study. There was no significant difference among beads from different manufacturers.
The discs showed a large initial decrease in indicated temperature followed by a more gradual decrease. The initial decrease lasted 150–200 days. The poor performance of the 2 kΩ discs is due, for the most part, to the large drift rates exhibited by the 3D2 group (fig. 15Cp). The drift rates at 60 °C were generally larger than those at 0 and 30 °C even when the first 54 sets of data were eliminated from the 60 °C data file. Except for the 3D2 group, the average drift rates were similar for all the disc resistance values.
The results at 60 °C, as in the 30 °C data, show differences in drift rates between discs of the same resistance value from different manufacturers which are much larger than the range of drift rates for each group of replicates (i.e., thermistors with the same resistance value and manufacturer) in table 6. Overall, the discs from manufacturer 5 had the smallest average drift rates. The drift rates of the discs from manufacturers 2 and 4 were similar but were slightly larger than those of the discs from manufacturer 5. The discs from manufacturer 6 had drift rates somewhat larger than those from manufacturers 2, 4, and 5, and the discs from manufacturer 3 had the poorest performance (because of the 3D2 group).
The thermistors at 60 °C were the only ones to show any dramatic ageing effects. This was not surprising in view of the reasons given above. The difference in behavior between the beads and discs was noticeable regardless of the bath temperature. The temperature drift of the beads was small, positive and linear with time and showed very little indication of exponential behavior while that of the discs was negative and exponential. There are two possible reasons for these different behaviors. Firstly, the beads are aged during manufacture at much higher temperatures than the discs, which are limited to 150 °C. This should lead to greater relaxation of manufacture strains in the beads before our ageing experiment began. Secondly, the different construction techniques used for beads and discs probably introduce different amounts of strain. On the basis of our data, one might judge that only minor strains are induced in the beads by the glass coating or by any change in lead wire diameter due to thermal expansion or contraction. The increasing resistance of the discs may be due to migration of the silver into the solder and the resulting increase in contact resistance between the leads and the thermistor [8]. Work has been reported on the diffusion of silver in tin and lead [9, 10, 11] and on the diffusion of tin in silver [12]. Silver has a low solubility in tin and lead (0.01 to 0.1%) but it has very high diffusion rates in those two metals, much higher than for self diffusion (10−24 cm2 sec−1 at 150 °C) [9, 10, 12]. At 150 °C, the diffusivity of silver in tin is 10−10 cm2 sec−1 along the a-axis and 10−8 cm2 sec−1 along the c-axis [9]. The diffusivity of silver in lead is 10−6 cm2 sec−1 [10]. Silver diffuses through tin and lead lattices interstitially [13]. Milgram’s work on solder and screen-printed silver films indicates that tin diffuses through silver along grain boundaries and through pores [14]. While these results imply an uncertainty as to which component of the silver-solder interface is diffusing, it is clear that fairly rapid diffusion can take place. We have not investigated this problem but several thermistor manufacturers have confirmed that the silver-solder interface is affected over long times by diffusion.
Thermistors are sensitive to oxidation and this could be a source of trouble for discs. Only those discs from manufacturer 2 were encapsulated in an epoxy. It should be noted, however, that although these discs were very stable so were those from manufacturer 5 which were not encapsulated.
5.2. Reliability
The data concerning the reliability of the thermistors are much more qualitative than are the data about drift rates. Most of the results were obtained by visual inspection of the graphs of resistance versus time. The thermistors at 30 °C had all stabilized (i.e., were drifting linearly) after two months at temperature and those in the 60 °C bath had firmly established their behavior patterns after three months.
Many of the thermistors at 0 °C had well-established resistance-time relationships by elapsed day 100. The water and “corrosion” problems in the bath affected the behavior patterns between days 232 and 294. Changes in behavior during those 62 days cannot be separated from the effects of accumulated water and particles and the effects of cleaning the thermistors.
With the exception of the 3D2 and 3D5 thermistors, which tended to fail at the oxide-silver-solder interface, the thermistors proved to be mechanically sturdy.
6. Conclusions
It would appear from table 6 that each manufacturer is producing very uniform lots of thermistors for a given resistance value. This was especially evident at 30 and 60 °C where the groups of replicates had very similar drift rates. This raises the possibility of selectively testing thermistors instead of testing the entire lot in question. Of course, there is always the possibility of an outlier but we found only ten in the 377 thermistors which were evaluated.
It is clear from the data that thermistors to be used in accurate work where drift cannot be tolerated must be aged by either the user or the manufacturer. This is especially true of discs. Thermistors receive some ageing at a high temperature as part of the normal manufacturing process, but accurate work may require additional ageing for as long as several months.
In light of the small drift rates exhibited by the beads, it seems appropriate to review the advantages of beads and discs. Beads may be made small in size, they respond rapidly to temperature changes, and they can be stable (a very important feature). They cannot easily be made interchangeable, however, without using special selection techniques and the bead-in-glass probes have a relatively large mass of glass. Some manufacturers have reduced the effect of the glass by placing the bead in the extreme tip of the glass sleeve. The so-called “bare” beads are fragile. These beads are coated with a very thin layer of glass which is much more subject to cracking than the glass sleeve on the models we evaluated.
The discs are usually larger than the beads and therefore respond more slowly to temperature changes. The flat silvered faces of the discs may provide good thermal contact, however. The discs can, in general, dissipate more heat than the beads before self-heating becomes a problem. Finally, discs may be made interchangeable by the manufacturer by slightly changing the shape of the discs to alter their resistance.
Acknowledgments
We are grateful to the following manufacturers for their freely given advice and help: Fenwal Electronics, Inc.; Gulton Industries, Inc.; Keystone Carbon Company; Thermometrics, Inc.; Victory Engineering Corporation; and Yellow Springs Instrument Company.
Footnotes
Figures in brackets indicate literature references at the end of this paper.
7. References
- [1].Bennett A. S., The Calibration of Thermistors over the Temperature Range 0–30 °C, Deep-Sea Research 19, 157 (1972). [Google Scholar]
- [2].Bosson G., Gutmann F., and Simmons L. M., A Relationship Between Resistance and Temperature of Thermistors, J. Appl. Phys. 21, 1267 (1950). [Google Scholar]
- [3].Steinhart J. S., and Hart S. R., Calibration Curves for Thermistors, Deep-Sea Research 15, 497 (1968). [Google Scholar]
- [4].Trolander H. W., Case D. A., and Harruff R. W., Reproducibility, Stability and Linearization of Thermistor Resistance Thermometers, Temperature, Its Measurement and Control in Science and Industry, 4, Part 2, 997 (Instrument Society of America, Pittsburgh, 1972). [Google Scholar]
- [5].Riddle J. L., Furukawa G. T., and Plumb H. H., Platinum Resistance Thermometry, Nat. Bur. Stand. (U.S.), Monogr. 126, 129 pages (April, 1972). [Google Scholar]
- [6].Cutkosky R. D., An A–C Resistance-Thermometer Bridge, J. Res. Nat. Bur. Std. (U.S.), 74C, 15 (Jan-Jun, 1970). [Google Scholar]
- [7].Kusters N. L., MacMartin M. P., and Berry R. J., Resistance Thermometry with the Direct Current Comparator, Temperature, Its Measurement and Control in Science and Industry, 4, Part 2, 1477 (Instrument Society of America, Pittsburgh, 1972). [Google Scholar]
- [8].Semiconducting Temperature Sensors and Their Applications, Sachse H. B., 206 (John Wiley and Sons, Inc., New York, 1975). [Google Scholar]
- [9].Dyson B. F., Diffusion of Gold and Silver in Tin Single Crystals, J. Appl. Phys. 37, 2375 (1966). [Google Scholar]
- [10].Dyson B. F., Anthony T., and Turnbull D., Interstitial Diffusion of Copper and Silver in Lead, J. Appl. Phys. 37, 2370 (1966). [Google Scholar]
- [11].Norwick A. S., Anomalies in Metallic Diffusion: Rapid Diffusion of the Noble Metals in Pb, Sn, In, and T1, Comments on Solid State Physics 1, 140(1968). [Google Scholar]
- [12].Metals Reference Book, Smithells C. J., ed, 5th edition, 860 (Butterworths, London: 1976). [Google Scholar]
- [13].Anthony T. R., Interstitial Metal Impurity Diffusion in Metals, Vacancies and Interstitials in Metals, Proceedings of the International Conference, Jülich, Germany, Sept. 23–28, 1968, Seeger A., Schumacher D., Schilling W., and Diehl J. eds, 935 (North Holland Publishing Co., Amsterdam, 1970). [Google Scholar]
- [14].Milgram A. A., Influence of Metallic Diffusion on the Adhesion of Screen-Printed Silver Films, Metall. Trans. 1, 695 (1970). [Google Scholar]


