Background
Follow-up with computed tomographic angiography is recommended after endovascular aneurysm repair, exposing patients to significant levels of radiation and iodine contrast medium. Dual-energy computed tomography allows virtual noncontrast (VNC) images to be reconstructed from contrast-enhanced images using a software algorithm. If the VNC images are a good-enough approximation of true noncontrast (TNC) images, a reduction in radiation dose can be ensured through omitting a TNC scan.
Purpose
To compare image quality of VNC images reconstructed from arterial phase and venous phase dual-energy computed tomographic angiography to TNC images and to assess which one is more suitable to replace TNC images.
Methods
Sixty-three consecutive patients were examined using a dual-energy computed tomography as elective follow-up after endovascular aneurysm repair. The examination protocol included 1 unenhanced and 2 contrast-enhanced scans (80 kV/Sn140 kV) of the aorta. Virtual noncontrast data sets were reconstructed from the arterial (A-VNC) and venous (V-VNC) phase scans, respectively. Mean attenuation and image noise were measured for TNC, A-VNC, and V-VNC images within regions of interest at 2 levels in the aorta, the liver, retroperitoneal fat, and psoas muscle. Subjective image quality was assessed on a 4-point scale by 2 blinded readers.
Results
The differences between A-VNC and TNC, and between A-VNC and V-VNC, were substantial aorta at the level of diaphragm and aorta at the level of renal arteries. The difference between V-VNC and TNC was, on the other hand, very small and not statistically significant for the renal artery aorta. For liver, fat, and muscle tissue, there were significant differences between both A-VNC and V-VNC compared with TNC, but findings were similar between A-VNC and V-VNC.
Conclusions
Virtual noncontrast images based on venous-phase scans appear to be a more accurate representation of TNC scans than VNC images based on arterial-phase scans.
Key Words: attenuation values, computed tomography angiography of aorta, dual-energy computed tomography, virtual noncontrast
Computed tomographic angiography (CTA) is most commonly used for imaging of acute and chronic aortic disease. Endovascular aneurysm repair (EVAR) has become an important alternative to open aneurysm surgery, but typically requires lifelong follow-up by CTA to diagnose complications such as endoleaks or stent graft migrations.1–3 A variety of CTA examination protocols, including 2-phase (unenhanced and split-bolus mixed arterial and venous phase) and 3-phase (unenhanced, early arterial and venous phase), have been employed by different institutions.4 Regardless of which imaging protocol is used, patients are exposed to significant levels of radiation.
Dual-energy computed tomography (DECT) utilizes different attenuation properties to discriminate between different materials or tissues. The dual-energy (DE) principle was invented in the 1970s,5,6 but its clinical applications were not technically achievable at that time. The recent development of dual-source computed tomography (CT) machines allows the acquisition of 2 nearly simultaneous data sets at different tube potentials within a single breath-hold.7,8 By using postprocessing algorithms, an “iodine map” can be generated, and this in turn can be subtracted from the contrast-enhanced images, thereby producing virtual noncontrast (VNC) images. The DE technique allows a reduction in both the iodine contrast medium dose and the radiation dose.9–11
Several studies have shown that VNC images are a comparable and acceptable alternative for true noncontrast (TNC) images.12–15 However, a previous study comparing TNC and VNC images constructed from arterial-phase CTA data demonstrated significantly higher attenuation values in the VNC images, raising questions as to how appropriate VNC images are as a replacement for TNC images.16 To the authors' knowledge, there have not yet been any published reports on the attenuation values in VNC images constructed from venous-phase CTA data.
The main purpose of this study is to investigate whether VNC images derived from venous-phase CTA data may be a better approximation of TNC images than VNC images derived from arterial-phase CTA data. The secondary purpose is to evaluate the attenuation values of different tissues using VNC images compared with TNC images.
MATERIALS AND METHODS
Patient Population
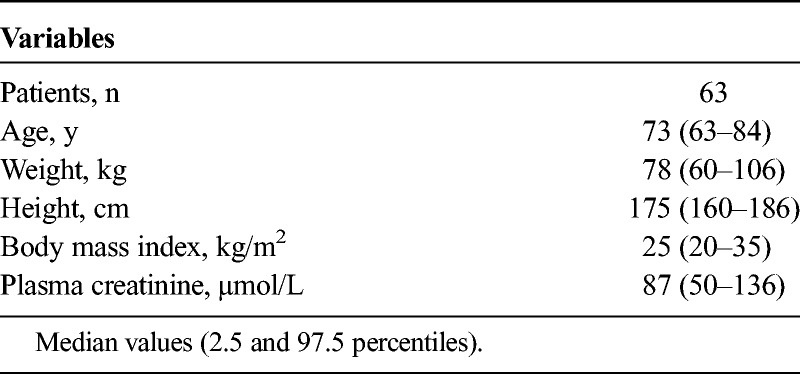
Between May 2014 and April 2015, 63 patients (53 men and 10 women; average age, 73 years) examined by DECT for follow-up after EVAR were included in the study. The study was approved by the local ethics committee (#2014/811). Patients with a body mass index greater than 35 kg/m2 were excluded because of the presumed insufficient transmission of 80 kVp quanta. Patients with impaired renal function (glomerular filtration rate <45 mL/min) were examined with a reduced contrast medium dose. Patient characteristics are shown in Table 1.
TABLE 1.
Patient Characteristics

CT Parameters and Radiation Dose
The same triphasic acquisition protocol (TNC, arterial contrast phase, and venous contrast phase) was used for all patients. All examinations were performed on a dual-source CT scanner (Siemens Somatom Definition Flash; Siemens Healthineers, Forchheim, Germany). This scanner contained 2 x-ray tubes mounted in the gantry at an angle of 95° and two 64-channel detectors. The diameters of the fields of view were 50 and 33 cm, respectively.
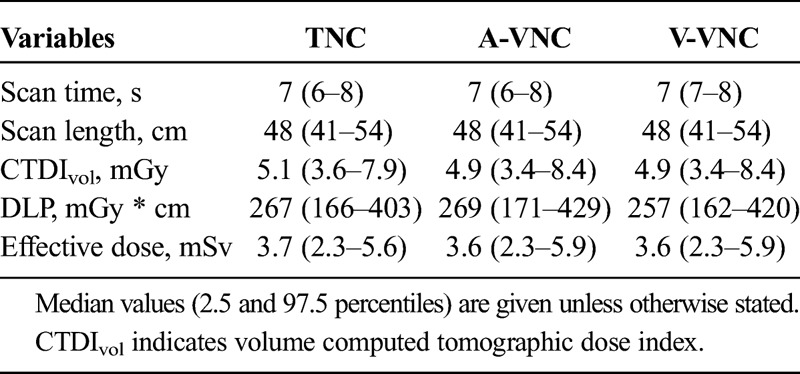
The examination was performed with the patient in the supine position and scanned in the craniocaudal direction from the thoracic aperture to the groin during breath-hold. Individual contrast media volume and injection rates were calculated based on contrast media dose per kg body weight (maximum dose weight, 80 kg) at a dose of 300 mg I/kg and median volume 65 mL (46–69 mL). Scanning parameters are listed in Table 2.
TABLE 2.
CT Scanning and Reconstruction Parameters of TNC Acquisition and A-VNC and V-VNC Reconstructions

The TNC scan was acquired first, with a tube potential of 120 kVp and the quality reference tube current of 104 mAs.
The arterial-phase scan was acquired after intravenous injection of contrast media (Omnipaque 350 mg I/mL; GE Healthcare, Oslo, Norway) with fixed injection time of 12 seconds followed by a 50 mL saline chaser at 4 mL/s. Bolus tracking with a threshold of 120 Hounsfield units (HU) at the level of the hemidiaphragm was used. The venous-phase scan was acquired 45 seconds after the arterial-phase scan.
The arterial- and venous-phase scans were acquired with tube A potential 80 kVp and tube B Sn140 kVp. The quality reference tube current values were 210 mAs for tube A and 81 mAs for tube B (Table 2). Automatic exposure control (CareDose 4D; Siemens Healthineers) was used to adapt the tube current to variations in patient attenuation.
For all acquisitions, the effective dose (ED) was calculated from the dose-length product (DLP) registered by the CT scanner and multiplied by the mean of the ED/DLP conversion factor for abdomen/pelvis [0.14 mSv/(mGy * cm)] based on the IRCP 103 tissue weighting factors.17 The ED of the triphasic unenhanced and enhanced protocol was compared with a dual-phase protocol, that is, the arterial phase and venous phase only.
TNC and VNC Image Reconstruction
True noncontrast images were reconstructed using the SAFIRE (Sinogram Affirmed Iterative Reconstruction) algorithm with a slice thickness/increment of 3/3 mm. From the arterial and venous phases acquisitions, the VNC images were reconstructed using SAFIRE and generated using a patented postprocessing algorithm (Syngo; Siemens Healthineers). A medium-smooth convolution kernel (I30f) was used for all reconstructions.
Quantitative Image Quality Analysis
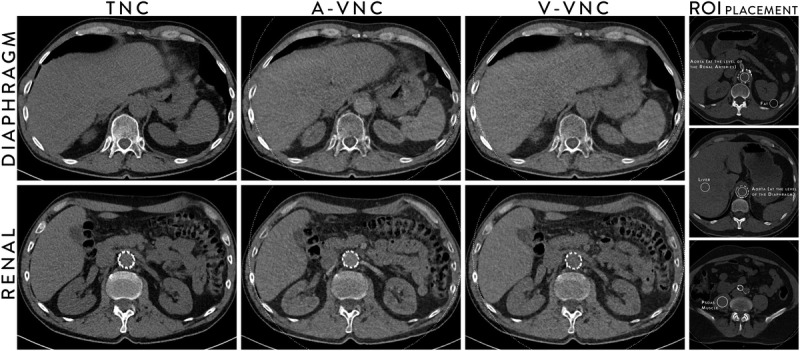
Comparisons of attenuation and noise between TNC, A-VNC, and V-VNC images were made by drawing circular regions of interest (ROIs) within the aortic lumen at the level of the hemidiaphragms, at the level of renal arteries, within the right lobe of the liver, within the retroperitoneal fat, and within the psoas muscle on a PACS workstation (IDS7; Sectra Imtec AB, Linköping, Sweden). The ROIs were made as large as possible while avoiding calcifications, plaques, and stent material. Mean attenuation and image noise (1 SD) in HU were registered (Fig. 1).
FIGURE 1.

Typical images at the aorta at the level of diaphragm (top row) and aorta at the level of renal arteries (bottom row) for TNC images, VNC images from arterial phase acquisition (A-VNC), and VNC images from venous phase acquisition (V-VNC) and images showing typical examples of the ROI placement (right column).
Qualitative Image Analysis
Subjective image quality was scored independently in randomized order by 2 senior consultant interventional radiologists over 10 years of CTA experience blinded to patient information and examination protocol on a PACS workstation. A 4-point scale was used for overall image quality (4 = excellent, 3 = good, 2 = moderate but sufficient for diagnosis, and 1 = nondiagnostic).
Statistical Analysis
Statistical analysis was performed using the SPSS statistical software (version 24.0; SPSS Inc, Chicago, Ill). For nonparametric parameters, medians and percentiles were used to describe the distribution, and a Wilcoxon signed ranks test was used to determine differences in attenuation values and in subjective image quality between the TNC and VNC data sets. Level of significance was set to P < 0.05. Interobserver agreement regarding overall image quality was assessed using intraclass correlation coefficient.
RESULTS
Virtual noncontrast images from arterial phase (A-VNC) and venous phase (V-VNC) acquisitions were compared with images from an actual unenhanced data set (TNC). All examinations were successful without any adverse events. Although the 80-kVp data set had a limited field of view of 33 cm, the entire aorta and the iliac arteries were located within the field of view in all cases.
Radiation Data
Radiation data are shown in Table 3. The mean scanning length for the TNC acquisition was 48 cm, and the calculated mean ED was 3.7 mSv. The median scanning length for the arterial phase and venous phase DE acquisition was 48 cm, and the calculated mean ED was 3.6 mSv for the arterial phase acquisition and 3.6 mSv for the venous phase acquisition. No significant difference in computed tomographic dose index values or in DLP values could be seen for TNC compared with contrast phase acquisitions. Replacing a triphasic protocol (TNC, arterial, and venous phases) with a biphasic protocol where TNC acquisition is replaced by VNC images would thus result in an average dose of 7.2 mSv, which translates into an ED reduction of 34%.
TABLE 3.
Radiation Parameters of TNC Acquisition and A-VNC and V-VNC Reconstructions

Quantitative Image Quality
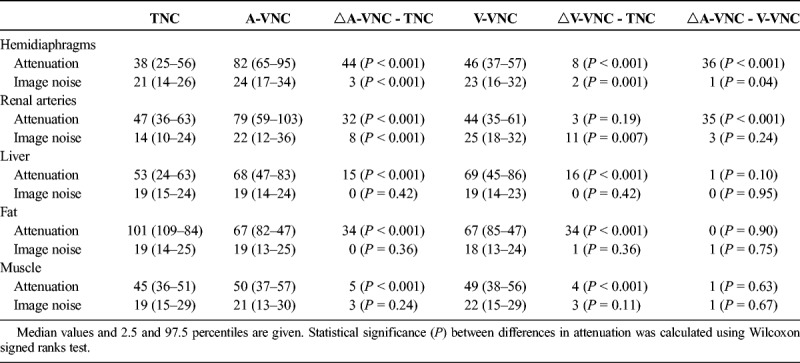
The TNC and VNC image noise and attenuation are listed in Table 4 and shown in Figure 1. The A-VNC images had significantly higher attenuation compared with the V-VNC and TNC images for both examined levels of the aorta. The difference between V-VNC and TNC was small and significant only at the measured levels of the diaphragmatic aorta.
TABLE 4.
Attenuation (HU) and Image Noise (1 SD, HU) at of the Aortic Lumen, at Liver Tissue, at Fat Tissue, and at Psoas Muscle of TNC Acquisition and the VNC Images Acquired From A-VNC and V-VNC

Attenuation in the liver, retroperitoneal fat, and psoas muscle was higher for both the A-VNC and V-VNC images compared with the TNC images, but little difference was noted between A-VNC and V-VNC. Image noise was at a similar level throughout the material.
Qualitative Image Quality
The mean overall quality scores in the TNC, A-VNC, and V-VNC were 3.7, 3.0 and 3.5, respectively, for reader 1, and 3.8, 3.0 and 3.7, respectively, for reader 2. The mean difference in subjective quality between TNC and A-VNC was 0.8 (P < 0.001), and the difference between TNC and V-VNC was 0.2 (P = 0.01). For overall image quality, the interobserver agreement was good with an average intraclass correlation coefficient value of 0.823.
DISCUSSION
In this prospective study based on 63 consecutive aortic DECT scans, we showed that in terms of attenuation values VNC images reconstructed from venous-phase CTA are a better approximation of TNC images than VNC images reconstructed from arterial-phase scans (Fig. 2).
FIGURE 2.

Scatter plots of the attenuation values at the liver, retroperitoneal fat, and psoas muscle in TNC images, VNC images from arterial phase acquisition (A-VNC), and VNC images from venous phase acquisition (V-VNC). Error bars indicate the median with a 95% confidence interval.
Several authors have reported image quality of VNC as an acceptable replacement for TNC images of the abdominal aorta,12–15,18 but in a previous study of aortic CTA, aortic attenuation was reported to be considerably higher in A-VNC images than TNC images.16
The attenuation differences between A-VNC and TNC, and between A-VNC and V-VNC, were constant at 2 examined levels of the aorta (diaphragmatic aorta and renal artery aorta). The difference between V-VNC and TNC was very small and not statistically significant for the renal artery aorta. The subjective image quality assessment shows that the TNC and V-VNC image quality is very similar.
While VNC imaging of the aorta was our main purpose of study, we measured attenuation and noise in the liver, fat, and muscle tissue for control purposes. For all these tissues, there were significant differences between both A-VNC and V-VNC compared with TNC, but very small differences between A-VNC and V-VNC. Therefore, it seems reasonable to assume that when imaging the aorta the VNC algorithm is insufficient to compensate for the very high iodine concentration in arterial-phase scans, but sufficient to deduct the lower iodine content typical for the venous-phase scan.
The differences in attenuation between TNC and VNC images for liver and fat tissue were slightly larger in our study compared with the study of Toepker et al,14 but quite similar for muscle tissue. We used tube voltages of 80/Sn140 kVp compared with 100/Sn140 kVp used by Toepker et al. Also, we used only 65 mL Omnipaque 350 mg I/mL contrast medium compared with Toepker et al, in which a total of 110 mL Iomeron 400 mg I/mL contrast medium was used, and Numburi et al,15 in which total of 120 to 150 mL Ultravist 370 mg I/mL contrast medium was used. Thus, it is possible that these differences contributed to the difference in results between their work and ours.
The limitation of our study is primarily that we have not included enough clinically relevant findings, such as stent migration or endoleak, to know whether the differences between A-VNC and V-VNC are relevant for diagnosing such findings. In future work, we would like to investigate sensitivity and specificity for clinically relevant findings using VNC as an alternative to TNC.
In conclusion, VNC images based on venous-phase scans appear to be a more accurate representation of TNC scans than VNC images based on arterial-phase scans, with similar attenuation and noise levels in the aorta compared with TNC scans.
Footnotes
The authors declare no conflict of interest.
REFERENCES
- 1.Moll FL, Powell JT, Fraedrich G, et al. Management of abdominal aortic aneurysms clinical practise guidelines of the European Society for Vascular Surgery. Eur J Vasc Endovasc Surg. 2011;41:S1–S58. [DOI] [PubMed] [Google Scholar]
- 2.Brown LC, Greenhalgh RM, Powell JT, et al. Use of baseline factors to predict complications and reinterventions after endovascular repair of abdominal aortic aneurysm. Br J Surg. 2010;97:1207–1217. [DOI] [PubMed] [Google Scholar]
- 3.Golzarian J, Valenti D. Endoleak after endovascular treatment of abdominal aortic aneurysms: diagnosis, significance and treatment. Eur Radiol. 2006;16:2849–2857. [DOI] [PubMed] [Google Scholar]
- 4.Javor D, Wressnegger A, Unterhumer S, et al. Endoleak detection using single acquisition split-bolus dual-energy computed tomography (DECT). Eur Radiol. 2017;27:1622–1630. [DOI] [PMC free article] [PubMed] [Google Scholar]
- 5.Rutherford RA, Pullan BR, Isherwood I. X-ray energies for effective atomic number determination. Neuroradiology. 1976;11:23–28. [DOI] [PubMed] [Google Scholar]
- 6.Alvarez RE, Macovski A. Energy-selective reconstructions in x-ray computerized tomography. Phys Med Biol. 1976;21:733–744. [DOI] [PubMed] [Google Scholar]
- 7.Liu X, Yu L, Primak AN, et al. Quantitative imaging of element composition and mass fraction using dual-energy CT: three-material decomposition. Med Phys. 2009;36:1602–1709. [DOI] [PMC free article] [PubMed] [Google Scholar]
- 8.Johnson TR, Krauss B, Sedlmair M, et al. Material differentiation by dual energy CT: initial experience. Eur Radiol. 2007;17:1510–1517. [DOI] [PubMed] [Google Scholar]
- 9.McCollough CH, Leng S, Yu L, et al. Dual- and multi-energy CT: principles, technical approaches, and clinical applications. Radiology. 2015;276:637–653. [DOI] [PMC free article] [PubMed] [Google Scholar]
- 10.Godoy MC, Naidich DP, Marchioro E, et al. Single-acquisition dual-energy multidetector computed tomography: analysis of vascular enhancement and post processing techniques for evaluating the thoracic aorta. J Comput Assist Tomogr. 2010;34:670–677. [DOI] [PubMed] [Google Scholar]
- 11.Heye T, Nelson RC, Ho LM, et al. Dual-energy CT applications in the abdomen. AJR Am J Roentgenol. 2012;199:64–70. [DOI] [PubMed] [Google Scholar]
- 12.Sommer WH, Graser A, Becker CR, et al. Image quality of virtual noncontrast images derived from dual-energy CT angiography after endovascular aneurysm repair. J Vasc Radiol. 2010;21:315–321. [DOI] [PubMed] [Google Scholar]
- 13.Shaida N, Bowden DJ, Barrett T, et al. Acceptability of virtual unenhanced CT of the aorta as a replacement for the conventional unenhanced phase. Clin Radiol. 2012;67:461–467. [DOI] [PubMed] [Google Scholar]
- 14.Toepker M, Moritz T, Krauss B, et al. Virtual non-contrast in second-generation, dual-energy computed tomography: reliability of attenuation values. Eur J Radiol. 2012;81:398–405. [DOI] [PubMed] [Google Scholar]
- 15.Numburi UD, Schoenhagen P, Flamm SD, et al. Feasibility of dual-energy CT in the arterial phase: imaging after endovascular aortic repair. AJR Am J Roentgenol. 2010;195:486–493. [DOI] [PubMed] [Google Scholar]
- 16.Lehti L, Söderberg M, Höglund P, et al. Reliability of virtual non-contrast computed tomography angiography: comparing it with the real deal. Acta Radiol Open. 2018;7:1–6. [DOI] [PMC free article] [PubMed] [Google Scholar]
- 17.Huda W, Magill D, He W. CT effective dose per length product using ICRP 103 weighting factors. Med Phys. 2011;38:1261–1265. [DOI] [PubMed] [Google Scholar]
- 18.Graser A, Johnson TR, Hecht EM, et al. Dual-energy CT in patients suspected of having renal masses: can virtual nonenhanced images replace true nonenhanced images? Radiology. 2009;252:433–440. [DOI] [PubMed] [Google Scholar]


