

Abstract
Fluorescence imaging of biological systems in the second near-infrared window (NIR-II) has recently drawn much attention because of its negligible background noise of autofluorescence and low tissue scattering. Here we present a new NIR-II fluorescent agent, graphene quantum dots dual-doped with both nitrogen and boron (N-B-GQDs). N-B-GQDs have an ultra-small size (~ 5 nm), are highly stable in serum, and demonstrate a peak fluorescent emission at 1000 nm and high photostability. In addition to the NIR-II imaging capability, N-B-GQDs efficiently absorb and convert NIR light into heat when irradiated by an external NIR source, demonstrating a photothermal therapeutic effect that kills cancer cells in vitro and completely suppresses tumor growth in a glioma xenograft mouse model. N-B-GQDs demonstrate a safe profile, prolonged blood half-life, and rapid excretion in mice, which are the characteristics favorable for in vivo biomedical applications.
Keywords: theranostic nanoparticle, NIR II fluorescence imaging, graphene quantum dot, photothermal effect, cancer therapy
Graphical Abstract
The paper reports a nitrogen and boron dual-doped graphene quantum dot (N-B-GQD) that enable NIR-II fluorescence imaging (>1000 nm) and can be used for photothermal therapy to treat cancer.
Introduction
Fluorescent imaging in the conventional near-infrared (NIR) window (NIR-I, 750–900 nm) is a widely used imaging modality for disease detection and analysis of functional biomolecules in vivo [1–3]. Its popularity comes largely from the fact that it utilizes a nonionizing portion of the electromagnetic spectrum and thus provides a safety profile that is unattainable by other popular imaging modalities such as X-ray and conventional computed tomography (CT) that utilize ionizing radiations. Also significantly, the wavelength window of NIR-I imaging falls in the regions of low energy absorption by water, oxyhemoglobin, and deoxyhemoglobin which are the major contributors to the poor penetration depth of optical imaging using visible light [4]. Despite the significant advantages, NIR-I imaging suffers from the drawback of background autofluorescence by endogenous chromophores in the body and yet further improvement in tissue penetration depth beyond those provided by NIR-I imaging is also highly desirable [5–8]. Since the light scattering experienced by photons when they interact with matter is inversely proportional to their wavelength, imaging using lights with wavelengths longer than those of NIR-I may reduce the light scattering and thereby increase the tissue penetration depth and detection sensitivity [9,10]. These considerations prompted the research of seeking imaging techniques that operate in a region of the electromagnetic wavelength spectrum known as the second near-infrared window or NIR-II (1000–1700 nm) [11–15].
Several materials have been investigated to serve as NIR-II contrast agents for imaging biological systems. These include semiconductor quantum dots (InSb, Ag2S, and Ag2Se) and rare-earth metal nanoparticles (NPs) [15–17]. However, the potential heavy metal toxicity associated with these NPs or quantum dots poses health risks when used in vivo [18]. Biocompatible metal-free single-walled carbon nanotubes (SWCNTs) are an alternative to heavy metal-based materials to serve as NIR-II contrast agent [11,19]. But SWCNTs are hydrophobic and lack functional groups, and require sophisticated surface modifications to render their surfaces hydrophilic to prevent them from aggregation when used in vivo [20,21]. Further, all the above-mentioned NIR II fluorophores, upon injected intravascularly, eventually accumulate and largely retain in the organs of the reticuloendothelial systems such as the liver and spleen for a long period of time and only small amount of them can reach cells or tissues of interest, an undesirable behavior that hinders their clinical translation [21].
More recently, small organic molecules such as IR-PEG and CH1055 were developed as NIR-II agents; they were surface-modified with polyethylene glycol (PEG) to improve their hydrophilicity, and with various tumor targeting ligands to enhance their ability to target tumors. These small organic molecules have demonstrated the ability to enable the real-time imaging of organs, tissues, blood vessels, and tumors in the NIR-II window and are rapidly cleared from the body through renal excretion [22–24]. Despite these encouraging results, however, organic fluorophores are generally poorly soluble in aqueous media due to their aromatic structures, usually lack chemical stability, and are incapable of providing long-term visualization and multiplexing. They possess only limited functional groups for conjugation of biomolecules for various applications. In addition, none of these organic fluorophores or nanoparticles with NIR-II capability has demonstrated as a theranostic agent that can serve both diagnostic and therapeutic purposes.
Here we introduce a new NIR-II contrast agent with a number of desirable characteristics that have not been unattainable by existing NIR-II contrast agents, including high chemical stability and photostability, hydrophilicity compatible with aqueous solutions, and procession of multiple functional groups that requires no additional surface modification for chemical conjugation. The nitrogen and boron dual-doped graphene quantum dots (N-B-GQDs) were synthesized via a one-pot process. We showed that N-B-GQDs demonstrate an NIR-II photoluminescence emission (950–1100 nm) and can serve as NIR-II imaging agent for the visualization of internal organs and blood vessels as demonstrated in wide-type mice. Furthermore, N-B-GQDs efficiently absorb and convert NIR light into heat effectively, which kills cancer cells in vitro and reduces tumor growth as demonstrated in a xenograft tumor mouse model.
Results and discussion
N-B-GQDs were synthesized at 230°C in an autoclave reactor using 3-aminophenylboronic acid monohydrate (APBA) as the precursor, hydrogen peroxide as an oxidizing agent, and acetone as a solvent. N-B-GQDs are produced through a two-step reaction (Fig. 1a). First, APBA monomers assemble into macromolecules by forming hydrogen bonds between their amino groups and boric acid groups (Fig. 1a, (i)). Second, the chemical bonds between carbon and hydrogen within the benzene rings of the macromolecules are severed to form nitrogen and boron-doped carbon-based free radicals and then larger carbon-based fragments at a high temperature and high pressure as a result of the gasification of acetone solvent (Fig. 1a, (ii)). Meanwhile, H2O2 decomposes to form O2, H2O, and highly-reactive free radicals including hydroxyl HO• and hydroperoxyl HOO•. The pressure increase by gaseous O2 and H2O further promotes the crystallization of carbon-based fragments, leading to the formation of N-B-GQDs through a nuclear burst at the supersaturation point. The produced O2 also diffuses into and reacts with N-B-GQDs to form inner vacancy defects [25]. In addition, free radicals also rapidly react with N-B-GQDs to form hydrophilic groups, which promote the dispersibility of N-B-GQDs in aqueous solution.
FIGURE 1.

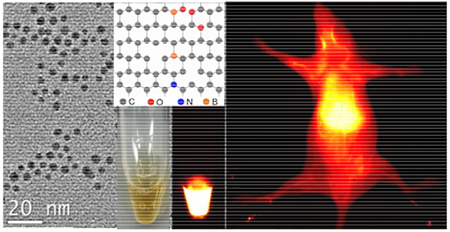
Synthesis, structure, and characterization of N-B-GQDs. (a) Schematic representation of the synthesis of N-B-GQDs: (i) formation of APBA macromolecules by hydrogen bonding; (ii) decomposition of macromolecules into N-B-GQDs. (b) TEM image of N-B-GQDs: the top right inset reveals the lattice fringe of an N-B-GQD and the bottom left inset is a photograph demonstrating the solubility of N-B-GQDs in distilled water. (c) AFM image of N-B-GQDs. (d and e) XRD pattern and Raman spectrum of N-B-GQDs, respectively.
The TEM image (Fig. 1b) shows that N-B-GQDs are well dispersed in aqueous solution and have an average size of ~4.7 nm (Supplementary Fig. S1). A high-resolution TEM image (inset of Fig. 1b) reveals that N-B-GQDs have a highly crystalline structure with an interplanar distance of ~ 0.205 nm, which corresponds to the (100) lattice planes of graphene [26]. The height of N-B-GQDs was characterized by atomic force microscopy (AFM). N-B-GQDs have a height of ~ 2.0 nm (Fig. 1c); it is reported that the thickness of each graphene layer ranges from 0.6 to 0.7 nm [27]. Thus N-B-GQDs mostly contain two or three layers. The crystallographic structure and phase purity of N-B-GQDs were assessed using X-ray powder diffraction (XRD) and Raman scattering techniques. The observed diffraction peak at 19.2° in the XRD pattern (Fig. 1d) corresponds to the characteristic peak associated with 002 plane of bulk graphite. The high degree of graphitization is confirmed in the Raman spectrum (Fig. 1e), where the ordered G band at 1581 cm−1 is stronger than the disordered D band at 1353 cm−1 (G to D intensity ratio is about 1.8) [28]. In addition, the D-band in the Raman spectrum indicates the presence of defects in N-B-GQDs [29].
X-ray photoelectron spectroscopy (XPS) was used to survey the composition of N-B-GQDs. As shown in Fig. 2a, carbon (69.736 %), oxygen (24.696 %), nitrogen (3.059 %), and boron (2.509 %) are present in N-B-GQDs. The N 1s spectrum (Fig. 2b) was deconvolved into four peaks assignable to pyridinic nitrogen (397.7 and 398.9 eV), pyrrolic nitrogen (399.3 eV), and quaternary nitrogen (401.5 eV) [30]. The B 1s spectrum (Fig. 2c) was deconvolved into three peaks with a peak at 190.2 eV for C-B, a peak at 191.7 eV for C=B, and a peak at 193.5 eV for O-B-C bonds [31,32]. Additionally, the high-resolution XPS spectra (Supplementary Fig. S2 and S3) of C 1s and O 1s show oxidized carbon in the form of a carboxylate group [33].
FIGURE 2.

Characterization of N-B-GQDs. (a) XPS scanning spectrum of N-B-GQDs showing four major peaks corresponding to oxygen, nitrogen, carbon, and boron. (b and c) High-resolution XPS survey of N 1s and B 1s, respectively. (d) FT-IR spectrum of N-B-GQDs.
The FT-IR spectrum (Fig. 2d) of N-B-GQDs shows an absorption peak at 1704 cm−1 which can be attributed to the C=O stretching band of carboxylic acid groups, while the broad absorption around 3434 cm−1 can be assigned to −OH groups [32]. The hydrophilic carboxyl groups (−COOH) on the surface of N-B-GQDs endow them with good water solubility (Fig. 1b, inset). The surface charge (Supplementary Fig. S4) of N-B-GQDs was measured to be −17.6 mV, and the negative charge is presumably due to the presence of hydrophilic functional groups. N-B-GQDs were also observed to disperse very well in phosphate buffered saline (PBS) and fetal bovine serum (FBS) (90% PBS and 10% FBS) even after 7 days, without the formation of observable macroscopic aggregates (Supplementary Fig. S5).
The UV–Vis-NIR absorption spectrum (Fig. 3a) of N-B-GQDs shows two absorption peaks at ~ 268 nm and 312 nm in the UV region; the former can be ascribed to n-π* transition of C=O bonds and the latter is the characteristic absorption peak of GQDs [34]. In addition, a broad NIR absorption band from 650 nm to 950 nm is observed, which is related to the larger conjugated system containing extensive delocalized electrons in the layered N-B-GQDs, similar to those observed in GQD [35]. Fig. 3a also shows the absorption spectrum of N-B-GQDs in the excitation wavelength range of 240–600 nm and with a peak at 368 nm. Photoluminescence (PL) spectra of N-B-GQDs were acquired under different excitation wavelengths ranging from UV to NIR light. Similar to typical GQDs [36], N-B-GQDs demonstrate an excitation wavelength-dependent and upconverted fluorescence in visible light regions (Fig. 3b–c). Both the PL emission intensity distribution and peak position varies with excitation wavelength.
FIGURE 3.

Optical characterization. (a) UV-vis-NIR absorption and excitation spectra of N-B-GQDs; the inset shows the expanded region of 650–950 nm. (b) PL spectra and (c) upconverted PL spectra of N-B-GQDs in visible region under different excitation wavelengths. (d) PL spectrum of N-B-GQDs with NIR emission under excitation wavelength of 808 nm; the insets show an optical image and a PL image of N-B-GQDs in aqueous solution.
Significantly, we observed NIR emission of N-B-GQDs with wavelengths greater than 900 nm using an excitation wavelength of 808 nm (2 W/cm2, 5 ms). As shown Fig. 3d, the N-B-GQDs emitted bright fluorescence (the inset) and demonstrated a broad emission range (950 nm to 1100 nm) in the NIR-II window. The quantum yield (QY) of N-B-GQDs was determined to be 1.0% using IR-26 as a reference following the reported method [37], which is higher than the QYs reported for SWCNTs (0.4%) and unmodified small organic molecule NIR-II fluorophores (0.3%) [23,24,37]. The PL intensity of N-B-GQDs in phosphate-buffed saline (PBS) and fetal bovine serum (FBS) in NIR II (1000 nm) and visible (470 nm) regions only decayed slightly after 2 h of continuous exposure to the excitation irradiation (Supplementary Fig. S6 and Fig. S7), demonstrating an excellent photostability of N-B-GQDs. In addition, N-B-GQDs show an excitation wavelength-dependent PL emission in the NIR-II window as demonstrated by varying excitation wavelength from 650 nm to 950 nm (Supplementary Fig. S8).
Several factors may contribute to the emission of N-B-GQDs in the NIR-II window. First, both the nitrogen and boron atom doping can induce significant local distortion of electron energy and create additional energy gaps [38]. Second, the vacancy defects in N-B-GQDs could red-shift the emission peak into the NIR-II window (>1000 nm). The emission peak shift towards longer wavelengths due to the presence of vacancy defects has been similarly observed for other GQDs [39]. Third, the presence of −OH or −COOH functional groups on the surface of N-B-GQDs could cause a band gap reduction and lead to a red-shift of the emission peak. It is reported that the emission wavelength increases with the amount of −OH or −COOH functional groups for oxidized GQDs [40]. This is supported by the experiment in that N-B-GQDs synthesized with no H2O2 have no PL properties while N-B-GQDs synthesized in the presence of a small amount of H2O2 (e.g., 2.5 mL) have weak PL properties in the NIR-II window (Supplementary Fig. S9). H2O2 is responsible for the production of −OH or −COOH functional groups and vacancy defects in N-B-GQDs. In addition, the size of N-B-GQDs (> 3.0 nm) may also play a role in the emission of NIR-II fluorescence. It is reported that the size of nitrogen-doped GQDs have an influence on the position of the emission peak and the nitrogen-doped GQD with the size greater than 3 nm could red-shift the emission peak [35].
As N-B-GQDs are intended for biomedical applications, the cytotoxicity of N-B-GQDs was evaluated with three tumor cell lines (SF763, 4T1, and B16F10). More than 94% of cells from all three cell lines survived 72 h after treatment with N-B-GQDs at concentrations up to 500 μg/mL (Fig. 4a). This indicates that N-B-GQDs are nontoxic to the tested cells.
FIGURE 4.

Biocompatibility of N-B-GQDs. (a) In vitro cytotoxicity study of N-B-GQDs performed by assessing the viability of SF763, 4T1, and B16F10 cells 72 h after treatment with N-B-GQDs. (b) Biodistribution of N-B-GQDs in various organs/tissues of nude mice receiving N-B-GQD injection, determined at various time points post-injection. (c) Fluorescence intensity of N-B-GQDs in blood as a function of time post-injection, used to determine blood half-life of N-B-GQDs. (d) Platelet (PL), serum alanine aminotransferase (SAA), blood urea nitrogen (BUN) and white blood cell (WBC) count of mice injected with N-B-GQDs or PBS, measured 24 h after administration (n = 4). (e) H&E stained tissue sections of mouse heart, kidneys, liver, lungs, and spleen, obtained from non-injected animals (control, top row) and those injected with N-B-GQDs (1 mg/mL, bottom row). The scale bar represents 50 μm. Statistical analysis was performed using the Student’s two-tailed t-test (**p < 0.01,***p < 0.001).
The in vivo biodistribution of N-B-GQDs was evaluated by injecting N-B-GQDs into wild-type mice and quantifying the fluorescence intensities of N-B-GQDs in various tissues (Fig. 4b). The results indicated that significant portions of N-B-GQDs accumulated in the liver, kidneys, and spleen, but majority of the N-B-GQDs were eliminated from these organs 96 hrs post-injection. The PL intensity change in blood sampled at different time points (Fig. 4c) revealed that N-B-GQDs had a long blood half-life (t1/2 ≈ 1.5 h), notably higher than PEG2000-modified SWCNTs (t1/2 ≈ 0.5 h) [2].
The acute toxicity of N-B-GQD was evaluated by quantifying levels of platelets (PL), serum alanine aminotransferase (SAA), blood urea nitrogen (BUN), and white blood cells (WBC) in blood collected from wild-type mice 24 h after intravascular administration of either N-B-GQDs or PBS as a control. As shown in Fig. 4d, no significant differences were observed between B-GQDs treated and PBS control mice. This indicates that N-B-GQDs had no detectable toxicity at the given dosage despite the significant N-B-GQD accumulation in liver.
The in vivo tissue biocompatibility of N-B-GQDs was further assessed by histological analysis of tissues harvested from mice intravenously injected with N-B-GQDs or PBS solution (control). Analyses of tissue sections showed that the tissues from the mice receiving N-B-GQDs appear similar to those from control animals, and no evidence of toxicity was observed (Fig. 4e).
To evaluate the NIR-II imaging capability in vivo, N-B-GQDs dispersed in PBS solution (1 mg/mL, 200 μL) were administered into nude mice through intravenous injection. NIR-II fluorescence was measured in the wavelength range of 1000–1700 nm using an excitation wavelength of 808 nm and an illumination density of 3 W/cm2. Two groups of animals served as controls: one group received no injection (Fig. 5b) and one group received PBS injection (200 μL) (Fig. 5c). As shown in Fig. 5a–c, no autofluorescence from endogenous tissues was observed. Video-rate fluorescence images based on the intrinsic NIR-II fluorescence of N-B-GQDs were acquired starting immediately after intravenous injection of N-B-GQDs to track the circulation of N-B-GQDs in real time for up to 120 min post-injection (Fig. 5d–i). Within approximately 1 s after injection (Fig. 5d), fluorescence of N-B-GQDs in the liver of the mouse was observed. At 30 s post-injection (Fig. 5e), fluorescence of N-B-GQDs in the kidneys of the mouse was also observed. At 120 min post-injection, the fluorescence signals in liver and kidneys were observably elevated compared to those acquired at earlier time points (Fig. 5i).
FIGURE 5.

NIR-II imaging of live mice in supine position. (a) Photograph of a nude mouse. (b and c) NIR-II imaging of a nude mouse receiving no injection and a nude mouse intravenously injected with PBS solution, respectively. (d-i) NIR-II fluorescence images of a nude mouse, acquired at sequential time points post intravenous injection of N-B-GQDs (1 mg/mL, 200 μL), including 1 s, 30 s, 60 s, 10 min, 30 min, and 120 min. (j) NIR-II fluorescence images of a nude mouse at higher magnification showing blood vessels in the head at various time points (1 s, 60 s, and 30 min) post-injection of N-B-GQDs; a mouse injected with PBS (control, the most left image) is also included for comparison.
Notably, with N-B-GQDs serving as a contrast agent for NIR-II imaging, we were also able to observe the blood vessels of the mouse. As shown in Fig. 5j, the neck blood vessels in the mouse injected with N-B-GQDs were clearly observed 1 and 60 s post-injection, but not in the mice receiving PBS injection. At 30 min post-injection, the NIR-II fluorescence signal from the neck blood vessels remained observable, although the intensity was substantially reduced. Similarly, the femoral artery with a diameter of ~130 μm in mice can also be observed in NIR-II imaging (Supplementary Fig. S10). These results suggest that N-B-GQDs can be used as NIR-II emissive nanoprobes for in vivo organ and vessel imaging.
We further conducted the in vivo and ex vivo NIR II fluorescence imaging for mice bearing C6 glioblastoma. C6 cells were inoculated in nude mice and two weeks after the inoculation, mice were injected intravascularly with N-B-GQDs (1 mg/mL, 200 μL). Fig. S11 shows (a) the photograph and (b) NIR-II fluorescence image, acquired at 24 h post injection, of a nude mouse bearing C6 tumor and intravenously injected with N-B-GQDs. Fig. S12 shows the ex vivo NIR-II fluorescence images of various organs harvested from the tumor-bearing nude mouse after it was sacrificed. Both in vivo and ex vivo bright NIR II fluorescence images acquired using an excitation wavelength of 808 nm were seen to light up the tumor of the treated mouse.
In addition to serving as an NIR-II fluorophore, N-B-GQDs can also emit fluorescence in the visible region when excited under a wide wavelength range from 405 nm to 820 nm. Supplementary Fig. S13 shows the laser scanning confocal images of SF-763 cells treated with N-B-GQDs and excited at three excitation wavelengths (405, 488, and 546 nm). The images show that N-B-GQDs emitted a bright fluorescence and lighted up cells in different colors. Two-photon fluorescence microscopic images of SF-763 cells incubated with N-B-GQDs (Supplementary Fig. S14) show that cells can be illuminated by the upconverted fluorescence emitted by N-B-GQDs upon excited by an NIR laser with excitation wavelength of 820 nm. The above result also shows that N-B-GQDs were primarily localized in the cytoplasm of SF-763 cells, suggesting that N-B-GQDs could be used as a transmembrane carrier for therapeutic purposes.
The photothermal behavior of N-B-GQDs was assessed because of their strong NIR absorption observed in the above experiments, which makes them a potential agent for photothermal therapy. Under continuous irradiation of an 808-nm laser (1.5 W/cm2), the temperature of N-B-GQDs of different concentrations (0–200 μg/mL) in water was measured over a 5-min period, with pure water containing no N-B-GQDs serving as a control (Fig. 6a). The temperature of pure water increased by ~3.2°C over this period, whereas the temperature of water containing N-B-GQDs at concentrations of 50, 100, and 200 μg/mL increased by 11.1, 19.2, and 26.6°C, respectively. This result indicates that N-B-GQDs can effectively convert NIR energy into heat via photoabsorption at a wavelength of 808 nm. To further investigate the photothermal effect of N-B-GQDs, we measured the temperature change of the solution containing N-B-GQDs (200 μg/mL, 2.0 mL) over time until the temperature of the solution reached a steady state (Fig. 6b). Based on the result obtained (Fig. 6c), the photothermal conversion efficiency of N-B-GQDs was evaluated (Supplementary) to be 32.32%, which is higher than that of gold nanorods (24.4%) but lower than red-emissive carbon dots (38.5%) [41,42].
FIGURE 6.

Photothermal property and in vitro PTT of N-B-GQDs. (a) Temperatures of pure water (control) and water containing N-B-GQDs of different concentrations as a function of time under NIR irradiation (808 nm, 1.5 W/cm2) for up to 5 min. (b) Temperature change of N-B-GQDs in aqueous solution (200 μg/mL) as a function of time under NIR irradiation (808 nm, 1.5 W/cm2); the irradiation was turned off 780 s after initiation of irradiation (cooling period) .(c) Linear time data versus − ln θ obtained from the cooling period shown in (b). (d) Viability of SF-763 cells treated with N-B-GQDs and subjected to or not subjected to NIR irradiation (808 nm, 1.5 W/cm2) for 5 min. (e-h) Confocal images of SF-763 cells co-stained with calcein AM (green, live cells) and propidium iodide (red, dead cells) (e and f, cytoplasm; g, cell nucleus; h, overlaid images of f and g) after treatment with N-B-GQDs (100 μg/mL) for 2 hrs and without (e) and with (f-h) NIR irradiation (808 nm and 1.5 W/cm2) for 5 min. (i) Tumor growth curves and (j) weight variation of mice treated under different conditions over a 14-day period. Statistical analysis was performed using the Student’s two-tailed t-test (***p < 0.001).
The photothermal behavior exhibited by N-B-GQDs as demonstrated above prompted our research in use of N-B-GQDs for photothermal therapy (PTT) against cancer. This was first assessed in vitro using SF-763 cells and then in vivo in a xenograft tumor mouse model. SF-763 cells were incubated with N-B-GQDs of various concentrations for 24 h and irradiated with NIR light (808 nm, 1.5 W/cm2) for 5 min. Cells treated with N-B-GQDs but receiving no NIR irradiation and cells receiving no N-B-GQD treatment were also included in the study as controls. As shown in Fig. 6d, NIR irradiation significantly reduced cell viability, with the lowest percent viability reaching 4% after cells were treated with N-B-GQDs at 100 μg/mL for 2 h. Conversely, exposing cells to NIR irradiation but without N-B-GQD treatment resulted in a negligible effect on cell viability (Supplementary Fig. S15), confirming the PTT efficacy induced by N-B-GQDs. Confocal fluorescent images (Fig. 6e–g) of cells co-stained with calcein AM (green, live cells) and propidium iodide (red, dead cells) show that the majority of SF-763 cells died after incubation with N-B-GQDs for 5 min while under NIR irradiation. However, no cell death was observed in SF-763 cells after incubation with N-B-GQDs but without NIR irradiation (Fig. 6e). Similarly, cells treated with PBS solution for 5 min, whether or not subjected to NIR irradiation, showed no appreciable cell death (Supplementary Fig. S16). The green signal surrounding the cell nuclei in Fig. 6f and h were from N-B-GQDs, which indicates that N-B-GQDs can enter the intracellular region and be used as a PTT agent.
To examine in vivo therapeutic efficacy of N-B-GQDs as PTT agents against cancer, mice bearing C6 glioblastoma were randomly divided into 4 groups with 4 mice per group. Two groups were intravenously injected with PBS solution and the other two groups were intravenously injected with N-B-GQDs. One group of the mice injected with PBS and one group injected with N-B-GQDs were then further treated by irradiating their tumor regions for 5 min with an NIR laser (808 nm, 1.5 W/cm2). Tumor sizes in mice were measured every two days up to 14 days post-treatment. As shown in Fig. 6i, the tumors in both PBS-injected groups grew rapidly, whether or not subjected to NIR irradiation. The tumors in mice treated with N-B-GQDs but not subjected to NIR irradiation exhibited a similar tumor growth profile to both PBS-treated groups. For these three groups, the tumors grew steadily, with tumor sizes increasing about 7-fold over 14 days. In contrast, the tumor growth seems completely suppressed in mice treated with combined N-B-GQD administration and NIR irradiation. The weight of all mice in each group was also recorded over the 14-day period (Fig. 6j). No abnormal weight loss or gain was observed in all mice groups. At day 14, tumors from all mice were harvested and weighed. The average tumor masses from the group treated with combined N-B-GQD administration and NIR irradiation were significantly smaller than those from the other three groups (Supplementary Fig. S17).
Conclusion
We have developed a theranostic nanoparticle by one-pot synthesis. This metal-free nanoparticle relieves the concern of potential toxicity of heavy metals that are commonly used in many existing NIR-II imaging agents. The nanoparticle exhibits a broad spectrum of PL emission (950 nm 1100 nm) with a peak at 1000 nm. We presented the first demonstration of in vivo NIR-II imaging (> 1000 nm) of internal organs and blood vessels in a mouse model with a metal-free quantum dot. The nanoparticle absorbs and converts NIR light into heat and thus can also serve as a PTT agent for cancer treatment. Our study showed that a single systemic injection of the nanoparticle under NIR irradiation for 5 min completely suppresses tumor growth. With favorable fluorescent and therapeutic properties, this nanoparticle may serve for imaging-guided cancer therapy and treatment monitoring.
Methods
Synthesis of N-B-GQDs
All chemicals were purchased from Sigma-Aldrich (St. Louis, MO). 3-aminophenylboronic acid monohydrate (APBA) (0.05 g) was dissolved in 30 mL acetone. After intense sonication for 30 min, 5.0 mL of H2O2 (30%) was slowly added into the solution. The solution was then ultrasonicated for 10 min and transferred into a 50 mL Teflon-lined stainless autoclave. The precursor solution was heated to and maintained at 230°C. After 24 h, the solution was cooled naturally to room temperature. The resultant product was dialyzed for 7 days using a Spectra/Por molecular porous membrane (molecular weight (MW), 3500) at room temperature. The aqueous dispersion of N-B-GQDs with molecular porous membrane (MW < 3500) was then collected and further dialyzed at room temperature for 7 days using a Spectra/Por molecular porous membrane (MW, 1000). Finally, N-B-GQDs with a MW between 1000 and 3500 were collected for future use.
Characterization
TEM and high-resolution TEM imaging was performed using a Tecnai G2F20 electron microscope (FEI, Hillsboro, OR) operating at a voltage of 200 kV. Atomic force microscopy (AFM) images were obtained using a stand-alone AFM system (Bruker Dimension Icon-PT). Powder X-ray diffraction (XRD) patterns were acquired using a D8 Bruker X-ray diffractometer with Cu Kα radiation. UV-vis absorption spectra were obtained on a UV-vis Spectrometer (Agilent Technologies, Santa Clara, CA). Fourier transform infrared (FTIR) spectra were acquired using a Nicolet 5-DXB FTIR spectrometer with a resolution of 4 cm−1. The surface charge of N-B-GQDs was measured at room temperature using a Zetasizer Nano-ZS (Malvern Instruments, Worcestershire, UK). Raman spectra were acquired on a Raman-Microscope--Renishaw-InVia using an Ar+ laser (514.5 nm) at room temperature. PL spectra were obtained on a JOBIN YVON Co. FluoroMax®-3 Spectrofluorometer equipped with a Hamamatsu R928P photomultiplier tube. X-ray photoelectron spectroscopy (XPS) experiments were carried out at the National ESCA and Surface Analysis Center at the University of Washington.
In vitro cell viability
Three kinds of cancer cells including human glioblastoma cells (SF-763), murine mammary cancer cells (4T1), and mouse melanoma cells (B16F10) were used to test the cytotoxicity of N-B-GQDs. Cells were cultured in an incubator maintained at 37°C with 5% CO2 and 95% humidity. Cells were seeded in a 96-well plate and incubated overnight in the Dulbecco’s Modified Eagle’s Medium (DMEM). On the following day, the medium was replaced with a medium containing N-B-GQDs or with control medium. Three concentrations of N-B-GQDs (100, 50, and 25 μg/mL) were used, and samples at each concentration were run in sextuplicate. The cells were incubated with N-B-GQDs for 72 h. Cells in the medium containing no N-B-GQDs were used as controls. Cell viability was assessed using the Alamar Blue assay. Briefly, the medium was replaced with cell culture medium containing the Alamar Blue reagent and incubated for 2 h. Following the incubation, a microplate reader (SpectraMax i3, Molecular Devices, Sunnyvale, CA) was used to determine the fluorescence intensity of N-B-GQDs (550ex/590em). The fluorescence intensity from N-B-GQDs in treated cells was compared to the intensity from untreated control cells to determine percent viability.
Confocal laser scanning microscopic imaging of SF-763 cells treated with N-B-GQDs
SF-763 cells were seeded onto glass cover slips in a 6-well plate and incubated overnight in water at 37°C. Cells were then incubated with N-B-GQDs (10 μg/mL) in cell culture medium for 2 h, washed with PBS 3× and fixed with 4% paraformaldehyde for 10 min at 37°C. Cells were then mounted onto glass slides with ProLong® Gold Antifade Mountant (Life Technologies Inc., Gaithersburg, MD). The images of cells were acquired using a Laser Scanning Microscope Leica SP8X (Leica Microsystems GmbH, Germany). Three excitation wavelengths were used (405, 488, and 546 nm).
Two-photon fluorescent imaging of SF-763 Cells Treated with N-B-GQDs
SF-763 cells were seeded onto glass cover slips in a 24-well plate. Twenty-four hours after seeding, cells were incubated with N-B-GQDs (5 μg/mL) for 2 h. Cells were then washed with PBS 3× and fixed with 4% paraformaldehyde for 10 min at 37°C. Cells were nuclear-stained with DAPI and mounted onto glass slides with ProLong® Gold Antifade Mountant (Life Technologies Inc., Gaithersburg, MD). Two-photon imaging was performed using an Olympus FV1000 MPE BX61 multi-photon microscope at an excitation wavelength of 900 nm.
Histopathological evaluation
Four days after receiving intravenous administration of N-B-GQDs (1 mg/mL), C57BL/6 wild-type mice (Charles River Laboratories, Inc.) were euthanized and the whole organs (heart, kidneys, liver, lungs, and spleen) were removed and preserved in 10% formalin for 48 h. Tissues were then embedded in paraffin, sliced into 5 μm sections, and stained with hematoxylin and eosin. Microscopic images of tissues were acquired using a Nikon ECLIPSE TE2000-S microscope.
Hematology analysis
White blood cells, platelets, serum alanine aminotransferase, and blood urea nitrogen levels were quantified at 24 h after intravenous administration of N-B-GQDs (200 μL, 1 mg/mL) in C57BL6 wild-type mice (n = 4). Animals receiving PBS injection (n = 4) were used as controls. Blood was collected by retro-orbital bleeding and submitted to the Research Testing Services at the University of Washington for analysis.
Biodistribution and blood circulation of N-B-GQDs
C57BL6 wild-type mice were injected via tail vein with N-B-GQDs (200 μL, 1 mg/mL). Mice receiving no injection were used as controls. At 24 h, 48 h, 72 h, and 96 h after injection, mice were euthanized and the whole organs of liver, spleen, kidneys, stomach, lungs, and heart were harvested. Fluorescence from N-B-GQDs was acquired for each organ/tissue type using a Xenogen IVIS imaging system at an excitation wavelength of 710 nm. To evaluate the serum half-life of N-B-GQDs, blood was collected from mice at 0.15, 1, 1.5, 2, 2.5, 3, 4, 6, and 8 h after injection of N-B-GQDs (200 μL, 1 mg/mL). Blood was centrifuged, and plasma was collected. Plasma from mice receiving no injection was used to eliminate the background fluorescence. Fluorescence was acquired using a Xenogen IVIS imaging system at an excitation wavelength of 710 nm.
In vivo NIR second window imaging of N-B-GQDs
All mice were obtained from Shanghai SLRC Laboratory Animal Co. and the experiments were performed in accordance with the Guidelines for the Care and Use of Research Animals. NIR-II imaging was conducted on a Series II 900/1700 fluorescence imaging system (Suzhou Near-Infrared Optics Technology, China) at 3W. Nude mice were injected intravenously with PBS (200 μL) or N-B-GQDs (200 μL, 1 mg/mL). 2 L/min oxygen flow with 2% isoflurane was used for anesthesia of mice during injection and imaging. The mice were imaged at various time points post-injection.
In vitro PTT of N-B-GQDs
SF-763 cells at a density of 1 × 10⁶ cells per well were incubated with PBS solution (control) or N-B-GQDs (100 μg/mL) for 2 h and then subjected to or not (as control) subjected to irradiation for 5 min at a wavelength of 825 nm and power density of 1.5 W/cm2. The cells were stained with Calcein-AM and PI for 15 min, washed with PBS, and imaged with a confocal fluorescence microscope at an excitation wavelength of 488 nm for cytoplasm and 546 nm for cell nuclei.
SF-763 cells were used to test the cytotoxicity of N-B-GQDs with/without NIR irradiation. Cells were seeded in a 96-well plate and incubated overnight in the aforementioned growth conditions. On the following day, the medium was replaced with a medium containing N-B-GQDs or with control medium. Four concentrations (100, 50, 25, and 12.5 μg/mL) of N-B-GQDs were used, and samples at each concentration were run in sextuplicate. The cells were incubated with N-B-GQDs for 72 h. Wells containing the normal medium without N-B-GQDs were used as the control. For photothermal treatments, cells in the wells were irradiated with 1.5 W/cm2 NIR light for 5 min.
In vivo PTT of N-B-GQDs
Flank xenograft C6 tumors were prepared by subcutaneous injection of two million cells suspended in PBS and Matrigel into athymic nude mice. Tumors were allowed to grow for 1 week. Mice were divided into four groups (n = 4 per group). Two groups were intravenously injected with PBS (200 μL) and the other two groups were intravenously injected with N-B-GQDs (200 μL, 1 mg/mL). Four mouse groups were then treated with (or without) NIR irradiation (808 nm, 1.5 W/cm2) for 5 min. Tumor sizes were monitored every 2 days for 14 days. The length and width of the tumors were measured with a digital caliper.
Supplementary Material
Highlights.
A bifunctional theranostic nanoparticle (BFNP) is developed.
BFNP is a contrast agent for both magnetic resonance imaging and fluorescence imaging
BFNP converts NIR light into heat enabling photothermal therapy
BFNP is benign to organs and healthy tissue
Imaging and therapeutic efficacy of BFNP is demonstrated in a mouse model
Acknowledgements
This work was supported by NIH grant R01CA161953. We acknowledge the support from NIH to UW W. M. Keck Microscopy Center (S10 OD016240). The authors gratefully acknowledge the help of Prof. Qiangbin Wang and Dr. Yejun Zhang at the Suzhou Institute of Nano-Tech and Nano-Bionics in the Chinese Academy of Sciences for NIR-II imaging.
Footnotes
Publisher's Disclaimer: This is a PDF file of an unedited manuscript that has been accepted for publication. As a service to our customers we are providing this early version of the manuscript. The manuscript will undergo copyediting, typesetting, and review of the resulting proof before it is published in its final citable form. Please note that during the production process errors may be discovered which could affect the content, and all legal disclaimers that apply to the journal pertain.
Appendix A.: Supplementary data Supplementary data associated with this article can be found, in the online version.
Data availability
The raw/processed data required to reproduce these findings cannot be shared at this time due to technical or time limitations.
References
- 1.Choi HS, et al. , Nat Biotech (2013) 31 (2), 148. [DOI] [PMC free article] [PubMed] [Google Scholar]
- 2.Liu Z, et al. , Nat Nano (2007) 2 (1), 47. [DOI] [PubMed] [Google Scholar]
- 3.Gioux S, et al. , Molecular imaging (2010) 9 (5), 237. [PMC free article] [PubMed] [Google Scholar]
- 4.Stefflova K, et al. , Frontiers in Bioscience (2007) 12, 4709. [DOI] [PubMed] [Google Scholar]
- 5.Kamolz L-P, et al. , Journal of Trauma and Acute Care Surgery (2006) 61 (3), 635 [Google Scholar]
- 6.Frangioni JV, Current Opinion in Chemical Biology (2003) 7 (5), 626. [DOI] [PubMed] [Google Scholar]
- 7.Zhang B, et al. , Nat Med (2014) 20 (8), 948. [DOI] [PMC free article] [PubMed] [Google Scholar]
- 8.Diao S, et al. , Nano Research (2015) 8 (9), 3027 [Google Scholar]
- 9.Horton NG, et al. , Nat Photon (2013) 7 (3), 205. [DOI] [PMC free article] [PubMed] [Google Scholar]
- 10.Bashkatov AN, et al. , Journal of Innovative Optical Health Sciences (2011) 04 (01), 9 [Google Scholar]
- 11.Welsher K, et al. , Nat Nano (2009) 4 (11), 773. [DOI] [PMC free article] [PubMed] [Google Scholar]
- 12.Hemmer E, et al. , Nanoscale Horizons (2016) 1 (3), 168. [DOI] [PubMed] [Google Scholar]
- 13.Smith AM, et al. , Nat Nano (2009) 4 (11), 710. [DOI] [PMC free article] [PubMed] [Google Scholar]
- 14.Hong G, et al. , Nat Photon (2014) 8 (9), 723. [DOI] [PMC free article] [PubMed] [Google Scholar]
- 15.Dong B, et al. , Chemistry of Materials (2013) 25 (12), 2503 [Google Scholar]
- 16.Hong G, et al. , Angewandte Chemie International Edition (2012) 51 (39), 9818. [DOI] [PubMed] [Google Scholar]
- 17.Naczynski DJ, et al. , Nature Communications (2013) 4, 2199. [DOI] [PMC free article] [PubMed] [Google Scholar]
- 18.Zrazhevskiy P, et al. , Chemical Society Reviews (2010) 39 (11), 4326. [DOI] [PMC free article] [PubMed] [Google Scholar]
- 19.Diao S, et al. , Journal of the American Chemical Society (2012) 134 (41), 16971. [DOI] [PubMed] [Google Scholar]
- 20.Welsher K, et al. , Proceedings of the National Academy of Sciences of the United States of America (2011) 108 (22), 8943. [DOI] [PMC free article] [PubMed] [Google Scholar]
- 21.Hong G, et al. , Nature Biomedical Engineering (2017) 1 (1), 0010 [Google Scholar]
- 22.Hong G, et al. , Nature Communications (2014) 5, 4206. [DOI] [PubMed] [Google Scholar]
- 23.Antaris AL, et al. , Nat Mater (2016) 15 (2), 235. [DOI] [PubMed] [Google Scholar]
- 24.Tao Z, et al. , Angewandte Chemie International Edition (2013) 52 (49), 13002. [DOI] [PubMed] [Google Scholar]
- 25.Yamada Y, et al. , Journal of the American Chemical Society (2014) 136 (6), 2232. [DOI] [PubMed] [Google Scholar]
- 26.Lin L, and Zhang S, Chemical Communications (2012) 48 (82), 10177. [DOI] [PubMed] [Google Scholar]
- 27.Dong Y, et al. , Journal of Materials Chemistry (2012) 22 (18), 8764 [Google Scholar]
- 28.Ristein J, et al. , Journal of Applied Physics (1998) 84 (7), 3836 [Google Scholar]
- 29.Ferrari AC, et al. , Phys Rev Lett (2006) 97 (18), 187401. [DOI] [PubMed] [Google Scholar]
- 30.Fei H, et al. , ACS Nano (2014) 8 (10), 10837. [DOI] [PubMed] [Google Scholar]
- 31.Zhao Y, et al. , J Am Chem Soc (2013) 135 (4), 1201. [DOI] [PubMed] [Google Scholar]
- 32.Wang H, et al. , Adv. Mater (2016), 1605416 [Google Scholar]
- 33.Kim IT, et al. , The Journal of Physical Chemistry C (2010) 114 (15), 6944 [Google Scholar]
- 34.Eda G, et al. , Advanced Materials (2010) 22 (4), 505. [DOI] [PubMed] [Google Scholar]
- 35.Tang L, et al. , ACS Nano (2014) 8 (6), 6312. [DOI] [PubMed] [Google Scholar]
- 36.Wang H, et al. , Advanced materials (2017) 29 (11) [DOI] [PubMed] [Google Scholar]
- 37.Murphy JE, et al. , Journal of the American Chemical Society (2006) 128 (10), 3241. [DOI] [PubMed] [Google Scholar]
- 38.Cao L, et al. , Accounts of Chemical Research (2013) 46 (1), 171. [DOI] [PubMed] [Google Scholar]
- 39.Li L-L, et al. , Advanced Functional Materials (2012) 22 (14), 2971. [DOI] [PMC free article] [PubMed] [Google Scholar]
- 40.Sk MA, et al. , Journal of Materials Chemistry C (2014) 2 (34), 6954 [Google Scholar]
- 41.Ge J, et al. , Adv Mater (2015) 27 (28), 4169. [DOI] [PubMed] [Google Scholar]
- 42.Xia Y, et al. , Accounts of Chemical Research (2011) 44 (10), 914. [DOI] [PMC free article] [PubMed] [Google Scholar]
Associated Data
This section collects any data citations, data availability statements, or supplementary materials included in this article.