Fig. 3.
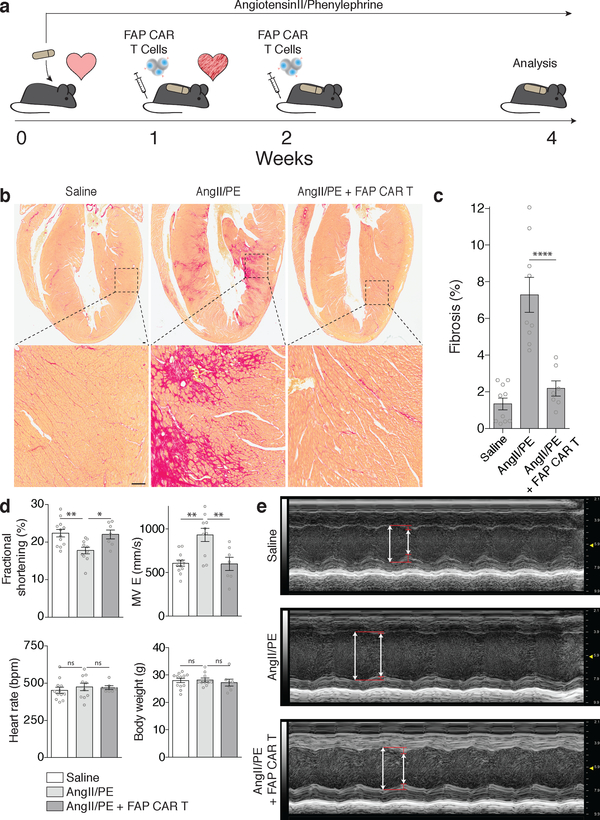
FAP CAR T cells can target cardiac fibrosis. (a) Schematic diagram of experiments for FAP CAR T-cell targeting of cardiac fibroblast. C57BL/6 mice were continuously administered angiotensin II and phenylephrine via osmotic pump to induce cardiac injury and fibrosis. FAP CAR T cells were adoptively transferred 1 and 2 weeks after pump implantation when fibrosis had already been established. Mice were evaluated and sacrificed at 4 weeks to asses for fibrosis. (b) Picro-Sirius Red staining of heart coronal sections in mice treated with saline (left), angiotensin II/phenylephrine (center), or angiotensin II/phenylephrine + FAP CAR T cells (right) to evaluate fibrosis (red). Magnification of left ventricular fibrosis (bottom). (c) Quantification of cardiac fibrosis. ****P < 0.0001 (one-way ANOVA between groups P < 0.0001; post-hoc multiple comparisons, Tukey’s test, n = 10, 9, 7 biologically independent animals, respectively). (d) Comparison of cardiac functional parameters and body weight between experimental and control groups. **P < 0.01, *P < 0.05, ns = not significant (one-way ANOVA between groups; post-hoc multiple comparisons on significant (P < 0.05) ANOVA, Tukey’s test, n = 10, 9, 7 biologically independent animals, respectively). Specific P values can be found in the source data. MV E: Mitral valve early (E) inflow velocity (e) M mode echocardiography of mice treated with saline (top), angiotensin II/phenylephrine (center), or angiotensin II/phenylephrine + FAP CAR T cells (bottom), (arrows; systole, diastole). Representative images of 2 independent experiments with similar results. All graphs display mean ± SEM. Scale bars = 100μm.

