

Abstract
Although mortality due to acute alcoholic hepatitis (AH) correlates with Model for End-Stage Liver Disease (MELD) scores, new biomarkers are critically needed to manage this disease. An increase in inflammatory markers and macrophage activation are associated with acute AH and could be potential biomarkers of clinical events and/or mortality. We enrolled 89 clinically-diagnosed AH patients in four US academic medical centers. Plasma from AH patients had a significant increase in gut microbial translocation indicators (endotoxin, bacterial 16S rDNA) and host response indicators (soluble (s)CD14 and lipopolysaccharide binding protein, LBP) compared to controls. Patient MELD and Glasgow Alcoholic Hepatitis scores (GAHS) correlated with endotoxin levels. AH patients also had a significant increase in High Mobility Group Protein 1 (HMGB1), a sterile danger signal molecule, and osteopontin (OPN), a multifunctional phosphoprotein involved in neutrophil activation, compared to controls. Increased levels of OPN positively correlated with increasing MELD scores and GAHS and LBP levels. Consistent with these results, AH patients had significantly increased circulating levels of macrophage activation (sCD163 and sCD206) markers compared to healthy controls and sCD163 and sCD206 significantly and positively correlated with OPN, HMGB1, and LBP levels as well as with MELD and GAHS scores. These findings indicate a connection between microbial translocation, immune cell activation and AH severity. Plasma sCD14, OPN, sCD163 and sCD206 levels were significantly higher in non-survivors than survivors. In multivariate regression models, we identified sCD14, sCD163, and OPN as independent predictors of 90-day mortality, infection, and organ failure development, respectively. Thus, our study suggests that sCD14, LBP, OPN, sCD163, and sCD206 are new biomarkers to indicate severity and predict clinical outcomes in AH.
Keywords: osteopontin, sCD206, sCD163, LBP, HMGB1, sCD14, organ failure, infection
Introduction
Alcoholic liver disease (ALD) is responsible for 0.9% of all deaths worldwide and is a leading cause of liver-related morbidity and mortality (1). The clinical spectrum of ALD encompasses steatosis, alcoholic steatohepatitis, alcoholic fibrosis, and cirrhosis. Acute alcoholic hepatitis (AH) is the most severe form of ALD and carries a high mortality (2, 3). Heavy alcohol consumption leads to changes in lipid metabolism causing lipid accumulation in hepatocytes and release of danger-associated molecular patterns (DAMPs) that, in combination with gut-derived pathogen-associated molecular patterns (PAMPs), induce an inflammatory response which characterizes alcoholic hepatitis (4).
A diagnosis of AH is based on clinical and laboratory findings; however, new biomarkers are needed to predict clinical outcome and disease severity. Inflammatory cascade activation during AH is a result of immune cell infiltration, activation, and secretion of mediators in response to damaged hepatocytes due to excessive alcohol consumption (3, 4). Infiltrating neutrophils, the presence of gut microbiome-derived lipopolysaccharides (LPS), and the pro-inflammatory cytokines, TNF-α and lL-1β, are implicated in the alcohol-related inflammatory response in ALD (5). Monocytes and macrophages play an important role in the pathogenesis of AH and produce pro-inflammatory cytokines in response to LPS. Chronic alcohol consumption leads to upregulation of both M1 (classical) and M2 (alternative) macrophage markers and contributes to liver inflammation and fibrosis (6). Macrophages also play a protective role by secreting cytokines, such as IL-6, and promoting liver regeneration (7).
Microbial products and DAMPs, components of dead host cells, induce inflammation. They are detected by the pattern recognition receptors expressed predominantly on tissue-specific and circulating innate immune cells including monocytes, macrophages and dendritic cells. AH patients have increased levels of circulating pro-inflammatory cytokines and chemokines such as TNF-α, IL-1β, IL-17 and IL-8 (8). Most of these pro-inflammatory cytokines are secreted by monocytes and macrophages along with other immune cells (4–7). During inflammation, DAMPs, PAMPs, and other molecules are found in the circulation that correlate with the extent of immune cell activation, thus can be used as biomarkers of alcoholic liver disease (9). In this study, we aimed to identify and characterize potential biomarkers of macrophage activation, sterile and microbial danger signals, and correlate their expression with disease severity and clinical outcomes in acute AH.
Patients and Methods
Human Subjects Involvement, Characterization and Design
Normal controls for this study included all ethnic groups with mostly Caucasians. Healthy volunteers were recruited from the University of Massachusetts Medical School, by written advertisement to participate in this study. Collection of blood samples was approved by the UMass Medical School IRB full committee review. Participating subjects (ages 20 to 65) gave 30–120 mL of peripheral blood. Plasma samples were stored in a −80˚C freezer and used for this study.
Human subjects with a clinical presentation consistent with acute alcoholic hepatitis (AH) were recruited from 4 US clinical centers (University of Texas Southwestern Medical Center, University of Massachusetts Medical School, Cleveland Clinic and University of Louisville School of Medicine) and stratified by disease severity as determined by the Model for End-Stage Liver Disease (MELD) score and enrolled in the study (10). For the present study, 89 patients with AH were studied; 43 in the moderate disease severity group (defined as MELD<20) and 46 in severe disease group (MELD≥20) (Fig S1A). The age range for the study was 21–70 years old. The sample size was calculated based on the analysis of patients with ALD in the Scientific Registry of Transplant Recipients database, accounting for drop-out, lost-to-follow-up and non-evaluable results and including a factor for possible non-representativeness of the original database. Collection of blood samples for this study was approved by the UMass Medical School IRB full committee review and a written informed consent was obtained from all participants.
The clinical diagnosis of alcoholic hepatitis was established according to Crabb et al (11) including (bilirubin >3 mg/dL, AST>ALT and >1.5x upper limit of normal) and screened for inclusion and exclusion criteria. The detailed description for patient recruitment and inclusion and exclusion criteria is summarized in the Supplementary materials. Development of infections (bacteremia, sepsis, spontaneous bacterial peritonitis, urinary tract infection, pneumonia, cellulitis, clostridium difficile related diarrhea), events related to liver failure/decompensation (variceal bleeding, hepatic encephalopathy, elevation in aminotransferases), and other organ failures (kidney, cardiovascular, pulmonary) were recorded during follow up. The diagnostic criteria for these events were based on compatible clinical symptoms, laboratory data and imaging findings. The detailed criteria can be found in the Supplementary materials.
Detection of bacterial components
Bacterial rDNA was isolated from patient plasma using the Qiagen DNA Isolation kit according to the manufacturer’s recommendation. SYBR Green based protocol (BioRad) was used for qRT-PCR measurement of 16S bacterial rDNA using nonspecific 16S primers (Forward primer 5’-TCC TAC GGG AGG CAG CAG T-3’, Reverse primer 5’-GGA CTA CCA GGG TAT CTA ATC CTG TT-3’) and 2.5 μL of isolated DNA. PCR cycling conditions included 94˚C x 5 minutes followed by 40 cycles of: 91˚C x 1 minute, 55˚C x 1 minute and 72˚C x 2 minutes. Relative 16S bacterial DNA was calculated by subtracting the average of the control sample Ct values from each sample’s Ct value (i.e., ΔCt) and calculating 2-ΔCt. Endotoxin (LPS) levels were quantified using the LAL Chromogenic Endotoxin Quantitation Kit (Thermo Scientific™ Pierce™, Cat # 88282).
Protein measurements
Quantification of secreted proteins in plasma was performed by the following kits: Osteopontin ELISA: Human Osteopontin (OPN) DuoSet, R&D Systems, Cat# DY1433; High Mobility Group Protein 1 (HMGB1) ELISA: IBL International, Cat# ST51011; sCD206 ELISA: RayBiotech, Human MMR ELISA, Cat# ELH-MMR-1; and sCD163 ELISA: Human CD163 Quantikine ELISA Kit, R&D Systems, Cat# DC1630. For soluble CD14 (sCD14), an ELISA kit was procured from R&D Systems (Cat # DC140) and Lipopolysaccharide binding protein (LBP) was measured using LBP, Human, ELISA kit (Hycult Biotech, Cat # HK315–02).
Statistical Analysis
Patients were categorized into MELD score groups of <20 and ≥20. Continuous patient characteristics were summarized with mean (and standard error) and compared between patient groups with Mann-Whitney U Tests for numeric variables. Frequencies were examined for categorical variables and patient groups were compared with Chi-squared tests. Non-parametric tests were used to compare serum plasma inflammatory marker levels between subjects and controls. Mann-Whitney U tests were used for two groups and Kruskal-Wallis tests for three or more groups. Spearman correlation was used to measure the strength of association between continuous MELD score and plasma biomarkers. Efficiency of different markers to discriminate between patients who did or did not develop adverse outcomes (mortality, infection, organ failure) was estimated by receiver operating characteristic (ROC) curve analysis. Area under the curve (AUROC) with corresponding 95% confidence intervals (CI) and p-values were calculated. The best discriminative thresholds were defined as the marker levels where sensitivity and specificity reached maximum value. In cases where best cut-offs were associated with 100% sensitivity, we chose the second best cut-off levels to establish convergence in our regression models.
Kaplan-Meier survival curves were plotted to estimate the cumulative probability of mortality. Significance of the observed differences in probabilities were assessed with log-rank tests. The association between clinical variables or plasma levels of the measured markers and mortality during follow-up was assessed with univariate Cox regression models. For adverse outcomes where mortality occurred as a competing event, we used the Aalen-Johansen estimator, a modified version of the Kaplan-Meier estimator, that takes mortality into account as a competing risk (12), to plot the cumulative incidence function. The association between these events, clinical factors, and levels of the measured markers were calculated by univariate Fine-Gray proportional hazard regression (13). Multivariate analyses were performed with backward elimination procedures and likelihood ratio tests to identify significant independent predictors. Associations are given as hazard ratio (HR) with 95% confidence intervals (CI). A two‐sided P<0.05 was considered to be statistically significant. For the Fine-Gray test we utilized R 3.5.1 supplemented with the EZR package, R commander and RcmdrPlugin.EZR plugin. For other statistical analyses and graphical presentation, SPSS 25.0 (SPSS, Chicago, IL, USA) and GraphPad Prism 7 (San Diego, CA, USA) were used.
Results
Study design and patient characteristics
We recruited patients to the study based on the protocol described in the Supplementary Materials. Subjects with the clinical diagnosis of acute AH were stratified based on Model for End-Stage Liver Disease (MELD) score to moderate (MELD<20) and severe (MELD≥20) (Supplementary Fig 1A). Baseline patient characteristics are shown in Supplementary Table 1. Patients with severe AH (MELD scores≥20) had higher creatinine, international normalized ratio (INR), bilirubin content, and white blood cell (WBC) count compared to moderate AH (MELD<20) (Supplementary Table 1). As expected, severe AH patients also had a higher 90-day mortality risk compared to patients with a MELD score of <20 (Supplementary Table 1).
Indicators of gut microbial translocation are increased in the circulation of AH patients
Chronic alcohol use is associated with increased gut permeability, allowing bacteria and bacterial components to enter the portal and systemic circulation (14). Increases in bacterial 16S rDNA and endotoxin (LPS) result in activation of immune cells via the Toll-like receptor (TLR) signalling pathways (Supplementary Fig 1B) (15). Thus, we evaluated the circulating levels of microbial and host-response indicators of microbial translocation including endotoxin, plasma 16S rDNA, soluble CD14 (sCD14) and lipopolysaccharide binding protein (LBP). We observed that the systemic markers of gut microbial translocation, endotoxin and plasma 16S rDNA, as well as host response indicators of PAMP-induced pro-inflammatory activation, sCD14 and LBP, were all significantly increased in the plasma of AH patients compared to healthy controls (Fig 1A).
Figure 1. Increased levels of gut microbial translocation markers in AH are associated with disease severity.
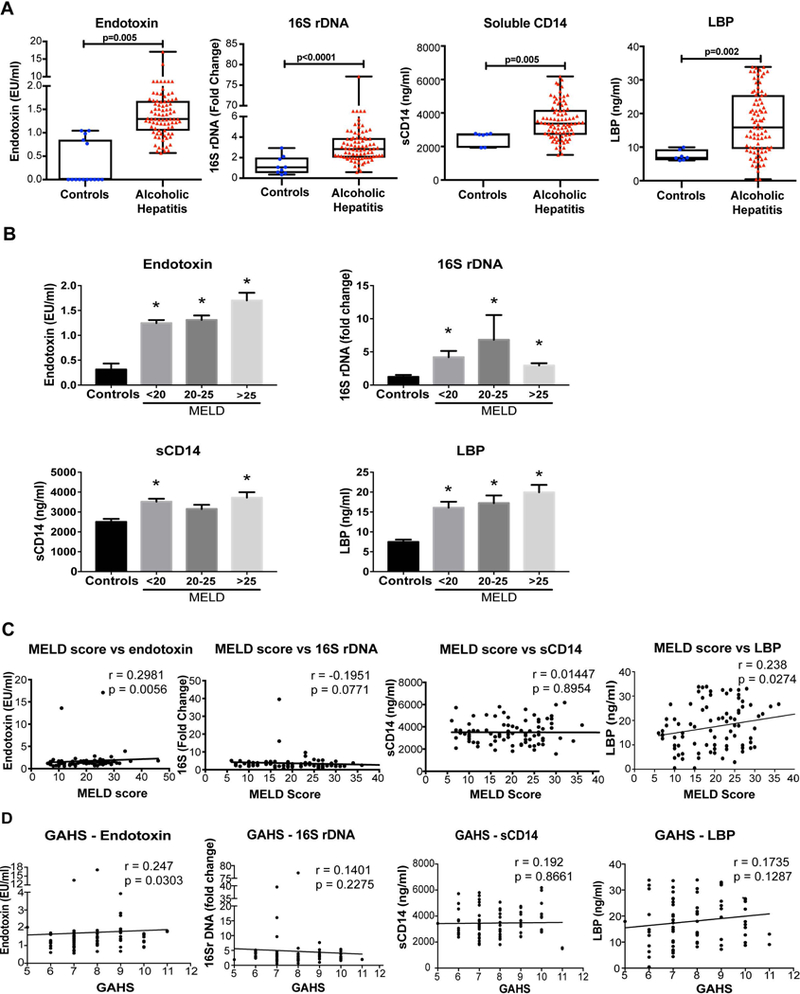
(A) The levels of endotoxin, 16S rDNA, soluble CD14, and lipopolysaccharide binding protein (LBP) were determined in the plasma of AH patients and compared to healthy controls. The data is represented as minimum to maximum, showing all the points and the p-value is calculated by nonparametric Mann-Whitney Test (n=10–87). (B) Plasma endotoxin, 16S rDNA, soluble CD14 and LBP values of patients were grouped by disease severity according MELD score categories and plotted in a graph. The data are shown as Mean± SE, *p<0.05 compared to controls. MELD scores (C) and Glasgow Alcoholic Hepatitis Scores (GAHS) (D) of the AH patients were plotted against plasma levels of endotoxin, 16S rDNA, sCD14 and LBP. Spearman’s correlation coefficient, (r) was determined to measure the direction (positive or negative) and the significance (p) and of association between MELD score and other variables. In the 16S, sCD14 and LBP plots one data point is outside the range of axes and not shown but was used in the statistical analysis.
Subgroup analysis of patients with different strata of MELD score (<20, 20–25, and >25) that clinically correlate with different survival probabilities revealed no significant differences in endotoxin, 16S rDNA, LBP and sCD14 levels between severity groups (Fig 1B). However, all of these subgroups showed increasing trends or significant increases compared to controls. These results indicate that there is increased microbial translocation from the gut in patients with AH that is associated with an increase in the levels of systemic circulating biomarkers of host response (sCD14 and LBP) to PAMPs triggered by microbial exposure (14, 16).
The clinical severity of AH correlates with increased systemic levels of microbial translocation markers
Next, we explored whether there was a correlation between disease severity as determined by clinical scores of MELD score or the Glasgow Alcoholic Hepatitis score (GAHS) and the biomarkers of gut microbial translocation. We observed a significant and positive correlation between increased plasma levels of endotoxin (LPS) and the adapter protein, LBP, and MELD scores (Fig 1C). There was no correlation between 16S rDNA or sCD14 increases and MELD scores (Fig 1C). Similar to correlation with MELD scores, increased plasma LPS correlated with increased GAHS scores while 16S rDNA and sCD14 showed no correlation with GAHS (Fig 1D).
Neutrophil attractant molecules are increased in AH patients
Activation of immune cells during chronic alcohol use contributes to the pathogenesis of AH (17, 18). For example, an increase in the number of activated neutrophils is a prominent feature of the disease (17, 19). Osteopontin (OPN), an extracellular matrix protein, has been shown to be essential for neutrophil recruitment and it is increased in AH (20, 21). The intracellular protein, HMGB1 acts as a sterile danger signal (22) and it enhances LPS induced inflammation and cytokine secretion by neutrophils and stimulates neutrophil NET formation (19). We found significant increases in the plasma levels of both OPN and HMGB1 in patients with AH compared to healthy controls (Fig 2A). The increase in OPN showed a very strong correlation with increases in both MELD (Fig 2B) and GAHS scores (Fig 2C). There was no correlation between increased HMGB1 levels and disease severity defined by MELD or GAHS scores (Fig 2B & C).
Figure 2. Increase in neutrophil attractant molecules and macrophage activation marker levels in AH patients, correlate with disease severity.
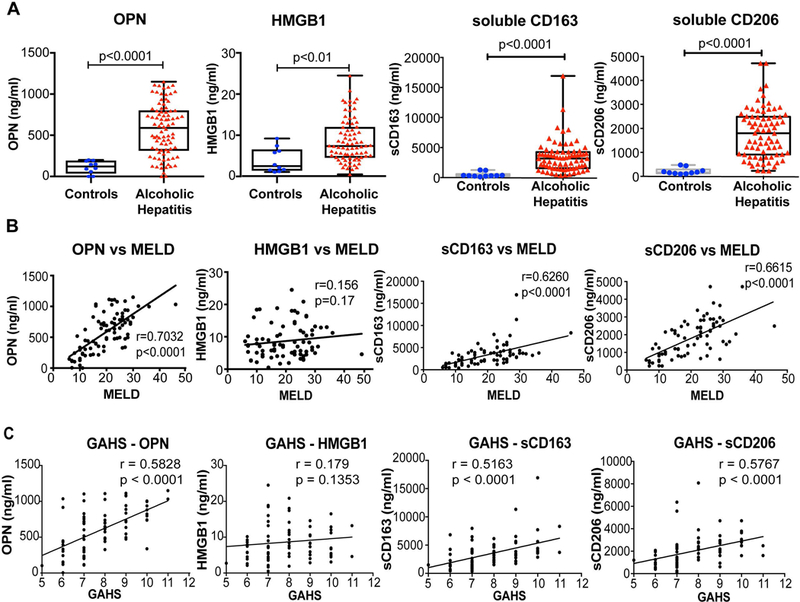
(A) The levels of OPN, HMGB1, sCD163 and sCD206 were determined in the plasma and values of AH patients were compared to healthy controls. The data is represented as minimum to maximum, showing all the points and the p-values are calculated by nonparametric Mann-Whitney Test (n=10–87). Spearman’s correlation analyses of MELD score (B) and Glasgow Alcoholic Hepatitis Score (GAHS) (C) with OPN, HMGB1, sCD163 and sCD206 were performed and r coefficients and p-values were calculated.
Macrophage activation markers, soluble CD163 and soluble CD206, are increased in the circulation of AH patients
In AH, innate immune responses induced by PAMPs due to gut bacterial translocation and sterile danger signals from hepatocytes damaged by alcohol lead to activation of Kupffer cells (KCs, resident liver macrophages) and recruitment and activation of macrophages in the liver (4, 5, 18). Macrophages recruit neutrophils to the site of liver injury and amplify proinflammatory response and liver damage. However, these neutrophils are mostly dysfunctional as shown by our group and others (17, 19, 23). Because macrophage activation is pivotal in the pathogenesis of ALD (5, 18), it is critical to identify and characterize the circulating markers of macrophage activation in AH patients. CD163 is a scavenger receptor and lineage specific monocyte/macrophage marker while CD206 is the mannose receptor expressed on KCs and other macrophages, as well as on dendritic and endothelial cells (24–26). The secretion of the soluble form of CD163 and CD206 (sCD163 and sCD206) is associated with M2 macrophage activation and considered as an indicator of liver inflammation (27, 28). We found that plasma concentrations of sCD163 and sCD206 were significantly increased in AH patients compared to healthy controls (Fig 2A). In addition, both of sCD163 and sCD206 showed a positive and highly significant correlation with disease severity defined by MELD and GAHS scores (Fig 2B–C). Thus, our data indicate that sCD163 and sCD206, circulating markers of macrophage activation, can be used as a tool for assessing the clinical severity of AH.
Positive correlation between bacterial translocation and immune cell activation markers
Because we found increases in different microbial, host and innate immune activation markers in AH, next we aimed to assess whether there are underlying connections between the different processes that these biomarkers refer to in AH patients. Neutrophil activation in AH might be triggered directly by the presence of bacterial components (17, 19–22), thus, we evaluated whether OPN and HMGB1 correlated with increases in endotoxin, 16s rDNA, LBP and/or sCD14. Endotoxin and LBP but not HMGB1 levels showed a significant positive correlation with the neutrophil attractant OPN (Fig 3A). There was no correlation between OPN or HMGB1 with sCD14, or 16s rDNA (data not shown). Importantly, we found a significant and positive correlation between OPN and HMGB1 with the macrophage activation markers, sCD163 (Fig 3B) and sCD206, respectively (Fig 3C). There was also a strong correlation between sCD163 and sCD206 increases (Fig 3D).
Figure 3. Correlation between bacterial translocation, neutrophil attractant molecules and macrophage activation markers in AH patients.
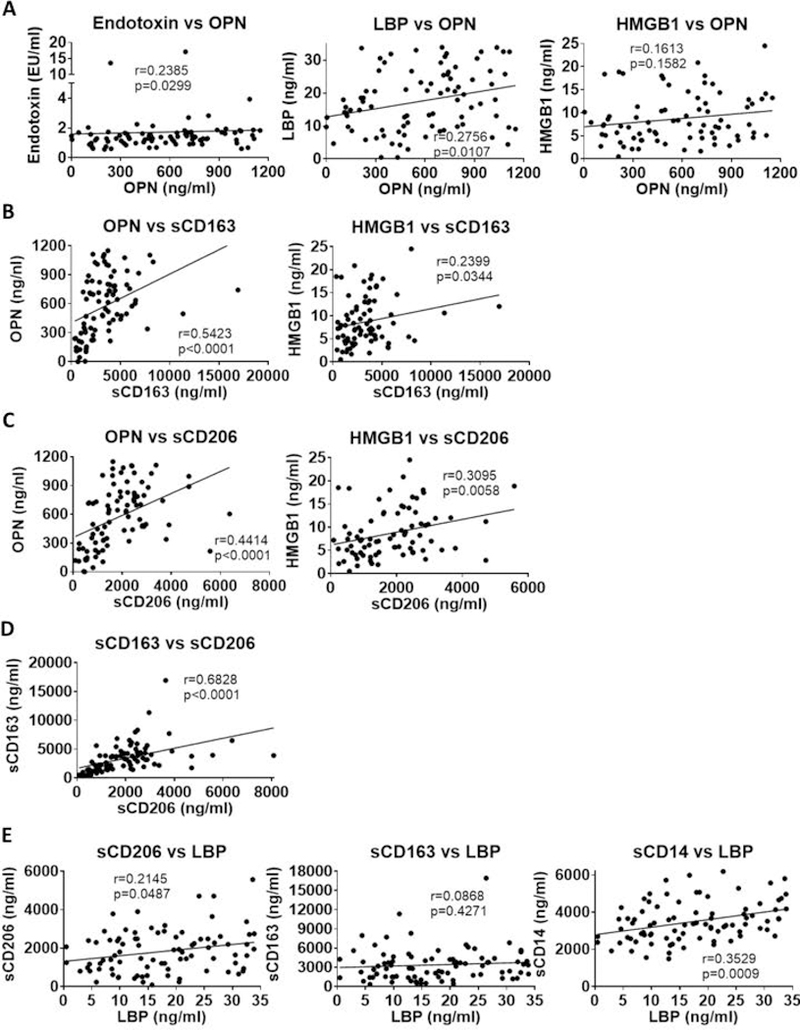
(A-E) Correlation analyses of various parameters were done using Spearman’s correlation. Significance levels (p) and correlation coefficients (r) and are given.
Because we identified a positive correlation between OPN and LBP as well as OPN and the macrophage activation markers, we next studied the correlation between sCD163 and sCD206 vs LBP. There was a positive correlation between sCD206 and LBP (Fig 3E) but there was no correlation between sCD163 and LBP (Fig 3E). We noted that sCD14, another indicator of monocyte/macrophage activation, also showed significant correlation with LBP (Fig 3E). These results demonstrate that neutrophil and macrophage activation during AH is closely related to the presence of microbial components and LBP, and these indicators may be utilized as a cluster of biomarkers to define disease severity in AH along with the MELD score.
Markers of innate immune cell activation can predict survival in AH patients
Of the 89 alcoholic hepatitis patients in this study fifteen (17%) died during the 90-day follow‐up and three additional deaths occurred in the 180-day followup. Here, we are presenting data based on the 90-day followup results. We observed that circulating endotoxin and sCD14 levels were significantly higher in the non-survivors compared to the survivors (Fig 4A). Likewise, OPN (Fig 4B), sCD163 and sCD206 (Fig 4C) levels were significantly higher in the non-survivors compared to the survivors; however, HMGB1 (Fig 4B) and LBP levels (Fig 4A) were not significantly different between the two groups.
Figure 4. Plasma endotoxin, neutrophil and macrophage activation markers are increased in non-survivor AH patients at 90 days.
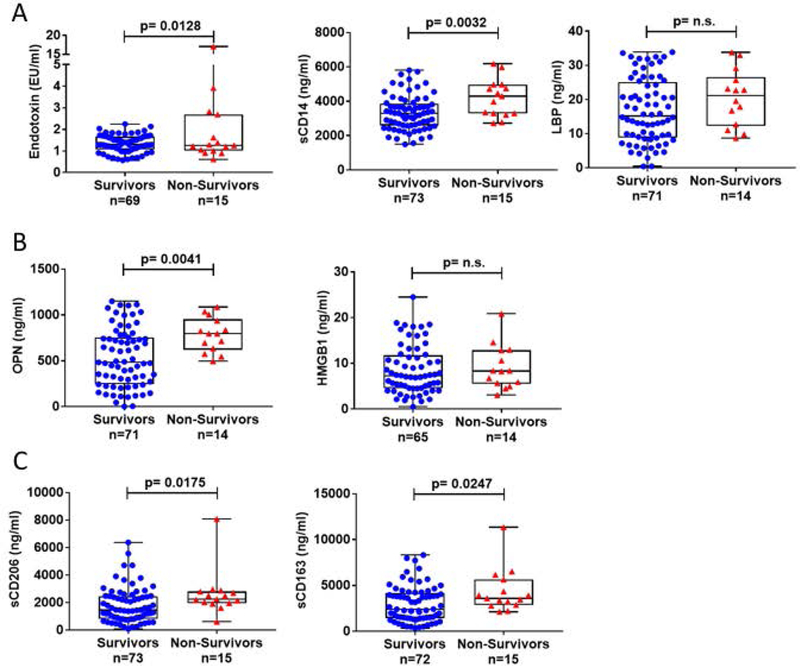
(A-C) The levels of endotoxin, sCD14, LBP, OPN HMGB1, sCD163 andsCD206, were determined in AH patients grouped as survivors versus non-survivors. The data is represented as minimum to maximum, showing all the points and the p-values are calculated by parametric T-test or nonparametric Mann-Whitney test as it was indicated by the distribution of the markers (n=14–73).
Next, we asked whether high levels of the biomarkers would predict 90-day mortality using log-rank and Cox-regression analyses. Receiver operating characteristic (ROC) curve analysis was used to identify the threshold levels of sCD14 (>4250.99 ng/ml), sCD163 (>2217.23 ng/ml), sCD206 (>1805.88 ng/ml) and OPN (>518.41 ng/ml) for 90-day mortality (Fig 5A). The p value of HMGB1, LBP, endotoxin and 16s rDNA ROC curves did not reach statistical significance (Table S2A), thus, these were not included in the calculation for predictive models. Kaplan–Meier survival curves were plotted to assess the survival function. Kaplan–Meier curves demonstrated higher mortality rate in patients with high sCD14, sCD163, sCD206 and OPN levels during the 90-day follow-up compared to patients with low levels of these biomarkers (Fig 5B; Table S2B).
Figure 5. Ninety-day mortality, infection and organ failure development in alcoholic hepatitis patients.
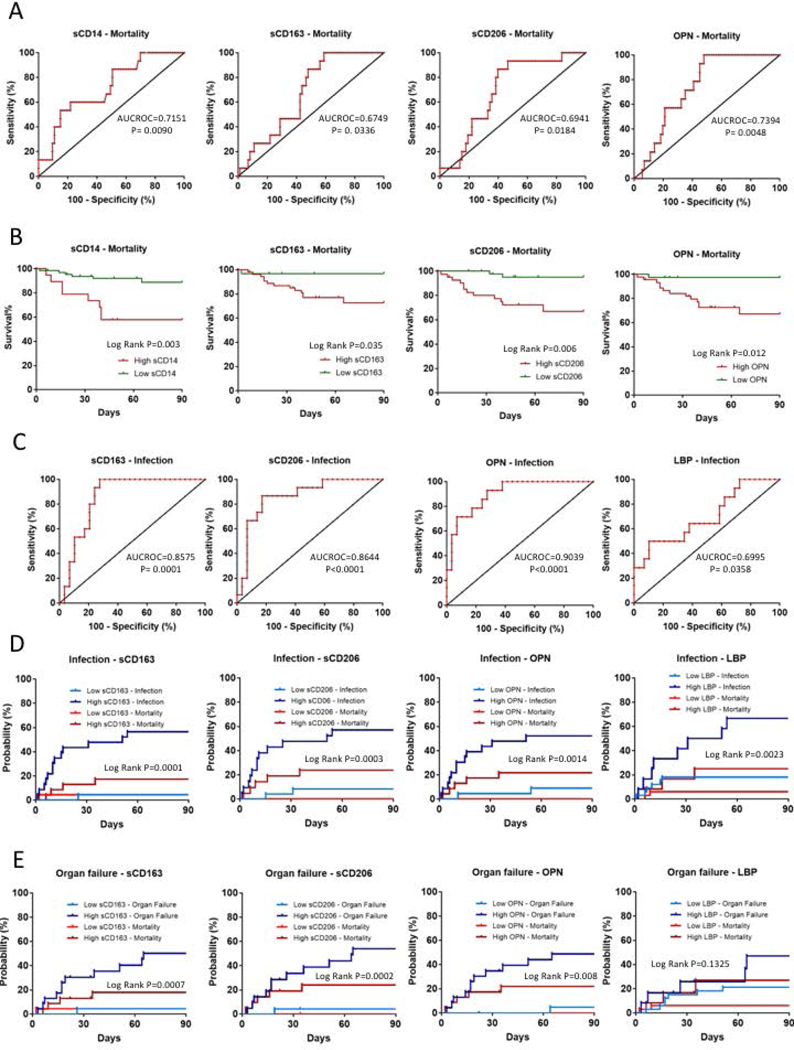
(A) ROC analyses of 690-day mortality to test prognostic efficiency of sCD14, sCD163, sCD206 and Osteopontin (OPN). AUROC and P values are given. Best discriminative cut-off levels were defined as values of the markers where the sum of sensitivity and specificity reached its maximum while still provided converging curves for regression models.(B) Kaplan-Meier survival plots of 790-days mortality using cut-off values of markers obtained with ROC analyses. Cumulative probability of death is higher in patients with high marker levels.(C) ROC analyses of infection development in the first 890-day of follow up to test prognostic efficiency of sCD163, sCD206, osteopontin (OPN) and Lipopolysaccharide Binding Protein (LBP) to define cut-off levels. AUROC and p values are given. Best discriminative cut-off levels were defined as values of the markers where the sum of sensitivity and specificity reached its maximum while still provided converging curves for regression models.Aalen-Johansen estimators plotted to asses cumulative incidence factor of infection (D) and organ failure development (E) taking mortality under account as a competing risk using cut-off values of markers obtained with ROC analyses. Patients with high marker levels were more likely to develop infections and organ failures than the ones with low levels.
In univariate Cox regression analysis high sCD14, sCD163, sCD206 and OPN levels were found to be significantly associated with 90-day mortality (Fig 5B). Of the clinical factors, disease severity as defined by MELD score and Maddrey’s discriminant factor as well as AST level, AST/ALT ratio, presence of ascites, albumin level and WBC count (but not the patients’ age, gender, ALT and alkaline phosphatase levels, presence of cirrhosis or encephalopathy), were significantly associated with 90-day mortality (Table 1). Multivariate Cox regression analysis revealed that high sCD14 remained the only independent predictor of mortality during the 90-day follow-up (Table 1).
Table 1. Uni- and multivariate Cox-regression analysis of 90-day mortality.
High sCD14, sCD163, sCD206 and Osteopontin levels are significantly associated with mortality at 90 days besides other clinical factors and laboratory parameters (univariate regression), but high sCD14 is the only independent predictor (multivariate regression).
| Univariate Cox-regression | Multivariate Cox-regression | |||||
|---|---|---|---|---|---|---|
| HR | 95% CI | P value | HR | 95% CI | P value | |
| Gender | 0.513 | 0.163–1.614 | 0.254 | |||
| Age | 1.026 | 0.97–1.084 | 0.376 | |||
| Meld score | 1.103 | 1.049–1.16 | 0.000 | 1.028 | 0.885–1.193 | 0.719 |
| Maddrey’s DF | 1.023 | 1.009–1.036 | 0.001 | 1.016 | 0.998–1.034 | 0.082 |
| Cirrhosis* | 1.358 | 0.301–6.127 | 0.691 | |||
| Ascites* | 3.949 | 1.349–11.562 | 0.012 | 0.552 | 0.138–2.213 | 0.402 |
| Encephalopathy* | 1.544 | 0.484–4.925 | 0.463 | |||
| AST | 1.007 | 1.002–1.012 | 0.009 | 1.003 | 0.996–1.010 | 0.425 |
| ALT | 1.008 | 0.993–1.022 | 0.302 | |||
| AST/ALT | 1.472 | 1.087–1.995 | 0.013 | 0.870 | 0.551–1.371 | 0.547 |
| Alk. Phos. | 1.003 | 0.999–1.006 | 0.122 | |||
| Albumin | 0.406 | 0.183–0.897 | 0.026 | 0.721 | 0.328–1.583 | 0.415 |
| WBC count | 1.058 | 1.001–1.119 | 0.046 | 1.037 | 0.960–1.121 | 0.359 |
| High sCD14 | 4.690 | 1.695–12.979 | 0.003 | 4.168 | 1.374–12.644 | 0.012 |
| High sCD163 | 8.902 | 1.170–67.729 | 0.035 | 0.989 | 0.077–12.740 | 0.993 |
| High sCD206 | 8.212 | 1.852–36.409 | 0.006 | 3.586 | 0.771–16.688 | 0.104 |
| High OPN | 13.672 | 1.796–104.075 | 0.012 | 4.535 | 0.549–37.458 | 0.160 |
HR: hazard ratio; CI: Confidence interval; DF: discriminant factor; decomp.: decompensation; AST: aspartate aminotransferase; ALT: alanine aminotransferase; AST/ALT: AST-ALT ratio; Alk. Phos.: alkaline phosphatase; WBC: white blood cell; OPN: osteopontin.
present/absent.
Markers of bacterial translocation and immune cell activation are associated with infection and organ failure development in AH
Next, we investigated development of infection and organ failure in a subset of 45 patients where prospective clinical outcome information was available. Of the 45 patients, 20 developed at least one adverse event during the 90-day follow up. The first adverse event was infection in 14 patients, organ failure in 1 patient and death in 5 patients. Of the 14 patients who developed infection as the initial adverse event, 11 developed organ failure at a later timepoint (Supplementary Fig 2).
ROC analysis was used to define the best discriminative threshold levels. The best cut-off levels for sCD163 (>2277.63 ng/ml), sCD206 (>1436.99 ng/ml) OPN (>432.74 ng/ml) and LBP (>21.05 ng/ml) (Fig 5C) were the same for infection and organ failure development. The p value of sCD14, HMGB1, endotoxin and 16s rDNA ROC curves did not reach statistical significance thus were not included in further regression analysis (Supplementary Table 3A). To assess the cumulative incidence factor of these events we plotted Aalen–Johansen estimators (Fig 5D & E), a modified version of the Kaplan–Meier estimator, that takes mortality into account as a competing risk (29). The probabilities as percentages are summarized in Supplementary Table 3B and C.
High sCD163, sCD206, OPN and LBP levels were found to be significantly associated with infection development in univariate Fine-Gray proportional hazard regression analysis (Table 2). MELD score, Maddrey’s discriminant factor, AST, and AST/ALT ratio, as well as presence of ascites, albumin level, and age were also significant predictors of clinical outcomes (Table 2). The patient’s gender, ALT and alkaline phosphatase levels, presence of cirrhosis or encephalopathy were associated with the development of infections (Table 2). In multivariate Fine-Gray proportional hazard regression analysis with backward elimination, high sCD163 level, age, presence of ascites and AST levels were independent risk factors of infection development taking plasma levels of markers and clinical covariates into account (Table 2). Development of organ failure was associated with high sCD163, sCD206, OPN levels (Fig 5E) as well as with MELD score, Maddrey’s discriminant factor, albumin and AST levels, AST/ALT ratio and presence of ascites in univariate Fine-Gray proportional hazard regression analysis (Table 3). Although age did not reach statistical significance (p=0.073), it was included in the multivariate models, where high OPN level, AST/ALT ratio, and age were found to be independent predictors of organ failure development (Table 3).
Table 2. Uni- and multivariate Fine-Gray proportional hazard regression analysis for competing events of 90-day infection development.
In univariate regression High sCD163, sCD206, Osteopontin and LBP levels are significantly associated with infection development at 90 days besides other clinical factors and laboratory parameters. High sCD163, age, AST levels and presence of ascites are independent predictors(multivariate regression).
| Univariate Fine-Gray proportional hazard regression |
Multivariate Fine-Gray proportional hazard regression |
|||||
|---|---|---|---|---|---|---|
| Hazard ratio |
95%CI | p value | Hazard ratio |
95%CI | p value | |
| Age | 1.064 | 1.008–1.123 | 0.026 | 1.071 | 1.024–1.12 | 0.0026 |
| Gender | 0.8092 | 0.2771–2.363 | 0.7 | |||
| Cirrhosis* | 1.14 | 0.2511–5.175 | 0.87 | |||
| Ascites* | 10.43 | 2.819–38.62 | 0.0004 | 5.983 | 1.061–33.73 | 0.043 |
| Encephalopathy* | 2.429 | 0.7604–7.758 | 0.13 | |||
| MELD score | 1.192 | 1.086–1.309 | 0.0002 | 0.9552 | 0.7603–1.2 | 0.69 |
| Maddrey Df | 1.037 | 1.017–1.058 | 0.0004 | 1.005 | 0.8734–1.156 | 0.95 |
| Albumin | 0.2348 | 0.1132–0.4868 | 0.0001 | 1.851 | 0.6642–5.161 | 0.24 |
| Alk. Phos. | 1.004 | 0.9994–1.008 | 0.093 | 1.002 | 0.9962–1.009 | 0.44 |
| ALT | 1.009 | 0.9921–1.026 | 0.31 | |||
| AST | 1.013 | 1.005–1.02 | 0.0008 | 1.014 | 1.005–1.023 | 0.0021 |
| AST/ALT | 2.286 | 1.439–3.63 | 0.0005 | 6.452 | 0.4749–87.65 | 0.16 |
| WBC | 1.05 | 0.9591–1.15 | 0.29 | |||
| sCD163 | 17.66 | 2.425–128.7 | 0.0046 | 10.7 | 3.2–35.81 | 0.00012 |
| sCD206 | 9.751 | 2.307–41.22 | 0.002 | 0.538 | 0.083–3.488 | 0.52 |
| OPN | 7.909 | 1.888–33.13 | 0.0047 | 1.317 | 0.2008–8.637 | 0.77 |
| LBP | 4.505 | 1.608–12.62 | 0.0042 | 1.897 | 0.081–44.41 | 0.69 |
HR: hazard ratio; CI: Confidence interval; DF: discriminant factor; AST: aspartate aminotransferase; ALT: alanine aminotransferase; AST/ALT: AST-ALT ratio; Alk. Phos.: alkaline phosphatase; WBC: white blood cell; OPN: osteopontin, LBP: lipopolysaccharide binding protein
present/absent
Table 3. Uni- and multivariate proportional hazard regression analysis for competing events of 90-day organ failure development.
In univariate regression high sCD163, sCD206 and osteopontin levels are significantly associated with organ failure development at 90 days besides other clinical factors and laboratory parameters. High OPN level, age and AST/ALT ratio are independent predictors.
| Univariate Fine-Gray proportional hazard regression |
Multivariate Fine-Gray proportional hazard regression |
|||||
|---|---|---|---|---|---|---|
| Hazard ratio |
95%CI | p value | Hazard ratio |
95%CI | p value | |
| Age | 1.055 | 0.9949–1.119 | 0.073 | 1.142 | 1.048–1.243 | 0.0024 |
| Gender | 0.7412 | 0.2262–2.428 | 0.62 | |||
| Cirrhosis* | 2.153 | 0.2506–18.5 | 0.48 | |||
| Ascites* | 8.396 | 2.216–31.81 | 0.0017 | 2.335 | 0.5189–10.500 | 0.27 |
| Encephalopathy* | 1.649 | 0.4481–6.069 | 0.45 | |||
| MELD score | 1.246 | 1.101–1.411 | 0.00051 | 1.028 | 0.7652–1.380 | 0.86 |
| Maddrey Df | 1.048 | 1.025–1.073 | >0.0001 | 1.012 | 0.9807–1.044 | 0.46 |
| Albumin | 0.2581 | 0.1306–0.51 | 0.0001 | 1.018 | 0.1493–6.934 | 0.99 |
| Alk. Phos. | 1.004 | 0.9991–1.008 | 0.12 | |||
| ALT | 1.008 | 0.9923–1.024 | 0.32 | |||
| AST | 1.009 | 1.004–1.014 | 0.00017 | 1.00 | 0.9935–1.007 | 0.91 |
| AST/ALT | 2.594 | 1.518–4.433 | 0.00049 | 5.699 | 1.599–20.310 | 0.0073 |
| WBC | 1.011 | 0.8994–1.136 | 0.86 | |||
| sCD163 | 14.62 | 1.92–111 | 0.0095 | 1.136 | 0.1069–12.070 | 0.92 |
| sCD206 | 17.31 | 2.24–133.8 | 0.0063 | 2.749 | 0.3002–25.180 | 0.37 |
| OPN | 14.36 | 2.02–102.1 | 0.0078 | 9.789 | 2.729–35.120 | 0.00047 |
| LBP | 2.36 | 0.7833–7.11 | 0.13 | |||
HR: hazard ratio; CI: Confidence interval; DF: discriminant factor; AST: aspartate aminotransferase; ALT: alanine aminotransferase; AST/ALT: AST-ALT ratio; Alk. Phos.: alkaline phosphatase; WBC: white blood cell; OPN: osteopontin, LBP: lipopolysaccharide binding protein
present/absent
Discussion
Patients with severe AH have a high mortality and morbidity and have limited treatment options, thus making AH one of the most common and deadliest liver diseases in the world (1–3). Alcohol directly affects hepatocytes and leads to increased intestinal permeability and activation of immune cells by gut-derived LPS. This, in turn, leads to overactivation of the pro-inflammatory cascade (3, 4, 14, 18). Molecular mechanisms and biomarkers that can differentiate between AH and the stable ALD are yet to be identified. Clinical calculators, such as the MELD score can predict mortality and guide treatment decisions however, MELD was not specifically designed to predict outcomes in AH (30). Thus, examining new circulating biomarkers in AH is a critically needed area of research (9).
In the present study, we show that AH patients have increased circulating markers of bacterial translocation and gut permeability. We observed that increased endotoxin levels positively correlate with MELD score and GAHS and we showed that other indicators of gut microbial translocation such as the microbial component, 16S rDNA, was significantly increased in the circulation in AH. These findings corroborate on a previous report that identified LPS and LBP as markers of inflammation in ALD patients (31). Indeed, we found that the host response indicators of microbial recognition, LBP and sCD14, were also increased in our AH patient population. The increase in LBP also correlated with an increasing MELD score. Thus, our results confirm earlier findings as well as demonstrate the importance of bacterial translocation in the pathogenesis of AH.
Neutrophils from alcoholic liver cirrhosis patients have higher resting activation than those from patients with cirrhosis of other etiology or from healthy subjects and correlate with increased plasmaendotoxin levels (32). Neutrophils are part of the innate immune system that forms the first line of defense against foreign pathogens and foreign bodies (17). Furthermore, neutrophils play an important role in elimination of cellular “debris” in sterile inflammation (33). During bacterial infection, neutrophils use various strategies to clear or contain invading pathogens. However, clinical studies in AH suggest that increased hepatic neutrophil number in response to increased plasma endotoxin level is associated with poor clinical outcome in patients (34). In humans and mice alcohol exposed neutrophils showed increased neutrophil extracellular trap (NET) formation but they were dysfunctional in response to additional stimulation with a bacterial challenge (19).
We found that osteopontin (OPN), an extracellular matrix protein that acts as a neutrophil-attracting chemokine (21), was significantly increased in AH patients and it positively correlated with increasing MELD scores and GAHS. Others have found increased plasma OPN levels in patients with liver failure, and OPN expression is increased in a CCL4-mediated liver injury model in mice (35, 36). A study by Morales-Ibanez et al. showed that the gene encoding OPN was highly upregulated in the livers of AH patients and was induced by LPS (20). Here, we observed that increased OPN levels in plasma samples of AH patients correlated with increased endotoxin, LBP and disease severity scores indicating that the OPN increase in AH is likely due to host response to endotoxin as well as a mediator of disease. These observations suggest a link between bacterial translocation and neutrophil activation as well as disease severity in AH. Remarkably, in multivariate analysis we found that high osteopontin levels at enrollment predicted development of organ failure during the 90-day followup. Inappropriate neutrophil activation and positioning of neutrophils within the microvasculature has been shown to contribute to multiple organ failure (37). Neutrophil dysfunction was also linked to development of acute and subacute liver failure in previous reports (34).
In addition to LPS-induced activation of TLRs, the cell death and injury marker, HMGB1, that has been reported to mediate and amplify TLR4 activation by gut-derived LPS (38, 39), was increased in the circulation of AH patients. HMGB1 is released by damaged hepatocytes and recognized by TLR2, 4 and 9, leading to inflammation (40). We evaluated HMGB1 as a potential indicator of disease severity and observed that it was increased in AH and positively correlated with MELD. Together, our data indicate that both DAMPs, such as HMGB1, and gut-derived PAMPs (LPS and 16s rDNA) are significantly increased in the circulation of patients with AH contributing to the elevated proinflammatory state and disease progression.
In the liver, alcohol induces the initial innate immune response leading to AH, and this response, when coupled with gut permeability, leads to bacterial translocation and activation and polarization of liver macrophages, KCs, and circulating monocytes (6, 41, 42). In ALD and AH, macrophages have heterogeneous phenotypes. The highly pro-inflammatory macrophages in the liver in ALD are characterized by TNFα production, CD68 expression and pro-inflammatory cytokine production (6, 43). In addition to this pro-inflammatory phenotype, several studies, including ours, have found macrophages with anti-inflammatory properties as well (42). In human livers with AH, increased expression of the M2 macrophage markers, CD163 and CD206, was reported along with the presence of increased M1 polarized proinflammatory macrophages (44). In fact, it remains to be determined whether the presence of anti-inflammatory, repair macrophages represents an attempt to attenuate inflammation in AH. We also showed that in vitro, alcohol can program monocytes to preferentially express markers of anti-inflammatory macrophages, CD163 and CD206 (41). CD163 can be cleaved from the cell surface involving inflammation-responsive proteases of the TACE/ADAM family (45) An increase in the soluble levels of CD206 and CD163 has been identified as circulating markers of monocyte/macrophage activation in different diseases including HCV infection (27, 28, 46, 47). Here, we report that the dramatic increase in both sCD206 and sCD163 correlated with disease severity in AH, indicated by MELD score and GAHS, providing the clinical relevance of this observation. Soluble CD206 and sCD163 also positively correlated with each other, suggesting that the expression of these macrophage markers is linked. Soluble CD163 and sCD206 were also increased in septic and non-septic critically ill patients (48). We discovered that high levels of sCD163 predicted infection development in 90-days that might be related to inappropriate macrophage activation in alcoholic hepatitis. Previous observations suggest defective monocyte/macrophage oxidative burst, a key host defense mechanisms to combat infection, in AH (49).
A study by the European Association for Study of Liver-Foundation for the study of chronic liver failure (EASL-CLIF) consortium showed that sCD206 and sCD163 can be used to predict the mortality of patients with liver cirrhosis and adding these markers to the clinical scores improved disease prognosis (27). In our study, we showed that increased levels of sCD206, sCD163, sCD14 and OPN were associated with increased mortality in AH.
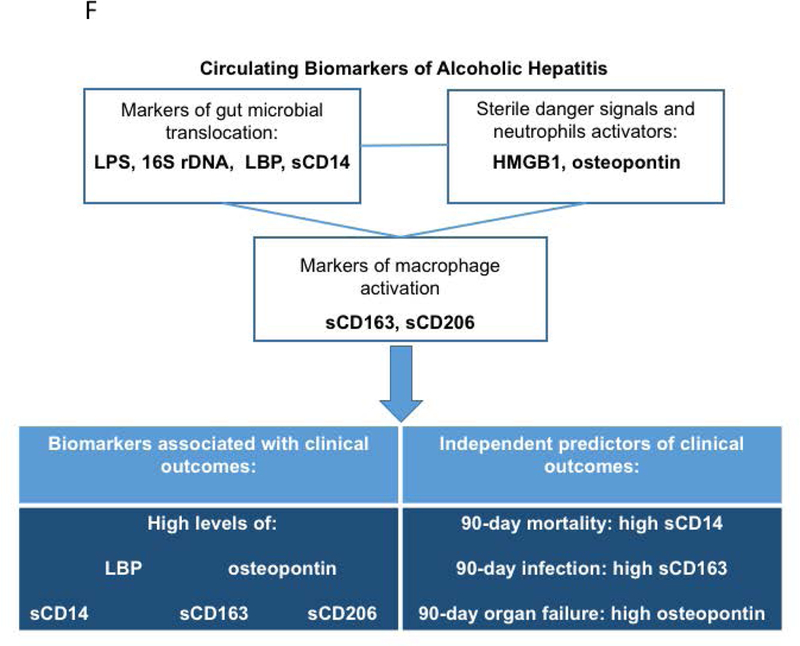
Finally, since AH was reported to have the biggest impact on short term mortality in several studies (2, 30, 50), we evaluated 90-day mortality and development of other adverse events (infection and organ failure) in association with levels of the measured biomarkers as well as clinical and laboratory parameters using predictive models. In univariate regression analysis high sCD14, sCD163, sCD206 and OPN levels were significantly associated with higher mortality, and high sCD14 was found to be the only independent predictor of mortality among all investigated parameters. Infection development was associated with high sCD163, sCD206, OPN and LBP levels in the univariate model. In addition to sCD163, AST level and presence of ascites independently predicted infection development during follow up. We also discovered that high sCD163, sCD206 and OPN were significantly associated with 90-day organ failure development in univariate analysis. Of these markers, we identified OPN as an independent predictor of organ failure development along with age and AST/ALT ratio (Fig. 5F).
In conclusion, our study shows that DAMP- and PAMP-induced immune cell (macrophage and neutrophil) activation, as evaluated by corresponding biomarkers, contributes to disease progression and clinical outcomes in AH. Our results underscore the importance of measuring the levels of circulating sCD14, LBP, OPN, sCD206 and sCD163 along with other clinical parameters that will improve the prediction of disease progression and survival in AH.
Supplementary Material
Acknowledgments
Financial Support: This work was supported by NIAAA grant U01AA021907 and U01AA021902 (GS), U01AA021893 (GS, CJM, MM, AM), U01AA021901 (CJM); NIH RO1 GM119174; P50 AA024333; R21 AR 71046; UO1 AA0026976; RO1 DK113196, Mikati Family Foundation (SD).
Abbreviations
- AH
Alcoholic Hepatitis
- AAH
acute AH
- ALD
Alcoholic Liver Disease
- ALT
Alanine aminotransferase
- AST
aspartate transaminase
- DAMPs
Danger-associated molecular patterns
- GAHS
Glasgow Alcoholic Hepatitis score
- HMGB1
High Mobility Group Protein 1
- KC
Kupffer cell
- LBP
lipopolysaccharide binding protein
- LPS
Lipopolysaccharide
- MELD
Model for End-Stage Liver Disease
- NET
Neutrophil Extracellular Trap
- OPN
osteopontin
- PAMPs
pathogen-associated molecular patterns
- sCD14, sCD163, sCD206
soluble CD14, soluble CD163, soluble CD206
- TLR4
Toll-like receptor 4
- WBC
white blood cell
Contributor Information
Banishree Saha, Email: banishree.saha@abcam.com.
David Tornai, Email: David.Tornai@umassmed.edu.
Karen Kodys, Email: Karen.Kodys@umassmed.edu.
Adeyinka Adejumo, Email: acadejumo@partners.org.
Patrick Lowe, Email: Patrick.Lowe@umassmed.edu.
Craig McClain, Email: craig.mcclain@louisville.edu.
Mack Mitchell, Email: Mack.Mitchell@UTSouthwestern.edu.
Arthur McCullough, Email: MCCULLA@ccf.org.
Dasarathy Srinivasan, Email: DASARAS@ccf.org.
Aimee Kroll-Desrosiers, Email: Aimee.Kroll-Desrosiers@umassmed.edu.
Bruce Barton, Email: Bruce.Barton@umassmed.edu.
Svetlana Radaeva, Email: sradaeva@mail.nih.gov.
Gyongyi Szabo, Email: Gyongyi.Szabo@umassmed.edu.
References
- 1.Rehm J, Samokhvalov AV, Shield KD. Global burden of alcoholic liver diseases. J Hepatol 2013;59:160–168. [DOI] [PubMed] [Google Scholar]
- 2.EASL Clinical Practice Guidelines: Management of alcohol-related liver disease. J Hepatol 2018;69:154–181. [DOI] [PubMed] [Google Scholar]
- 3.Lucey MR, Mathurin P, Morgan TR. Alcoholic hepatitis. N Engl J Med 2009;360:2758–2769. [DOI] [PubMed] [Google Scholar]
- 4.Szabo G, Petrasek J. Gut-liver axis and sterile signals in the development of alcoholic liver disease. Alcohol Alcohol 2017;52:414–424. [DOI] [PMC free article] [PubMed] [Google Scholar]
- 5.Enomoto N, Ikejima K, Bradford BU, Rivera CA, Kono H, Goto M, Yamashina S, et al. Role of Kupffer cells and gut-derived endotoxins in alcoholic liver injury. J Gastroenterol Hepatol 2000;15 Suppl:D20–25. [DOI] [PubMed] [Google Scholar]
- 6.Ju C, Mandrekar P. Macrophages and Alcohol-Related Liver Inflammation. Alcohol Res 2015;37:251–262. [PMC free article] [PubMed] [Google Scholar]
- 7.Schmidt-Arras D, Rose-John S. IL-6 pathway in the liver: From physiopathology to therapy. J Hepatol 2016;64:1403–1415. [DOI] [PubMed] [Google Scholar]
- 8.McClain CJ, Barve S, Deaciuc I, Kugelmas M, Hill D. Cytokines in alcoholic liver disease. Semin Liver Dis 1999;19:205–219. [DOI] [PubMed] [Google Scholar]
- 9.Szabo G, Kamath PS, Shah VH, Thursz M, Mathurin P. Alcohol-Related Liver Disease: Areas of Consensus, Unmet Needs and Opportunities for Further Study. Hepatology 2019. [DOI] [PubMed] [Google Scholar]
- 10.Kamath PS, Wiesner RH, Malinchoc M, Kremers W, Therneau TM, Kosberg CL, D’Amico G, et al. A model to predict survival in patients with end-stage liver disease. Hepatology 2001;33:464–470. [DOI] [PubMed] [Google Scholar]
- 11.Crabb DW, Bataller R, Chalasani NP, Kamath PS, Lucey M, Mathurin P, McClain C, et al. Standard Definitions and Common Data Elements for Clinical Trials in Patients With Alcoholic Hepatitis: Recommendation From the NIAAA Alcoholic Hepatitis Consortia. Gastroenterology 2016;150:785–790. [DOI] [PMC free article] [PubMed] [Google Scholar]
- 12.Borgan Ø Aalen–Johansen Estimator. . In: Armitage PTC, editors. In Encyclopedia of Biostatistics 2005. [Google Scholar]
- 13.Fine JP, Gray RJ. A Proportional Hazards Model for the Subdistribution of a Competing Risk. Journal of the American Statistical Association 1999;94 496–509. [Google Scholar]
- 14.Szabo G, Bala S. Alcoholic liver disease and the gut-liver axis. World J Gastroenterol 2010;16:1321–1329. [DOI] [PMC free article] [PubMed] [Google Scholar]
- 15.Szabo G, Dolganiuc A, Mandrekar P. Pattern recognition receptors: a contemporary view on liver diseases. Hepatology 2006;44:287–298. [DOI] [PubMed] [Google Scholar]
- 16.Fouts DE, Torralba M, Nelson KE, Brenner DA, Schnabl B. Bacterial translocation and changes in the intestinal microbiome in mouse models of liver disease. J Hepatol 2012;56:1283–1292. [DOI] [PMC free article] [PubMed] [Google Scholar]
- 17.Xu R, Huang H, Zhang Z, Wang FS. The role of neutrophils in the development of liver diseases. Cell Mol Immunol 2014;11:224–231. [DOI] [PMC free article] [PubMed] [Google Scholar]
- 18.Nagy LE . The Role of Innate Immunity in Alcoholic Liver Disease. Alcohol Res 2015;37:237–250. [PMC free article] [PubMed] [Google Scholar]
- 19.Bukong TN, Cho Y, Iracheta-Vellve A, Saha B, Lowe P, Adejumo A, Furi I, et al. Abnormal neutrophil traps and impaired efferocytosis contribute to liver injury and sepsis severity after binge alcohol use. J Hepatol 2018;69:1145–1154. [DOI] [PMC free article] [PubMed] [Google Scholar]
- 20.Morales-Ibanez O, Dominguez M, Ki SH, Marcos M, Chaves JF, Nguyen-Khac E, Houchi H, et al. Human and experimental evidence supporting a role for osteopontin in alcoholic hepatitis. Hepatology 2013;58:1742–1756. [DOI] [PMC free article] [PubMed] [Google Scholar]
- 21.Koh A, da Silva AP, Bansal AK, Bansal M, Sun C, Lee H, Glogauer M, et al. Role of osteopontin in neutrophil function. Immunology 2007;122:466–475. [DOI] [PMC free article] [PubMed] [Google Scholar]
- 22.Klune JR, Dhupar R, Cardinal J, Billiar TR, Tsung A. HMGB1: endogenous danger signaling. Mol Med 2008;14:476–484. [DOI] [PMC free article] [PubMed] [Google Scholar]
- 23.Bala S, Csak T, Saha B, Zatsiorsky J, Kodys K, Catalano D, Satishchandran A, et al. The pro-inflammatory effects of miR-155 promote liver fibrosis and alcohol-induced steatohepatitis. J Hepatol 2016;64:1378–1387. [DOI] [PMC free article] [PubMed] [Google Scholar]
- 24.Gordon S, Pluddemann A, Martinez Estrada F. Macrophage heterogeneity in tissues: phenotypic diversity and functions. Immunol Rev 2014;262:36–55. [DOI] [PMC free article] [PubMed] [Google Scholar]
- 25.Azad AK, Rajaram MV, Schlesinger LS. Exploitation of the Macrophage Mannose Receptor (CD206) in Infectious Disease Diagnostics and Therapeutics. J Cytol Mol Biol 2014;1. [DOI] [PMC free article] [PubMed] [Google Scholar]
- 26.Fabriek BO, van Bruggen R, Deng DM, Ligtenberg AJ, Nazmi K, Schornagel K, Vloet RP, et al. The macrophage scavenger receptor CD163 functions as an innate immune sensor for bacteria. Blood 2009;113:887–892. [DOI] [PubMed] [Google Scholar]
- 27.Gronbaek H, Rodgaard-Hansen S, Aagaard NK, Arroyo V, Moestrup SK, Garcia E, Sola E, et al. Macrophage activation markers predict mortality in patients with liver cirrhosis without or with acute-on-chronic liver failure (ACLF). J Hepatol 2016;64:813–822. [DOI] [PubMed] [Google Scholar]
- 28.Kazankov K, Barrera F, Moller HJ, Bibby BM, Vilstrup H, George J, Gronbaek H. Soluble CD163, a macrophage activation marker, is independently associated with fibrosis in patients with chronic viral hepatitis B and C. Hepatology 2014;60:521–530. [DOI] [PubMed] [Google Scholar]
- 29.D’Amico G, Morabito A, D’Amico M, Pasta L, Malizia G, Rebora P, Valsecchi MG. Clinical states of cirrhosis and competing risks. J Hepatol 2018;68:563–576. [DOI] [PubMed] [Google Scholar]
- 30.Dunn W, Jamil LH, Brown LS, Wiesner RH, Kim WR, Menon KV, Malinchoc M, et al. MELD accurately predicts mortality in patients with alcoholic hepatitis. Hepatology 2005;41:353–358. [DOI] [PubMed] [Google Scholar]
- 31.Sandahl TD, Gronbaek H, Moller HJ, Stoy S, Thomsen KL, Dige AK, Agnholt J, et al. Hepatic macrophage activation and the LPS pathway in patients with alcoholic hepatitis: a prospective cohort study. Am J Gastroenterol 2014;109:1749–1756. [DOI] [PubMed] [Google Scholar]
- 32.Mookerjee RP, Stadlbauer V, Lidder S, Wright GA, Hodges SJ, Davies NA, Jalan R. Neutrophil dysfunction in alcoholic hepatitis superimposed on cirrhosis is reversible and predicts the outcome. Hepatology 2007;46:831–840. [DOI] [PubMed] [Google Scholar]
- 33.Leliefeld PH, Koenderman L, Pillay J. How Neutrophils Shape Adaptive Immune Responses. Front Immunol 2015;6:471. [DOI] [PMC free article] [PubMed] [Google Scholar]
- 34.Taylor NJ, Nishtala A, Manakkat Vijay GK, Abeles RD, Auzinger G, Bernal W, Ma Y, et al. Circulating neutrophil dysfunction in acute liver failure. Hepatology 2013;57:1142–1152. [DOI] [PubMed] [Google Scholar]
- 35.Arai M, Yokosuka O, Kanda T, Fukai K, Imazeki F, Muramatsu M, Seki N, et al. Serum osteopontin levels in patients with acute liver dysfunction. Scand J Gastroenterol 2006;41:102–110. [DOI] [PubMed] [Google Scholar]
- 36.Lorena D, Darby IA, Gadeau AP, Leen LL, Rittling S, Porto LC, Rosenbaum J, et al. Osteopontin expression in normal and fibrotic liver. altered liver healing in osteopontin-deficient mice. J Hepatol 2006;44:383–390. [DOI] [PubMed] [Google Scholar]
- 37.Brown KA, Brain SD, Pearson JD, Edgeworth JD, Lewis SM, Treacher DF. Neutrophils in development of multiple organ failure in sepsis. Lancet 2006;368:157–169. [DOI] [PubMed] [Google Scholar]
- 38.Hreggvidsdottir HS, Ostberg T, Wahamaa H, Schierbeck H, Aveberger AC, Klevenvall L, Palmblad K, et al. The alarmin HMGB1 acts in synergy with endogenous and exogenous danger signals to promote inflammation. J Leukoc Biol 2009;86:655–662. [DOI] [PubMed] [Google Scholar]
- 39.Maroso M, Balosso S, Ravizza T, Liu J, Aronica E, Iyer AM, Rossetti C, et al. Toll-like receptor 4 and high-mobility group box-1 are involved in ictogenesis and can be targeted to reduce seizures. Nat Med 2010;16:413–419. [DOI] [PubMed] [Google Scholar]
- 40.Bianchi ME. HMGB1 loves company. J Leukoc Biol 2009;86:573–576. [DOI] [PubMed] [Google Scholar]
- 41.Saha B, Bruneau JC, Kodys K, Szabo G. Alcohol-induced miR-27a regulates differentiation and M2 macrophage polarization of normal human monocytes. J Immunol 2015;194:3079–3087. [DOI] [PMC free article] [PubMed] [Google Scholar]
- 42.Saha B, Momen-Heravi F, Kodys K, Szabo G. MicroRNA Cargo of Extracellular Vesicles from Alcohol-exposed Monocytes Signals Naive Monocytes to Differentiate into M2 Macrophages. J Biol Chem 2016;291:149–159. [DOI] [PMC free article] [PubMed] [Google Scholar]
- 43.Kim SY, Jeong JM, Kim SJ, Seo W, Kim MH, Choi WM, Yoo W, et al. Pro-inflammatory hepatic macrophages generate ROS through NADPH oxidase 2 via endocytosis of monomeric TLR4-MD2 complex. Nat Commun 2017;8:2247. [DOI] [PMC free article] [PubMed] [Google Scholar]
- 44.Lee J, French B, Morgan T, French SW. The liver is populated by a broad spectrum of markers for macrophages. In alcoholic hepatitis the macrophages are M1 and M2. Exp Mol Pathol 2014;96:118–125. [DOI] [PMC free article] [PubMed] [Google Scholar]
- 45.Etzerodt A, Rasmussen MR, Svendsen P, Chalaris A, Schwarz J, Galea I, Moller HJ, et al. Structural basis for inflammation-driven shedding of CD163 ectodomain and tumor necrosis factor-alpha in macrophages. J Biol Chem 2014;289:778–788. [DOI] [PMC free article] [PubMed] [Google Scholar]
- 46.Sandahl TD, Stoy SH, Laursen TL, Rodgaard-Hansen S, Moller HJ, Moller S, Vilstrup H, et al. The soluble mannose receptor (sMR) is elevated in alcoholic liver disease and associated with disease severity, portal hypertension, and mortality in cirrhosis patients. PLoS One 2017;12:e0189345. [DOI] [PMC free article] [PubMed] [Google Scholar]
- 47.Andersen ES, Rodgaard-Hansen S, Moessner B, Christensen PB, Moller HJ, Weis N. Macrophage-related serum biomarkers soluble CD163 (sCD163) and soluble mannose receptor (sMR) to differentiate mild liver fibrosis from cirrhosis in patients with chronic hepatitis C: a pilot study. Eur J Clin Microbiol Infect Dis 2014;33:117–122. [DOI] [PubMed] [Google Scholar]
- 48.Kjaergaard AG, Rodgaard-Hansen S, Dige A, Krog J, Moller HJ, Tonnesen E. Monocyte expression and soluble levels of the haemoglobin receptor (CD163/sCD163) and the mannose receptor (MR/sMR) in septic and critically ill non-septic ICU patients. PLoS One 2014;9:e92331. [DOI] [PMC free article] [PubMed] [Google Scholar]
- 49.Vergis N, Khamri W, Beale K, Sadiq F, Aletrari MO, Moore C, Atkinson SR, et al. Defective monocyte oxidative burst predicts infection in alcoholic hepatitis and is associated with reduced expression of NADPH oxidase. Gut 2017;66:519–529. [DOI] [PMC free article] [PubMed] [Google Scholar]
- 50.Mitchell MC, Friedman LS, McClain CJ. Medical Management of Severe Alcoholic Hepatitis: Expert Review from the Clinical Practice Updates Committee of the AGA Institute. Clin Gastroenterol Hepatol 2017;15:5–12. [DOI] [PMC free article] [PubMed] [Google Scholar]
Associated Data
This section collects any data citations, data availability statements, or supplementary materials included in this article.