Abstract
A new apparatus for measuring the thermal conductivity of fluids is described. This is an absolute method utilizing a transient hot wire. Measurements are made with a 12.7 μm diameter platinum wire at real times of up to 1 second. The data acquisition system includes a minicomputer and a digital voltmeter. The experimental core of the system incorporates a compensating hot wire in a Wheatstone bridge circuit. The cell containing the core of the apparatus is designed to accommodate pressures from 0 to 70 MPa and temperatures from 70 to 320 K. Oxygen was measured over a wide range of physical states including the dilute gas, the moderately dense gas, the near critical region, the compressed liquid states, and the vapor at temperatures below the critical temperature. Performance checks of the apparatus were conducted with nitrogen, helium and argon. Measurement of rare gases allows a direct comparison to the kinetic theory of gases through the viscosity. A second check looks at the variation of the measured thermal conductivity as a function of the applied power. The precision (2 σ) of the new system is between 0.5 and 0.8 percent for wire temperature transients of 4 to 5 K, while the accuracy is estimated at around 1.5 percent.
Keywords: Helium, hot wire, nitrogen, pressure, temperature, thermal conductivity, transient
1. Introduction
Thermal conductivity values are necessary whenever a heat transfer problem is to be evaluated. In addition, thermal conductivity is a property of fundamental interest in developing the theory of fluids. Accurate measurements of thermal conductivity are of considerable difficulty. Methods and geometries abound each with its adherents and its inherent drawbacks. The steady state hot wire experiment is one of the older, well established methods. The transient hot wire method, however, has come into its own only with recent advances in digital electronics. The evolution of the modern transient hot wire experiment can be traced from the early experiments of Pittman [1]1, Haarman [2], and Mani [3]. However, the major exposition of both theory and application of this method was accomplished by Kestin and his coworkers during the last decade [4–9] for the gas phase. Similar instruments have been used by Wakeham and his coworkers for both gas and liquid measurements [10, 11] and by de Castro and his coworkers for liquid measurements [12–13].
2. Method
A hot wire system normally involves a vertical, cylindrical symmetry where the wire serves both as heating element and as thermometer. Almost without exception platinum is the wire of choice. The mathematical model that one attempts to approximate is that of an infinite line source of heat suspended vertically in an infinite medium. The method is labeled transient because the power is applied abruptly and the measurement is of short duration. The working equation is based on a specific solution of Fourier’s law and can be found in standard texts (see for example reference [14], page 261).
| (1) |
Where T(t) is the temperature of the wire at time t;
Tref is the reference temperature, the temperature of the cell;
q is the applied power;
λ is the thermal conductivity of the fluid, a function of both temperature and density;
K is the thermal diffusivity of the fluid, i.e., K = λ/ϱCp. K is normally taken at the temperature Tref and is nearly constant since the fluid properties do not change drastically with a small increase in temperature;
a is the radius of the wire; and
ℓn C = γ where γ is Euler’s constant.
The relation given by eq (1) implies a straight line for a plot of ΔT versus ℓn(t). In practice systematic deviations occur at both short and long times. However, for each experimental measurement there exists a range of times over which eq (1) is valid, that is the relation between ΔT and ℓn(t) is linear. This range of validity is determined from 250 measured ΔT-t pairs by selecting a beginning time t1 and an ending time t2. The slope of the ΔT versus ℓn(t) relation is obtained over the valid range, i.e., between times t1 and t2, and using the applied power the thermal conductivity is calculated from eq (1). The temperature assigned to the measurement of λ is given by
| (2) |
The density assigned to the measurement of λ is taken from an equation of state using an experimentally measured pressure and the temperature assigned above. The equations of state used for nitrogen and helium are given in subsequent sections. The experimentally determined temperature rise of the wire is ΔTw. A number of corrections account for the departure of the real instrument from the ideal model:
| (3) |
These corrections δTi have been fully described elsewhere [5]; the most important at lower times is δT1, the effect of the finite heat capacity of the wire.
3. Apparatus
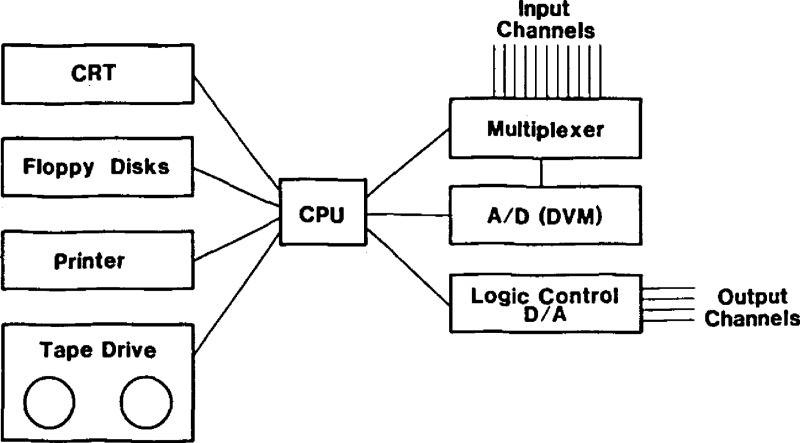
The various elements of the apparatus, the hot wires, the high pressure cell and wire supports, the Wheatstone bridge, the cryostat, the measuring and control circuitry, the sample handling system, and the minicomputer are described here and in figures 1–6.
Figure 1.
The high pressure cell and wire support unit.
Figure 6.
The minicomputer.
3.1. The Hot Wires
Platinum wire is the normal choice because the resistance-temperature relation of platinum is well known [15]. In the resistance thermometer grade of the wire the smallest sizes available commercially are 7 μm, 12.7 μm, and 25.4 μm in diameter. The smallest of these was considered to be too fragile for the present application, the largest would not provide a sufficiently large resistance for the cell size under consideration. Therefore, the 12.7 μm diameter wire was chosen for both primary and compensating hot wire. The long or primary hot wire is approximately 10 cm in length. Its resistance varies from about 20 Ω at 76 K to 90 Ω at 298 K. The short or compensating wire is approximately 5 cm in length and its resistance varies from 10 to 45 Ω. To allow for thermal expansion over the range of operating temperatures the wires are mounted with a small weight attached at the bottom. The wires are mounted in the hard drawn (as received) state, because in the annealed state platinum has a rather low tensile strength [16].
3.2. High Pressure Cell and Wire Supports
The cell has been designed to withstand pressures of up to 70 MPa. In addition, if the cell is to be isothermal, its thermal conductivity should be high. Accordingly, the cell is made from beryllium copper, a material which meets these contradictory requirements best. Cell sizing, cell closure, and wire support are shown in figure 1. The cell is quite similar to those used in other experiments in this laboratory [17–20]. It is mounted with the closure facing down. Three solid steel pins serve as electrical leads. They pass through the high pressure closure (stainless steel) and are insulated from it using polymide ferrules [21]. The capillary which admits the sample is soldered into the top of the cell. Much of the interior of the cell is filled by the wire support unit which is made from copper and includes a centerpiece, two covers, a top and a bottom cap. The wire support unit is mounted on the high pressure closure. When assembled the wire support unit provides two cylindrical wells 9 mm in diameter and 11 cm long to accomodate the hot wires. Mounted in the top cap with friction fit are two 5 mm sections of a small coaxial cable. The hot wires are soft soldered to the center leads of these coaxial sections. To the bottom of the long hot wire is soldered a short section of teflon covered wire which terminates in a 4–80 brass nut, the weight. The teflon covered section provides isulation between bottom cap and the extension of the long hot wire as well as centering for it. The long hot wire section is connected to one of the steel pins by a small loop of 12.7 μm copper wire. The short hot wire is soft soldered to the other coaxial section in the top cap. To its bottom end a short length of copper wire centered in a second 4–80 brass nut is soldered. The leads on the short hot wire side are completed by a loop of 12.7 μm copper wire which connects to a 5 cm length of coaxial cable. This section of coax is friction fit into the bottom cap and is sufficiently rigid to stand alone. A second loop of copper connects this coax to the second steel pin. Long and short hot wire sections are connected together above the top cap with the center tap soldered in the middle of this connection. The center tap is a 11 cm long section of the coax which at the bottom end is connected to the third steel pin.
Liquid oxygen safety is one of the additional design considerations for the cell since the interior of the cell will be exposed to very high pressure 70 MPa (10,000 psi) liquid. The materials directly exposed to liquid oxygen have been limited to beryllium copper, copper, stainless steel, silver, teflon, and a polyimide (kapton) all of which have been found to be “oxygen compatible” [22]. Cleaning procedures for cell, wire supports, capillary and sample handling system were extensive [23].
3.3. The Wheatstone Bridge
Precision measurements of resistance can be made by using a four lead technique or by using a Wheatstone bridge. In the present apparatus we follow the general development of the hot wire instrument pioneered by Haarman [2], de Groot, et al. [4], Assael, et al. [10] and de Castro, et al. [12] and use a Wheatstone bridge to measure resistances. End effect compensation is provided by placing the long hot wire in one working arm of the bridge and a shorter, compensating wire on the other. In contrast to other instruments where values of time are measured in the present instrument the voltage developed across the bridge is measured directly as a function of time with a fast response digital voltmeter (DVM). The DVM is controlled by a minicomputer which also handles the switching of the power and the logging of the data. The automation of the voltage measurement follows the work of Mani [3] who used a similar arrangement with a transient hot wire cell to measure resistance by the four lead technique rather than using a bridge.
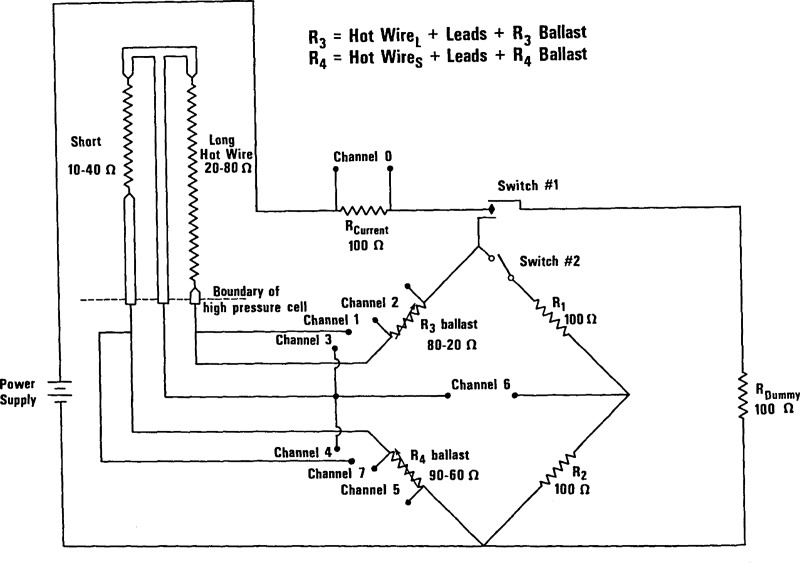
Figure 2 shows the Wheatstone bridge circuit. Each arm of the bridge is designed to be 100 Ω, two arms R1 and R2 are standard resistors. The resistance in each of the other arms R3 and R4 is a composite of the hot wire, the leads into the cryostat and an adjustable ballast resistor. The leads are roughly 6 Ω at room temperature and 2 Ω when the cell is at 76 K. The ballast resistors allow each working arm to be adjusted to a value of 100 Ω.
Figure 2.
The Wheatstone bridge circuit.
The measurement of thermal conductivity for a single point is accomplished in two phases. In the First phase the bridge is balanced as close to null as is practical. To start with, switch 1 is turned from dummy to the bridge while switch 2 is open. With a very small applied voltage, 0.1 Volts normally, and the cell essentially at constant temperature, the voltages are read on channels 0 through 7. The lead, hot wire, and ballast resistances are calculated from the ratios of the appropriate channel voltgage to the voltage across the standard 100 Ω resistor on channel zero. The ballasts are adjusted until each leg is approximately 100 Ω. Finally, with switch 2 closed, the bridge null is checked on channel 6. The second phase incorporates the actual thermal conductivity measurement. The power supply is set to the applied power desired, switch 2 is closed, and switch 1 is switched from dummy to bridge. The voltage developed across the bridge as a function of time is read on channel 6 and stored. The basic data is a set of 250 readings taken at 3 ms intervals. Finally the voltage on channel 0 is read to determine the exact applied power, and the power is switched back to the dummy resistor.
3.4. The Cryostat
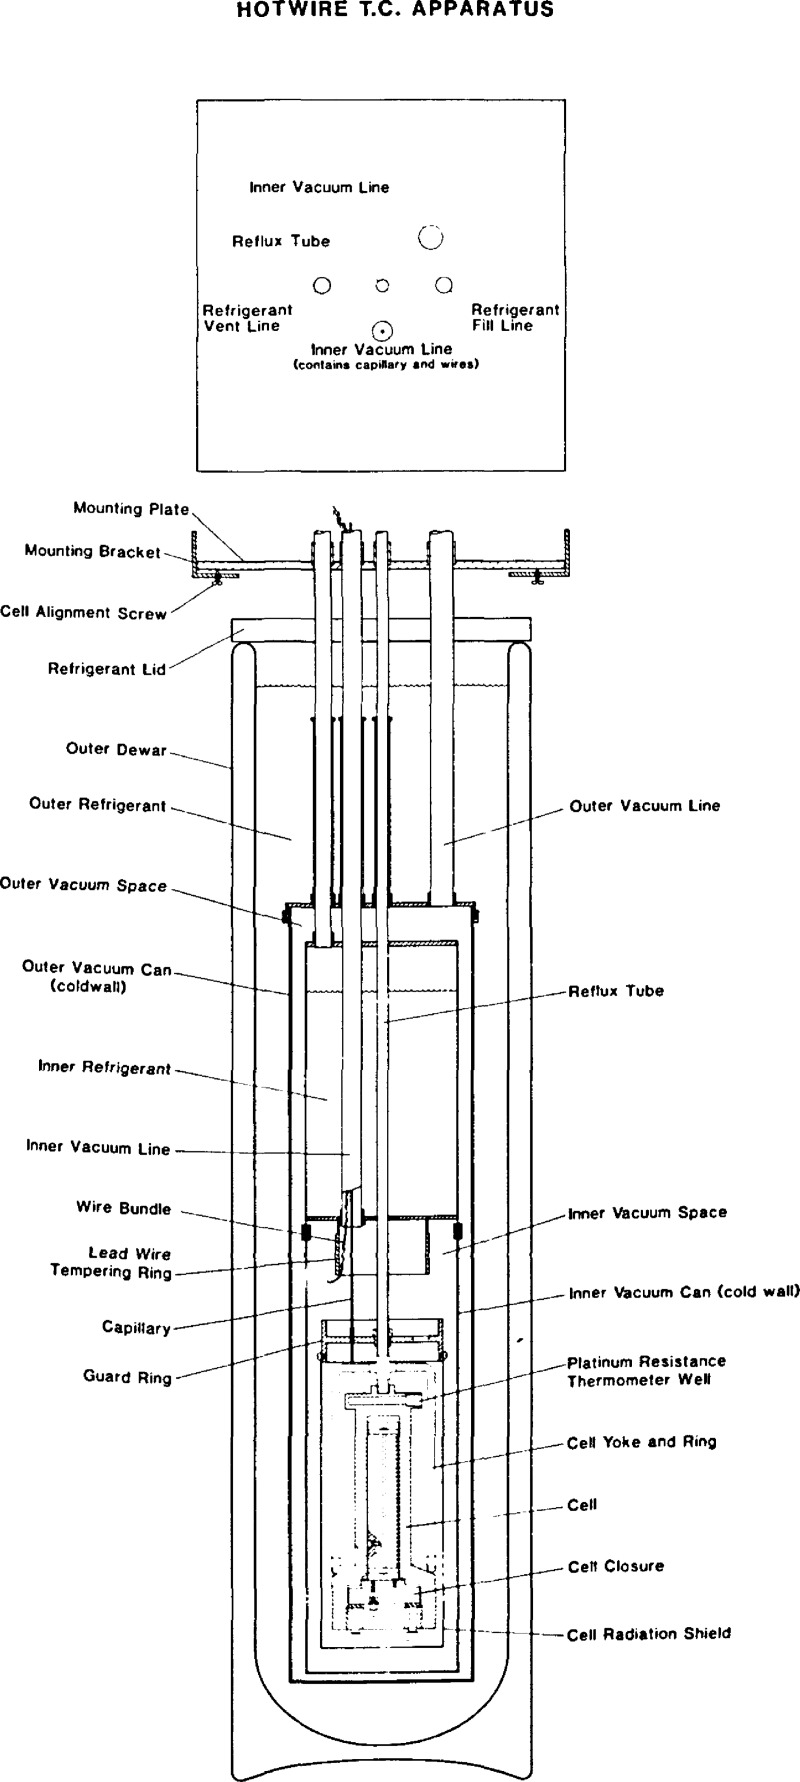
The cryostat for the apparatus, shown in Figure 3, is adapted from a general design First used in a PVT apparatus at this laboratory [24]. The cell is connected by the reflux tube to the inner refrigerant tank. The reflux tube is filled with gas which sometimes corresponds to the liquid used as the refrigerant. Varying the gas pressure changes the amount of refrigeration applied to the cell. A cooling yoke and ring insure that the refrigeration is applied primarily at the bottom of the cell. In this way a slight gradient can be maintained between cell top and cell bottom. To avoid convection inside the cell we normally maintain the cell bottom slightly colder than the cell top. The cell and its radiation shield is located in a vacuum environment. A tube which serves as the inner vacuum line also admits lead wires and the capillary into the inner vacuum space surrounding the cell. The leads are tempered on two rings, one is attached directly to the inner refrigeration tank, the other is the guard ring which is attached to the reflux tube. The cell radiation shield in turn is attached to the guard ring. The inner refrigerant tank is insulated by the outer vacuum system, which in turn is protected by the outer refrigerant, usually liquid nitrogen, in a dewar. All of the various access tubes, fill and vent lines, and vacuum lines pass through the mounting plate which rests on the mounting bracket attached to the wall. Cell alinement is achieved by adjustment of three set screws.
Figure 3.
The cryostat.
3.5. Cryostat Temperature Control
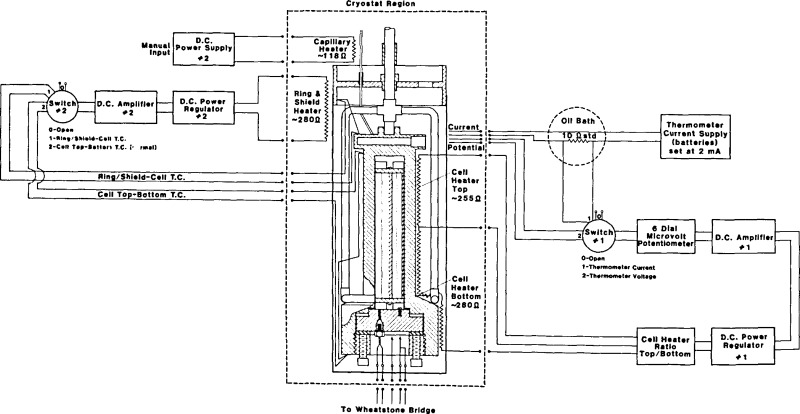
A diagram of this circuitry is shown in figure 4. The cell temperature is monitored with the platinum resistance thermometer which is mounted in the cell. The PRT resistance is measured by the four lead method as a ratio against a 10 Ω standard using a microvolt potentiometer, a stable current supply, and a high gain dc null detector. The amplified output of the detector is used in a feedback loop to provide power to the cell heater [25]. The ratio of power applied to cell top and cell bottom is monitored with a thermocouple and adjusted by hand. The temperature of the guard ring and cell radiation shield are maintained close to the cell temperature by the use of a second feedback loop. This loop includes a differential thermocouple and a low level dc voltage detector whose amplified output is routed to a power supply which in turn feeds the ring and shield heater. A separate, manual heater is mounted on the capillary. This heater is operated intermittently as needed. Its function is to ensure that the sample does not freeze in the capillary should by chance some unusual temperature conditions prevail at some spot in the capillary.
Figure 4.
Block diagram of temperature measurement and cryostat control circuits.
3.6. Sample Handling and Vacuum Systems
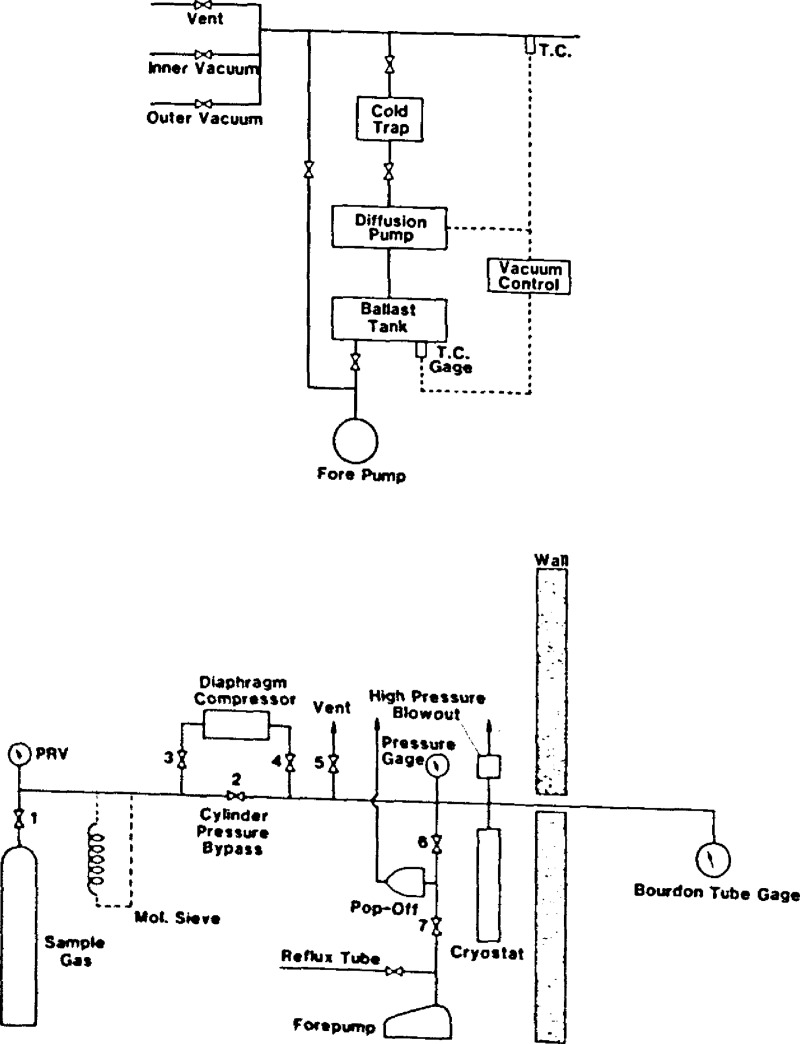
Block diagrams for both systems are shown in figure 5. The vacuum system is conventional except for an automatic back pressure control with alarm and solenoid valve. These items were installed as a safety precaution should the silver plated copper O-ring in the cell closure spring a leak and discharge oxygen into the vacuum space.
Figure 5.
Vacuum and sample handling systems.
The sample handling system was also designed with oxygen in mind. It consists of the sample from a gas bottle, a molecular sieve to capture moisture, and a small diaphragm compressor as pressure intensifier. The compressor uses an oxygen compatible oil and has specially hardened check valves and seals. A pressure relief valve was provided in the cell pump-out line to protect against the possibility of an accidental oxygen overpressure, even though the forepump is charged with an oxygen compatible pump oil. With a few changes the sample system was able to handle a liquid sample, propane. Ordinarily the compressor requires an input pressure of about 5 MPa (700 psi). However, if liquid is provided at the intake and sufficient time between strokes is allowed, then the compressor handles a liquid sample quite well. For propane, removing the molecular sieve and turning the supply bottle upside down ensured a direct flow of liquid.
3.7. The Minicomputer
A simplified block diagram of the minicomputer and its peripherals is shown in figure 6. The CPU uses 18 bits per word with BASIC as the operational language. Program storage is on floppy disks, program input on the CRT, program listings are handled on the printer. Data can be displayed on the CRT and on the printer, and can be stored on floppy disk or magnetic tape. Input voltages, i.e., voltages to be read are routed from the 50 input channels by the multiplexer to the DVM where the analog to digital (A/D) conversion is effected. Output voltages, i.e., voltages to be used for experimental control are processed by the logic control unit where the digital to analog conversion takes place. These voltages are available at any of six output channels.
4. Data Measured
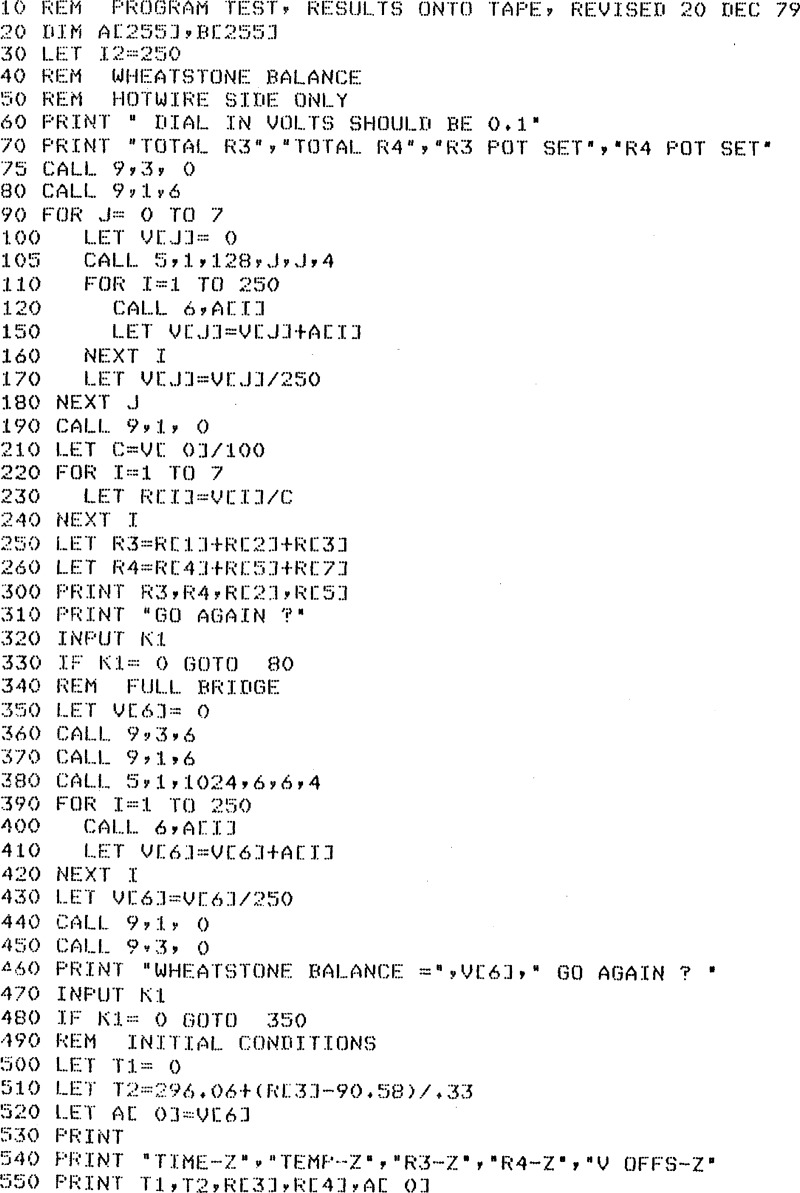
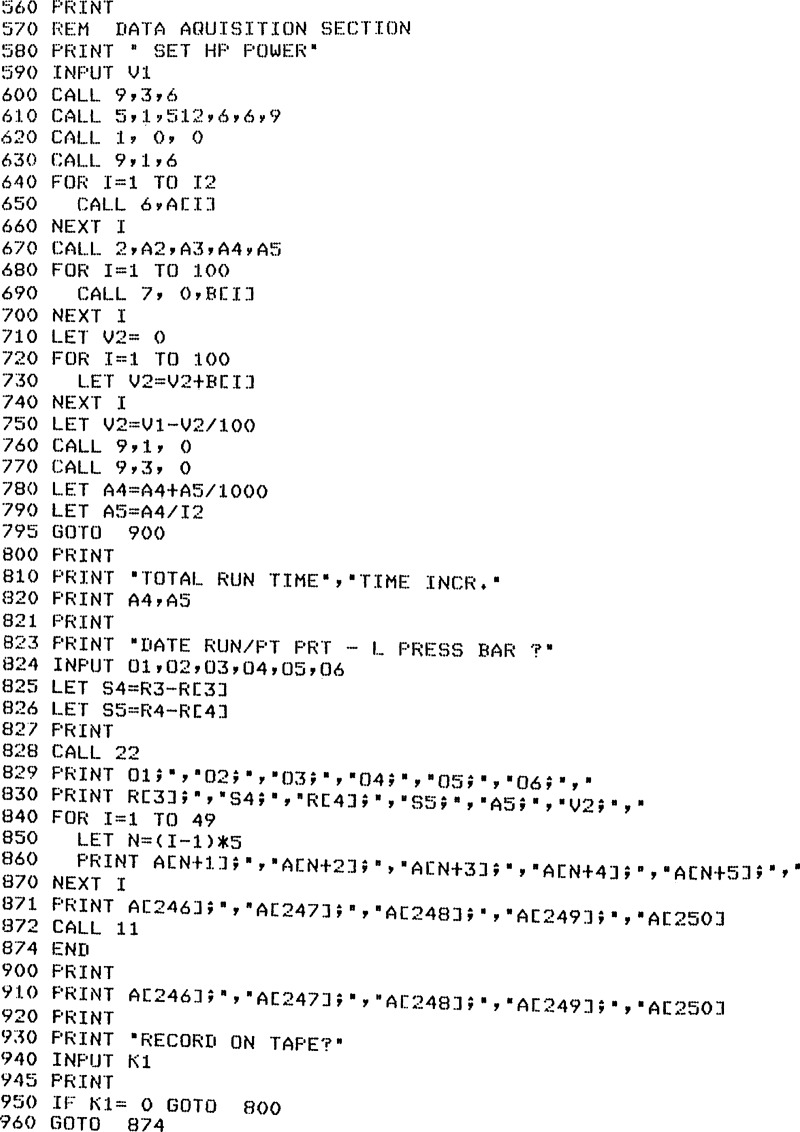
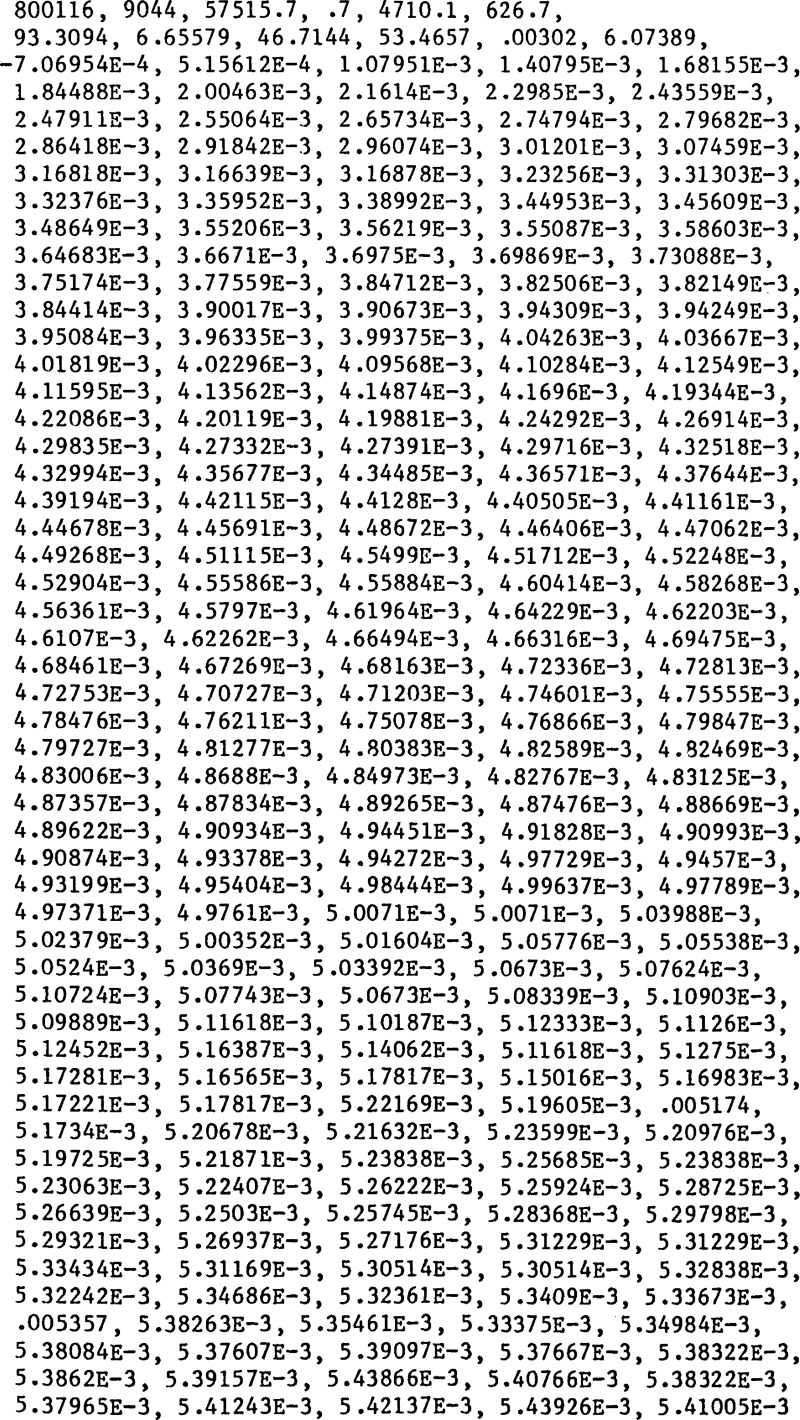
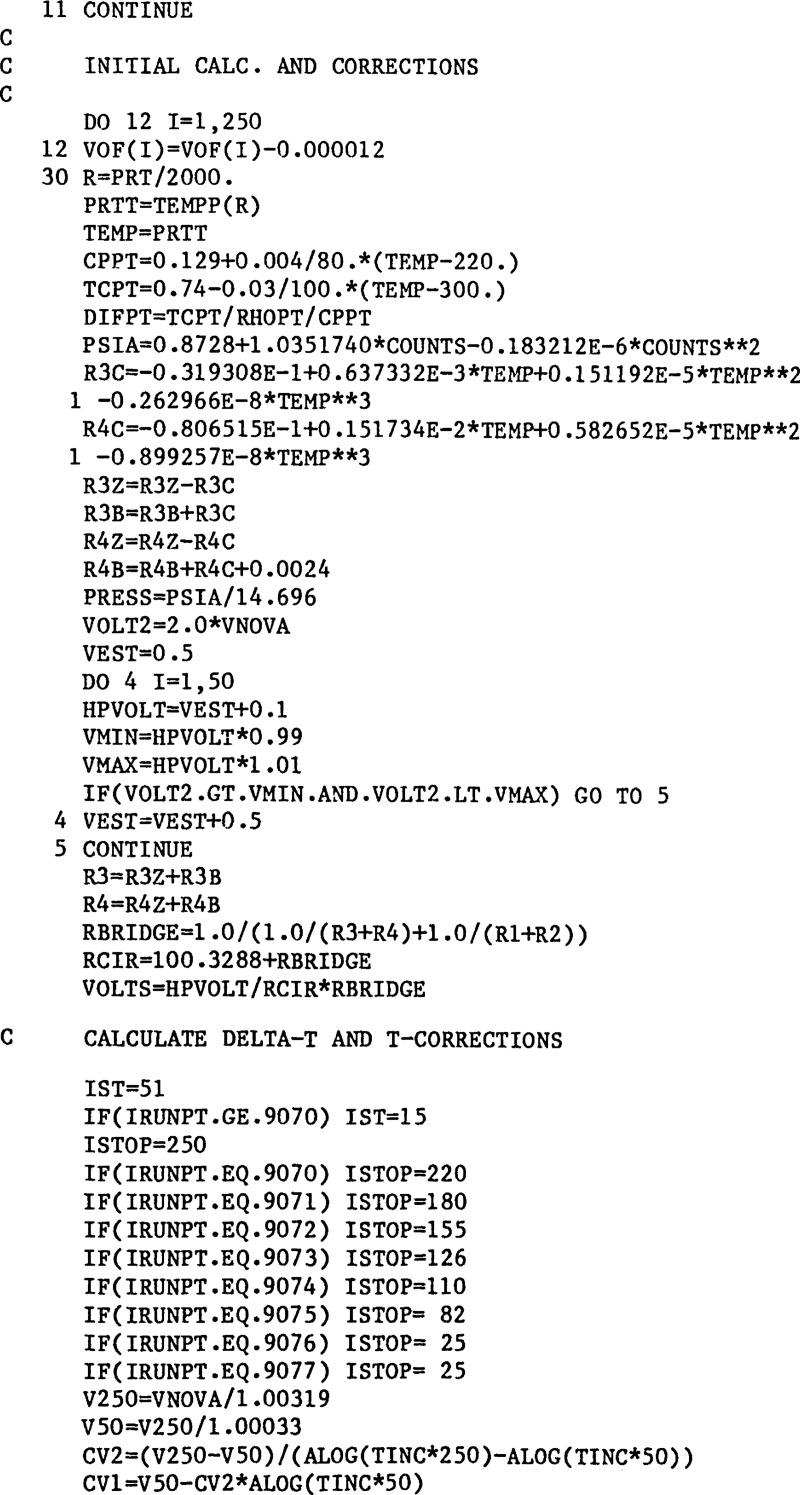
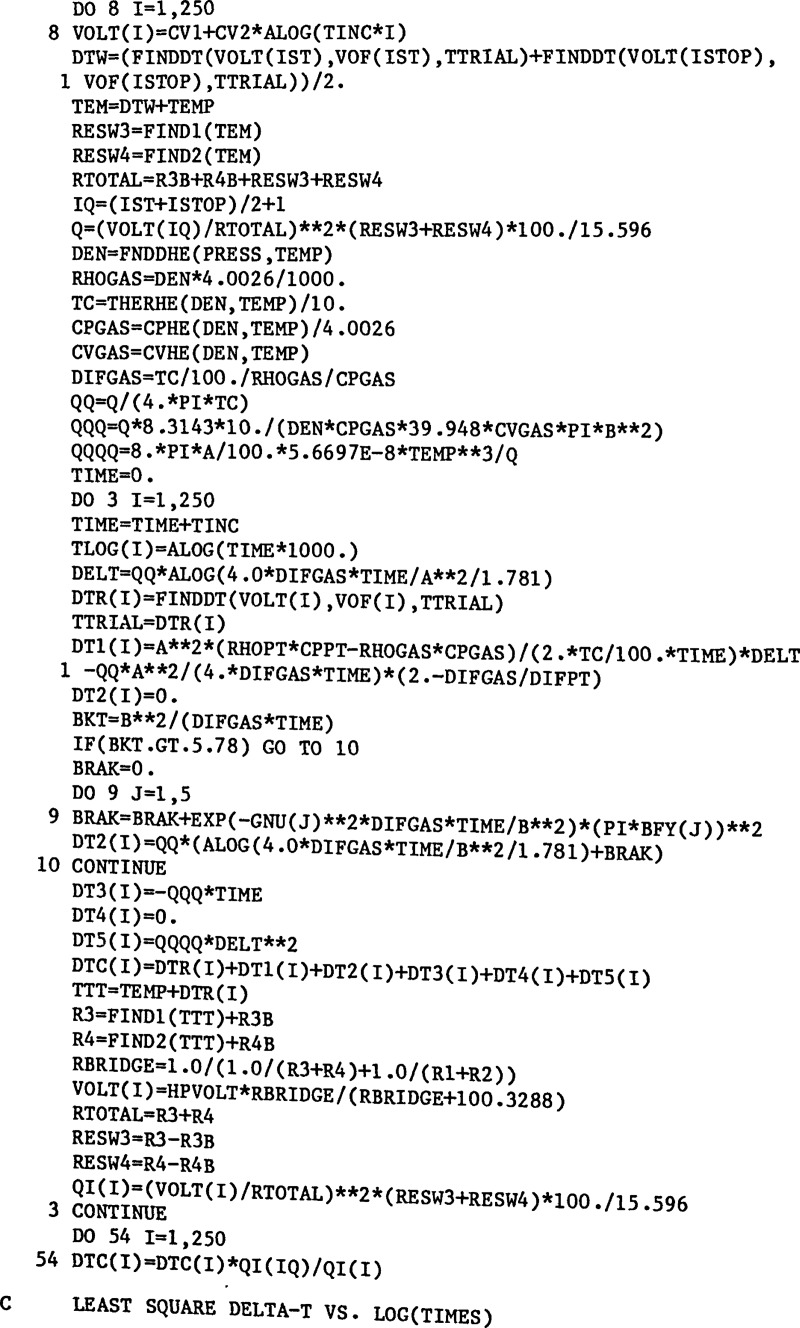
In the course of making a single thermal conductivity measurement a large number of variables are measured and recorded. The minicomputer program which controls the measurement is shown in appendix I. An example of a data file as assembled in the minicomputer and then transferred to magnetic tape is shown in appendix II. The first two lines of the data file are keyed in through the CRT. These lines contain the date, run and point number, the PRT reading from the microvolt potentiometer with the last digit repeated, the reading of the pressure gage, the barometer reading, the wire resistance for both long and short hot wire, the sums of lead and ballast resistance for both long and short hot wire sections, the time increment at which the voltage readings were taken, and lastly the voltage applied to the bridge. The remainder of the file contains the set of 250 voltage readings across the Wheatstone bridge.
4.1. Cell Temperature
The PRT is a standard capsule thermometer. It has been calibrated by the NBS temperature section. The voltage read across the 10 Ω standard resistor is used to adjust the thermometer current so that a current of 1 ma is flowing in the PRT circuit. A second voltage reading across the PRT proper allows its resistance to be calculated. The second voltage reading is the only value that is keyed into the CRT. The error in the cell temperature as established from a calibration of the microvolt potentiometer used is 0.001 K at 80 K increasing to 0.007 K at 292 K.
4.2. Cell Pressure
The cell pressure is read with a commercial high precision steel bourdon tube. The unit was selected because it is “compatible” with high pressure oxygen. The unit is calibrated by the vendor with the calibration traceable to NBS. A digital readout is provided through an optical sensor, with the units of the readout in “counts.” At the maximum pressure 96000 counts correspond to approximately 68 MPa. At the higher pressures the bourdon tube displays hysteresis under loading as a function of time. It is this hysteresis that gives rise to the stated uncertainty of ± 0.03 MPa. The pressure gage calibration was represented by a low order polynomial for use in the data reduction program. The error attributable to this curve fit is well within the stated error of the gage. Vapor pressure checks of the gage at approximately 1 MPa with both oxygen [26] and propane [27] confirm the calibration at the lower end of the pressure scale.
4.3. Resistances
Direct resistance measurements are made while balancing the Wheatstone bridge. The resistances of the hot wires, of the leads, and of the ballast resistors are measured with the DVM set at the optimum gain. The resistance measurements are made using the four terminal method; the voltage across a standard 100 Ω resistor defines the current in the circuit and the voltage reading across the unknown defines the resistance in question. In actual practice each voltage reading is the average of 100 individual readings. Each hot wire section measurement must be corrected for leads inside the high pressure cell which are short pieces of copper and steel wire. The corrections were calculated from wire dimensions and tabulated resistivities [28]. They are estimated to be 0.22 Ω for the long hot wire section and 0.65 Ω for the short hot wire section at room temperature. The corrections are handled in the data reduction program and are further adjusted for changes in bath temperature.
In order to obtain the temperature increase of the platinum wires from the corresponding resistance increase, we need to know the variation of resistance with temperature for both wires. It has been shown in the past [8, 12, 13, 29] that an in situ calibration of the wires is desirable and also that the resistances per unit length of both wires should be the same to within about 2 percent.
The wire resistances measured at essentially zero applied power in the balancing of the bridge together with the cell temperatures as determined from the platinum resistance thermometer are taken as the in situ calibration of the wires. During measurements on oxygen [26] some 1800 values were collected for each wire in the temperature range 76–320 K with pressures from atmospheric to about 70 MPa. The resistance relation for each wire is represented by an analytical function of the type
| (4) |
where T is the temperature in kelvin and P the pressure gage reading. The pressure dependence is small but statistically significant and reflects the fact that the calibration measurements are made with a small applied voltage of 0.1 volts. Coefficients for eq (4) were determined in two ranges of temperature with some overlap in the range of the fits as shown in table 1. The standard deviation of the resistance measurements as well as the equivalent temperature errors are shown in table 1. The long wire has a length of 10.453 cm at room temperature, the short wire one of 5.143 cm. Both wires have a nominal diameter of 0.001270 ± 0.000001 cm, thus the radius a in eq (1) is 0.000625 cm. If we use these values and the measured resistances we can calculate a resistivity of 10.07 × 10⁻⁶ Ω-cm at 273.15 K compared to a best value of 9.60 × 10⁻⁶ Ω-cm for an annealed high purity specimen [28]. The difference is ascribed to the hard drawn condition of our wires. The α of these wires, defined as (R(373.15)−R(273.15)/(100. R(273.15)) is 0.0037944 which is lower than the value 0.003925 required for use in an annealed platinum resistance thermometer [26]. Finally, we evaluate
| (5) |
and compare σL and σS in the experimental range. Table 2 shows the percent difference between σL and σS as a function of T. It is apparent that for the lower temperatures the correction proposed by Kestin and Wakeham [8] would apply except that in this apparatus independent calibrations for both long and short hot wire are used.
Table 1.
Calibration Constants of Wires.
| Temperature Range of L.S. Fit | Number of Points in Fit | Applicable Temperature Range | A(Ω) | B(Ω K−1) | Coefficients C(Ω K−2) | D(Ω (MPa)−1) | Standard Deviation of Fit, One Sigma | Equivalent Error in T | |
|---|---|---|---|---|---|---|---|---|---|
| Long wire | 76 – 158 K | 707 | 77 – 150 K | −10.231206 | 0.3670809 | −0.9903371 × 10⁻⁴ | −7.796325 × 10⁻⁴ | 0.01 Ω | 0.023 K |
| 142 – 305 K | 1684 | 150 – 315 K | − 9.065472 | 0.3534445 | −0.5923443 × 10⁻⁴ | −1.401463 × 10⁻³ | 0.019 Ω | 0.054 K | |
| Short wire | 76 – 158 K | 707 | 77 – 150 K | − 5.057558 | 0.1823527 | −0.5257280 × 10⁻⁴ | −4.144377 × 10⁻⁴ | 0.01 Ω | 0.059 K |
| 142 – 305 K | 1684 | 150 – 315 K | − 4.346459 | 0.1740251 | −0.2831553 × 10⁻⁴ | −6.565822 × 10⁻⁴ | 0.011 Ω | 0.065 K |
Table 2.
Wire Resistances as a Function of Temperature
| Pressure MPa | Temperature K | Wire Resistances | Wire Lengths | Resistances/Unit Length | Percent difference | |||
|---|---|---|---|---|---|---|---|---|
| long, Ω | short, Ω | long, cm | short, cm | long, Ω/m | short, Ω/m | |||
| .1013 | 75.00 | 16.7427 | 8.3231 | 10.434 | 5.134 | 160.5 | 162.1 | −1.03 |
| .1013 | 100.00 | 25.4865 | 12.6519 | 10.436 | 5.135 | 244.2 | 246.4 | − .89 |
| .1013 | 125.00 | 34.1064 | 16.9150 | 10.438 | 5.136 | 326.8 | 329.4 | − .79 |
| .1013 | 150.00 | 42.6026 | 21.1124 | 10.440 | 5.137 | 408.1 | 411.0 | − .72 |
| .1013 | 175.00 | 50.9731 | 25.2407 | 10.442 | 5.138 | 488.1 | 491.3 | − .64 |
| .1013 | 200.00 | 59.2539 | 29.3259 | 10.444 | 5.139 | 567.3 | 570.7 | − .59 |
| .1013 | 225.00 | 67.4606 | 33.3756 | 10.447 | 5.140 | 645.8 | 649.3 | − .55 |
| .1013 | 250.00 | 75.5934 | 37.3900 | 10.449 | 5.141 | 723.5 | 727.3 | − .53 |
| .1013 | 273.15 | 83.0582 | 41.0758 | 10.451 | 5.142 | 794.7 | 798.8 | − .51 |
| .1013 | 275.00 | 83.6520 | 41.3690 | 10.451 | 5.142 | 800.4 | 804.5 | − .51 |
| .1013 | 300.00 | 91.6366 | 45.3126 | 10.454 | 5.143 | 876.6 | 881.0 | − .50 |
| .1013 | 325.00 | 99.5472 | 49.2208 | 10.456 | 5.144 | 952.1 | 956.8 | − .49 |
4.4. Time Increment
The timing of the experiment is based on the internal clock of the minicomputer, a temperature stabilized quartz crystal oscillator that divides a second into roughly 20,000 parts. Available to the programmer is a real time clock which is incremented in milliseconds. During a run this clock is first zeroed, line 620 in appendix I, next 250 voltage readings are taken across the bridge, and finally the clock is read, line 670 in appendix I. The gain of the DVM is set before starting the voltage readings. There are 250 steps in the program loop, where each step includes reading the DVM, storing the result, and time for the computer to execute the step. The time required to execute the program loop is 755 ms, which means that the DVM is read every 3.02 milliseconds. Separate timing runs establish the time necessary to read the clock as about 1 ms. This means the time increment could be as small as 3.012 ms. Actual calculations using the data reduction program show that for this variation in time increment the thermal conductivity results are affected by less than 1 part in 20,000.
The time increment between readings of the DVM can be varied by inserting a delay of several ms into the program loop. Increments of 5, 10, and 15 ms were tried. In general, the use of larger time increments simply reduces the number of useful points for the thermal conductivity analysis since for nearly all fluid conditions the onset of convection occurs at around one second in this apparatus.
4.5. Power Level
The ideal analysis stipulates that the heat flux q, applied to the wire remains constant during a given run. Under experimental conditions q is nearly ideal at room temperature, i.e., it varies by about two parts in 10000. However, at the very lowest temperatures the q will vary from beginning to end of a run by values up to several percent. To see why this is so, and to find the correction that has to be applied consider the following.
The power supply used provides a constant voltage at its terminals to a circuit which consists of a 100 Ω standard resistor in series with the Wheatstone bridge. The effective bridge resistance is nominally 100 Ω but changes as the run progresses. The voltage of the power supply is preset, it is known to an accuracy of ± 200 μV. The set value is entered through the key board, just prior to switching the power to the bridge. After the run is completed, but before the power is switched back to the dummy resistor, the voltage across the standard resistor, channel 0 in figure 2, is read. The difference between this voltage and the preset one is the voltage applied to the bridge a short time after completion of the run. The difference is one of the items placed on magnetic tape, and it is used in the data reduction program to calculate the power applied to the bridge. The instantaneous heat flux is determined from the equation.
| (6) |
where V(t) is the voltage applied to the bridge, and R3 and R4 are defined in figure 2. The voltage V(t), both hot wire legs of the bridge R3 and R4, and the hot wire resistances themselves change as a function of time. At room temperature the drop in the current is almost exactly offset by the rise in the hot wire resistances. At low temperatures the fractional change in the hot wire resistances predominates. As an extreme example consider a run in liquid propane at say 110 K. For a 3 K rise in wire temperature the long hot wire rises by 1 Ω from an initial value of 30 Ω, or 3.3 percent. This rise is only partially offset by the 0.7 percent drop in the hot wire current leaving a net rise in q of 2.6 percent from t = 0 to t = 755 ms. The range of valid times for a run is generally t1 = 150 ms, t2 = 755 ms. Over this range of times the variation in q is less than the extreme case because a large part, 70 percent or so, of the resistance change of the hot wires occurs during the times not valid for the experiment. Nevertheless, the remaining variation in q is significant and we apply a correction to account for it. We select a time in the middle of the valid time interval ta = (t1 + t2)/2 and correct the experimental ΔT’s by the ratio of the instantaneous q to the q at the median time
| (7) |
V(t) varies by about one part in 1000 over a run, and some calculation verified that V(t) varies as the ℓn(t), and further that the value measured was actually achieved at the requisite time after the end of the run.
4.6. Bridge Voltages
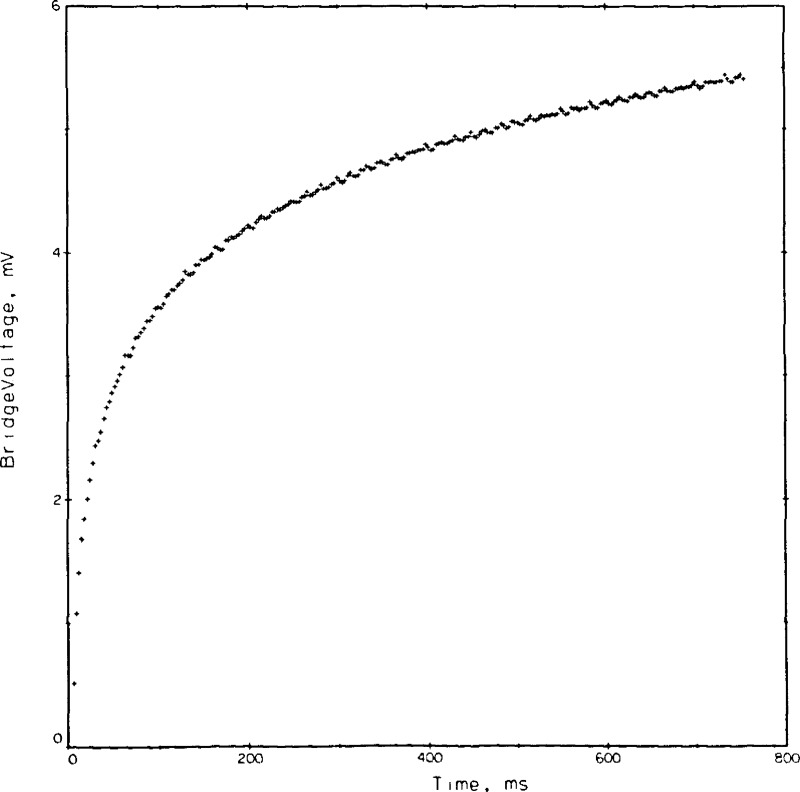
The voltages measured across the bridge, actually a measure of the bridge unbalance, are the basic data in this experiment. A typical set of 250 of these voltages for point No. 9044 is shown in appendix II and is plotted in Figure 7. The general shape of this curve is logarithmic, as expected. Noise levels in these readings are evident. Considerable effort went into reducing the noise level, and also into tracing the source. The DVM, when shorted, exhibits an error band of ± 6 μV. When a 100 Ω resistor is placed across the DVM, no applied power yet, the band increases to ± 17 μV. With the experimental system connected to the DVM the error band becomes ± 28 μV which is roughly equivalent to ± .026 K in the ΔT. Only a small part, some 20 or 30 percent, is due to AC pickup. Use of integrating or averaging DVM’s will reduce the noise level at the expense, however, of a smaller number of measurements.
Figure 7.
Typical bridge voltages versus time, point 9044, helium gas.
5. Data Reduction
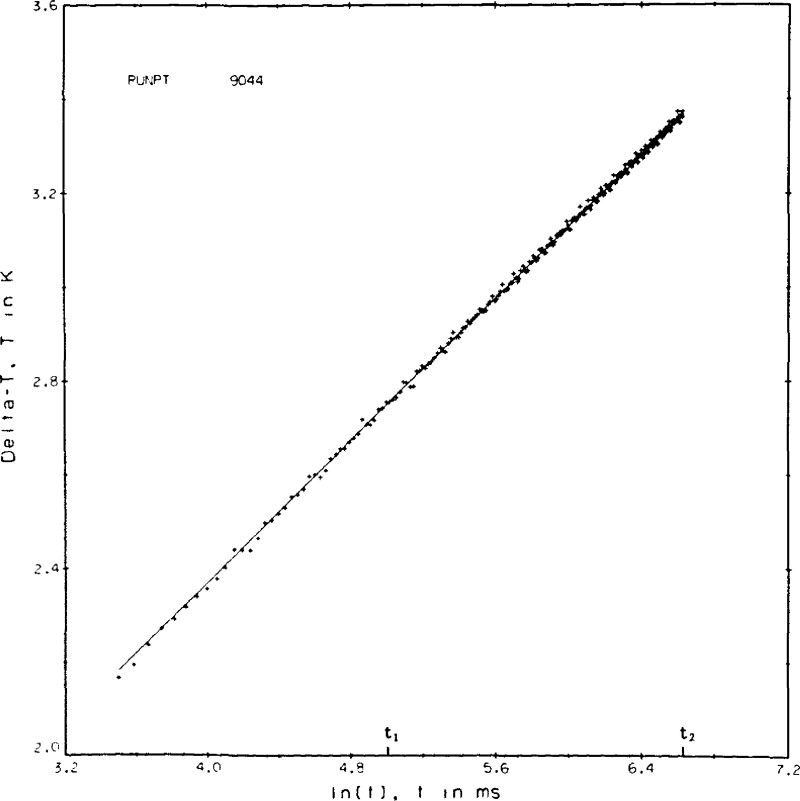
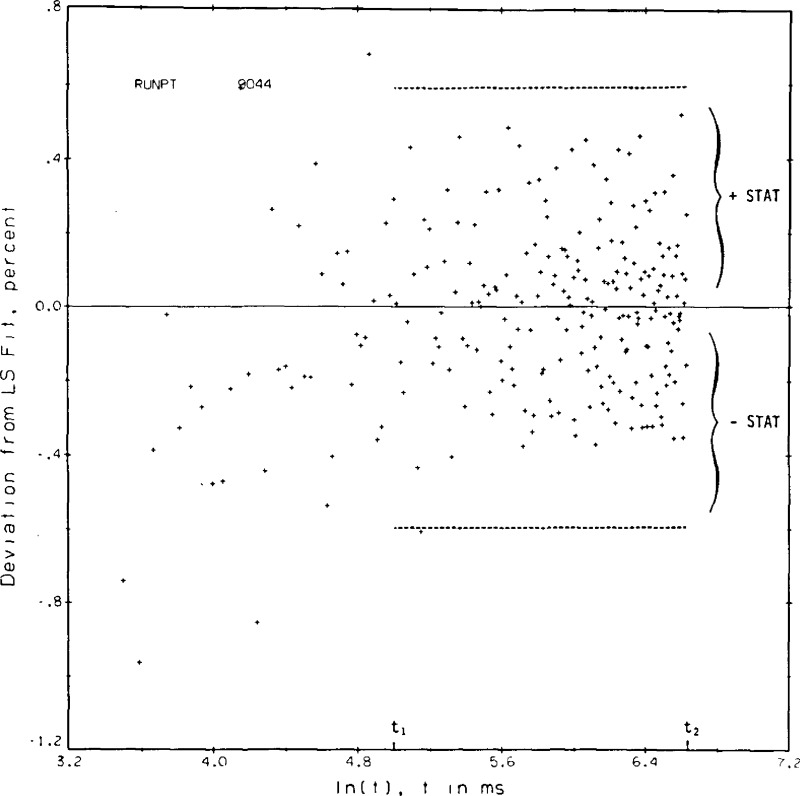
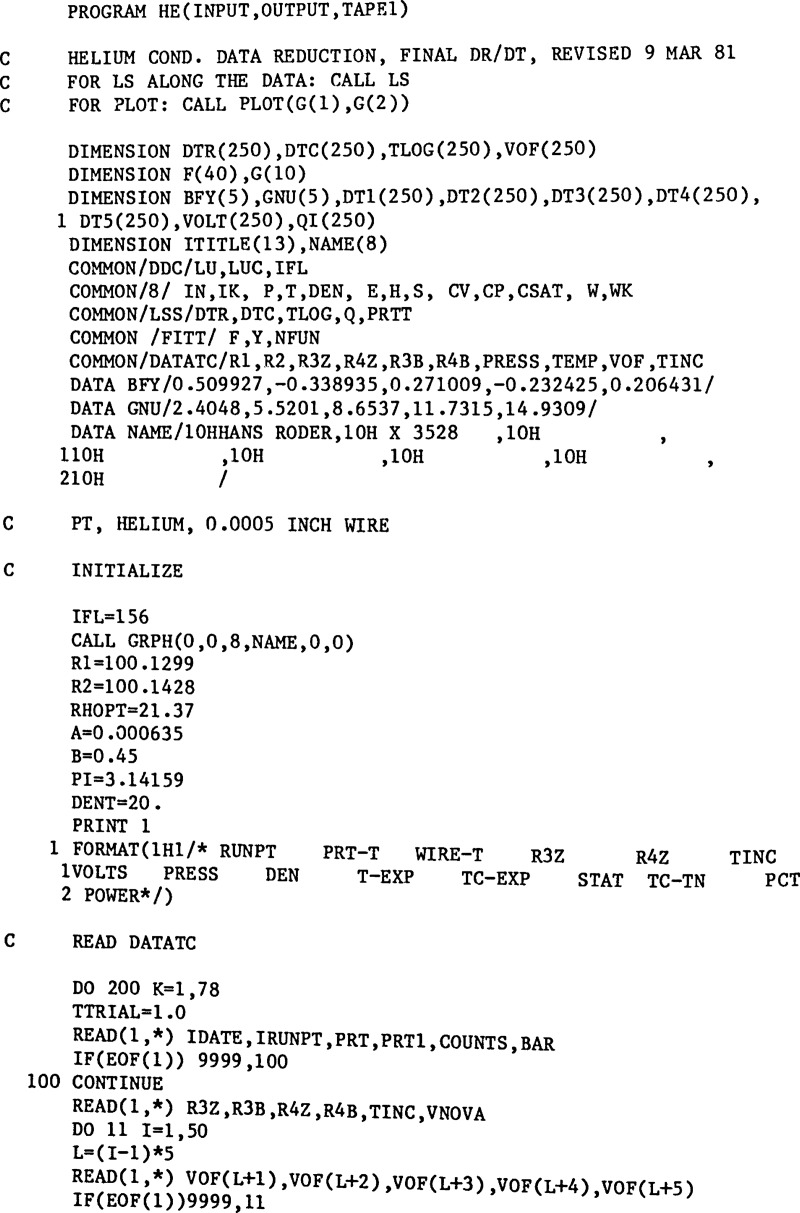
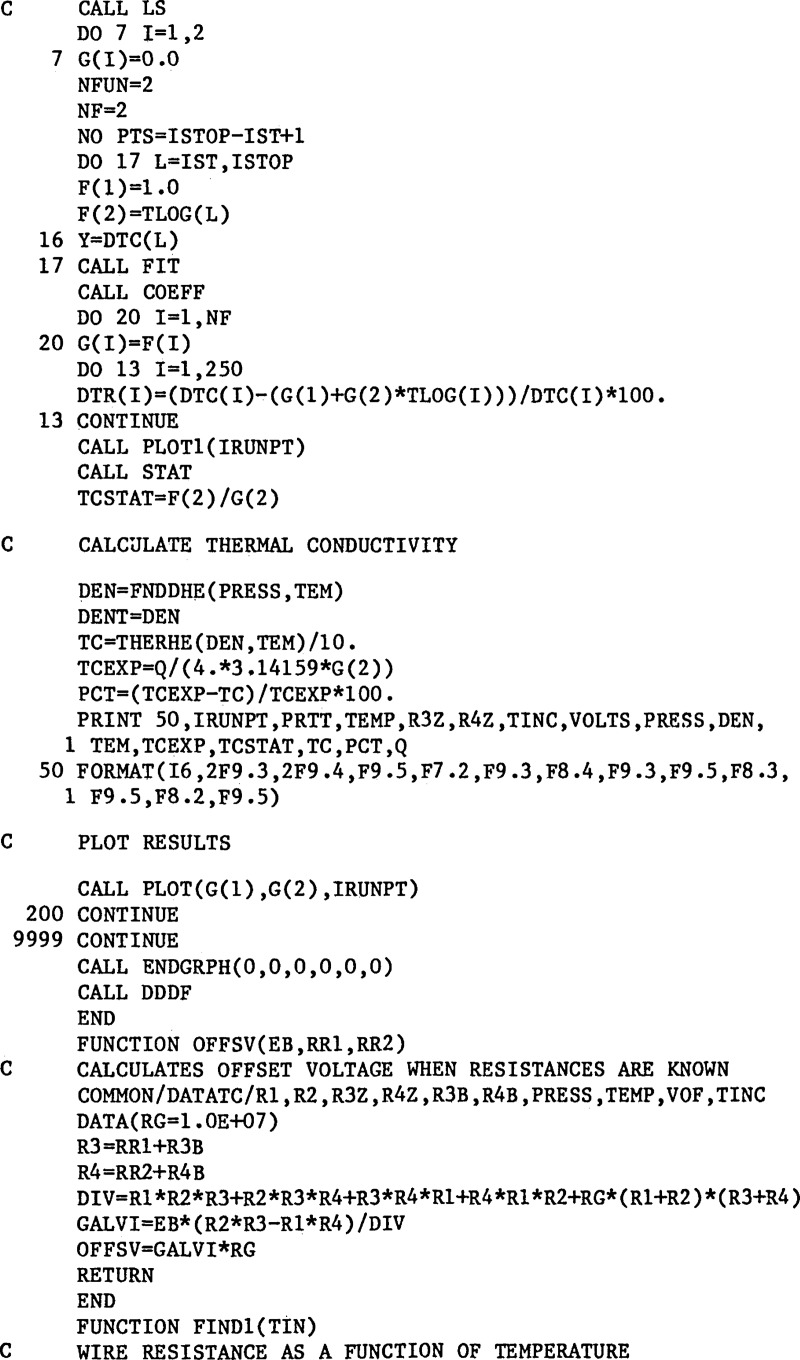
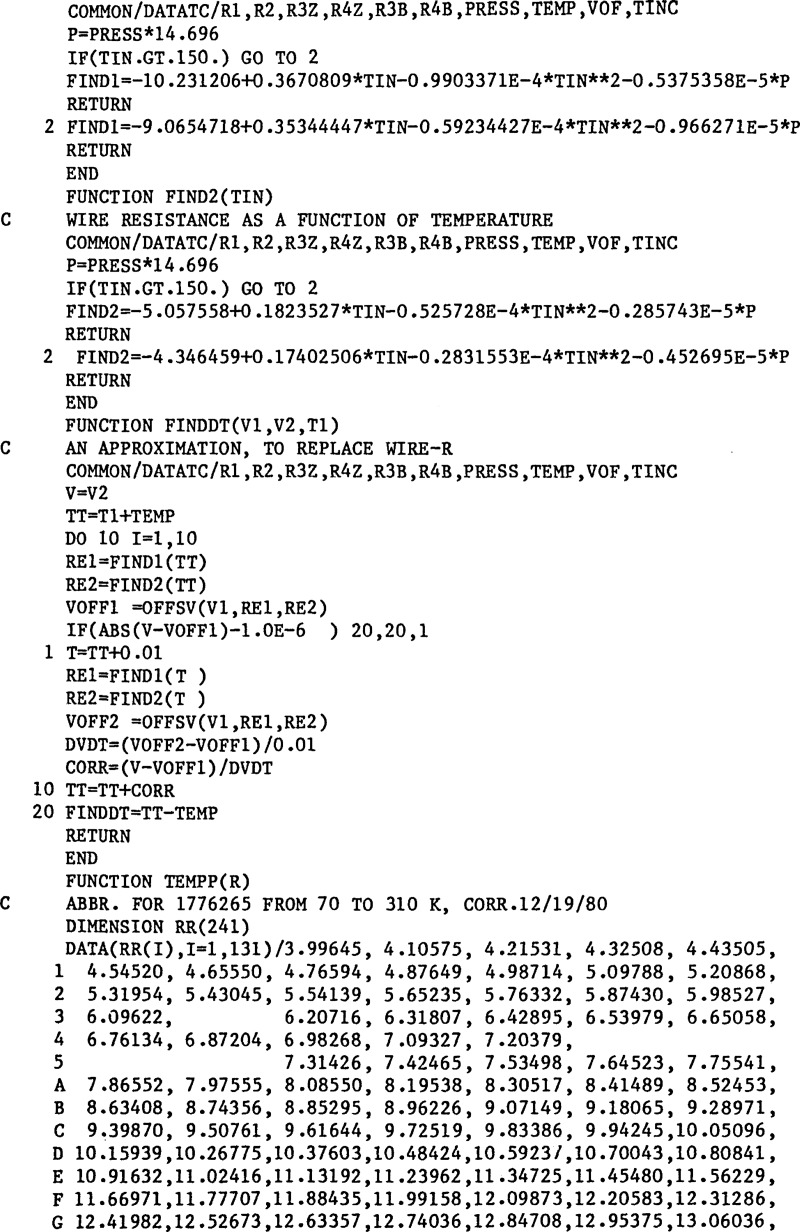
A listing of the data reduction program used for helium is given in appendix III. Experimental values are read from the magnetic tape. Initial calculations and corrections include corrections for the bias of the DVM, corrections for the leads inside the high pressure cell, and an estimation of the instantaneous voltage applied to the bridge. The ΔTw values are calculated from the voltages applied to the bridge, the offset or measured voltages across the bridge and the two hot wire calibrations. The bridge equation is solved repeatedly until the increases in the hot wire resistances together with the voltage applied to the bridge yield an offset voltage equal to the measured one. The various corrections to the ΔTw are applied to obtain the ΔT, and then the ΔT’s and ℓn(t)’s are passed to a least squares regression routine. Microfilm plots of both ΔT and the deviation of each measured point from the regression line versus ℓn(t) are set up. Typical examples again for point No. 9044 are shown in figures 8a and 8b. In the final steps of the data reduction program an equation of state is used to find the applicable density, the experimental thermal conductivity is compared to any previous correlation that might exist, and the results are printed.
Figure 8a.
Typical temperature rises versus the logarithm of time, point 9044, helium gas.
Figure 8b.
Typical deviations of experimental temperature rises from the calculated straight line versus the logarithm of time, point 9044, helium gas.
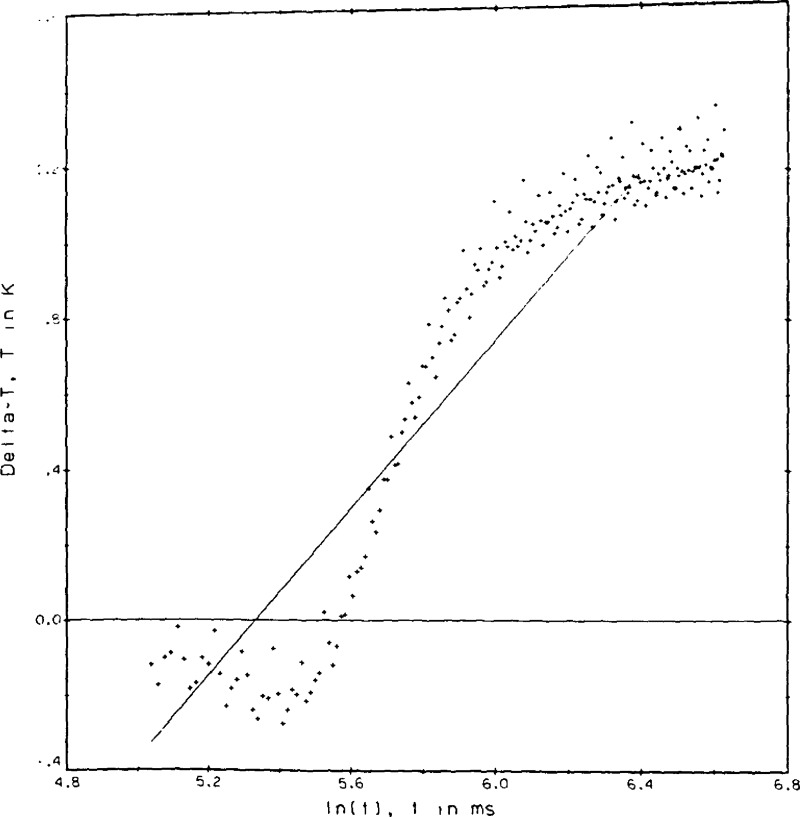
A certain amount of judgement enters into the data reduction process particularly in the selection of t1 and t2, the range of times over which the least squares straight line regression is to be evaluated. The criterion for a valid result is that the ΔT values as plotted in the example, figure 8a, shall form a straight line versus the ℓn(t). The deviation plot as shown in figure 8b is used to help determine the valid range of the least squares fit. For most experimental conditions t1 = 150 ms and t2 = 755 ms. In both figures, 8a and 8b, the points plotted begin at index 11 or t = 33 ms. The first 30 or so points are seen to fall somewhat below the straight line. By inspection the fit for point 9044 could have included an index as low as 41 or t1 = 124 ms. In figure 8b the standard deviation for the regression fit of point 9044 is roughly 0.2 percent, or at the 3σ level 0.65 percent.
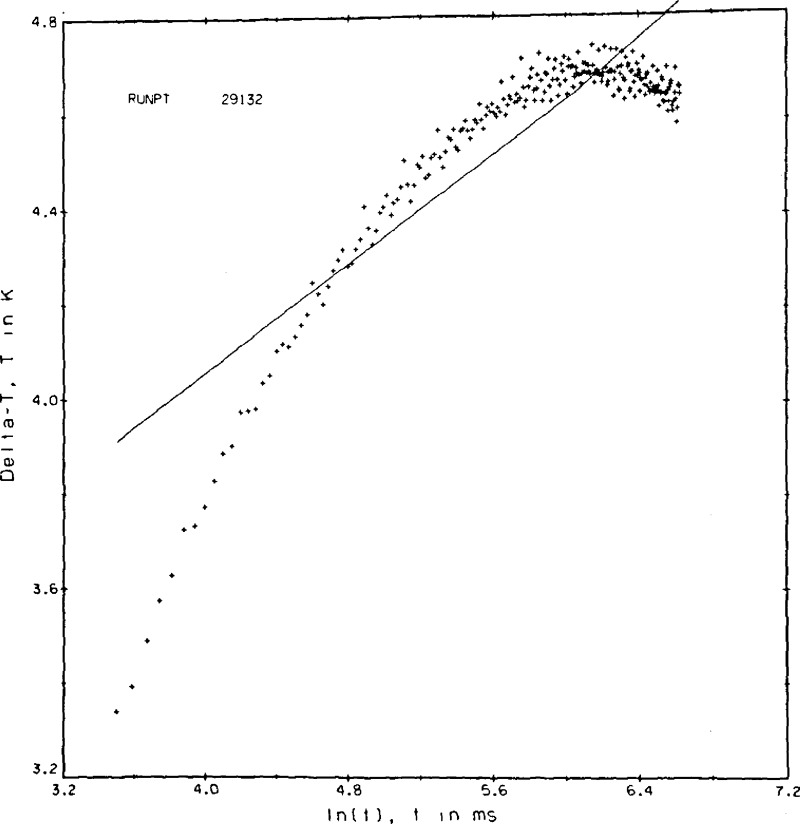
By implication, it is equally important to recognize and interpret nonstandard results obtained, so that invalid results can be identified and rejected. A description of several of the more interesting malfunctions follows. In figure 9a we see that the ΔT values are nearly constant toward the end of the run. This state of affairs depending on the state of the fluid sample is interpreted as (a) the apparatus is operating in the steady state mode, or (b) as the onset of convection in the run.
Figure 9a.
Plots of experimental malfunctions. Point 29132, argon gas.
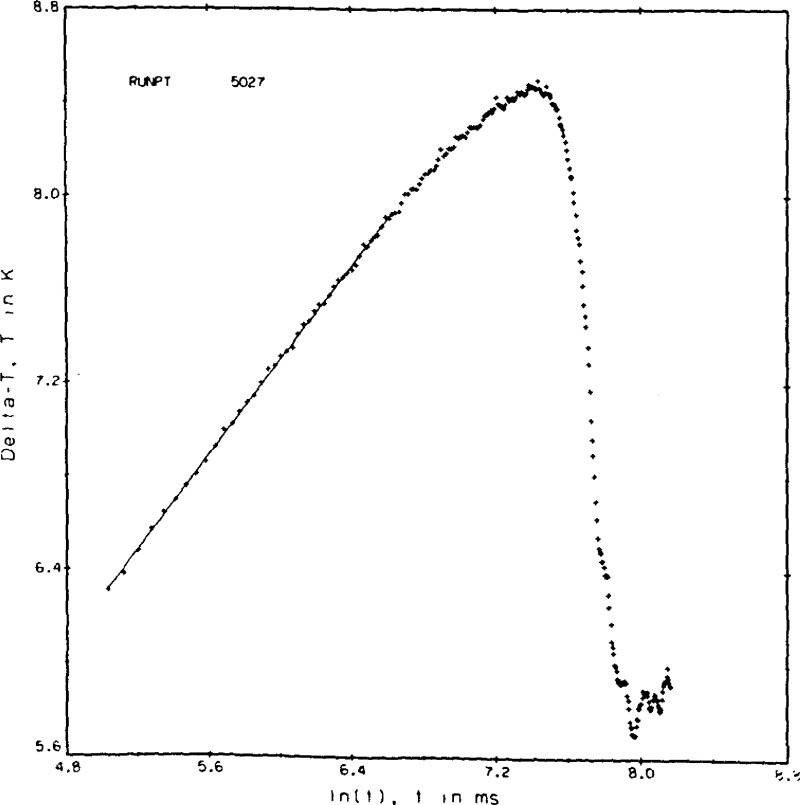
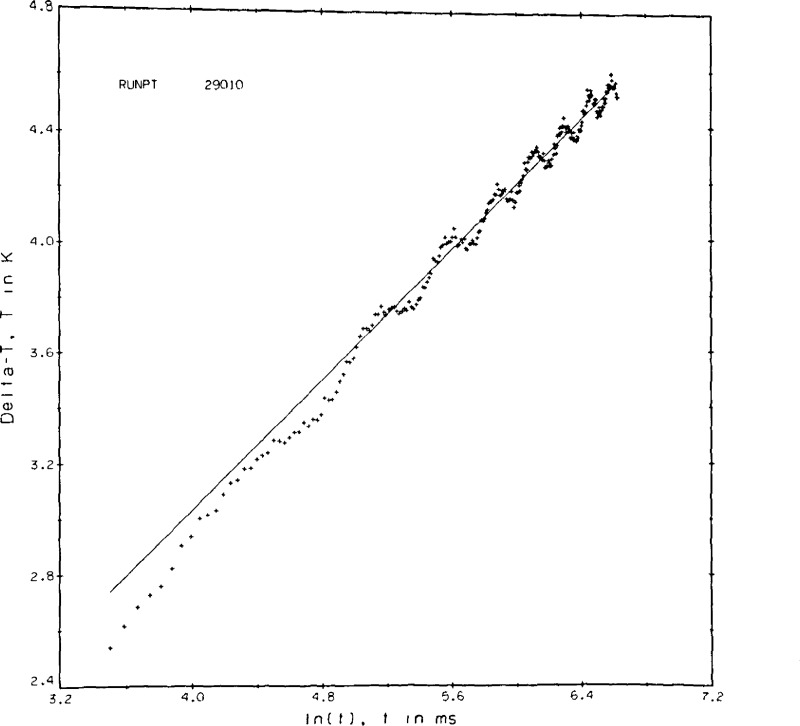
If a similar run at higher fluid densities is taken to much longer experimental times the plot is as shown in figure 9b. Here the effect of convection is clearly seen as a rapid cooling of the hot wires after the maximum ΔT is passed. In principle we could get a valid result for the transient hot wire by selecting t1 = 690 ms and t2 = 1353 ms. However, the number of ΔT values useful for the straight line regression has now dropped to 50. In practice it turns out that the applied power level, as seen in the resulting ΔT’s of 10 to 12 K, was simply too large to be useful. The plot of figure 9c shows the effect of gas circulation within the cell. The precise cause is not known. Convection combined with thermal oscillations when the capillary cools are suspected reasons. From the plot it is clear that the wires experience a non-uniform temperature field and are subject to abrupt segments of convection cooling. Measurements with a plot of this type are rejected.
Figure 9b.
Point 5027, nitrogen gas.
Figure 9c.
Point 29010, argon gas.
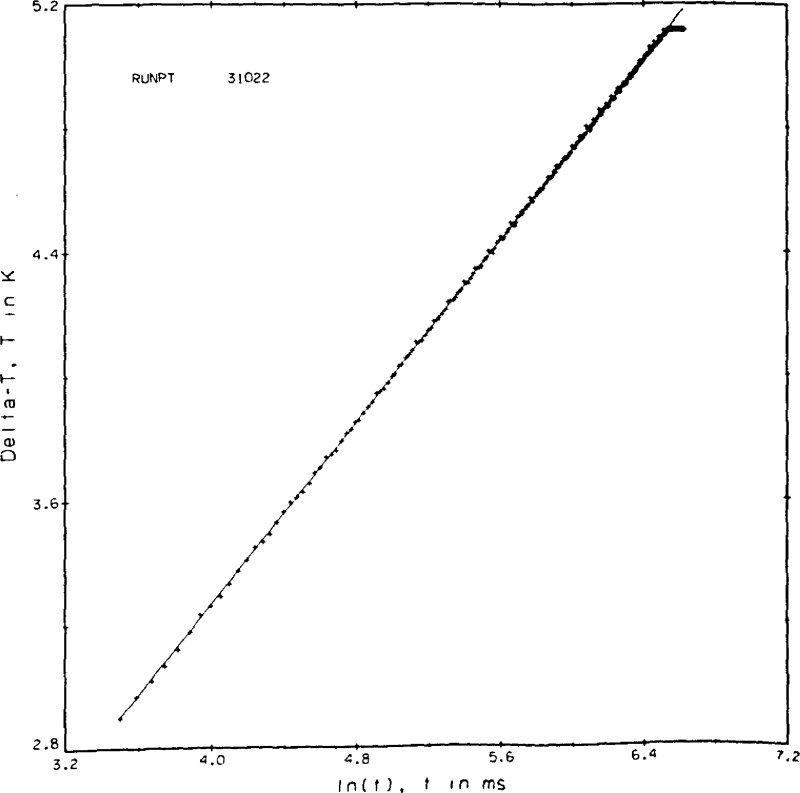
In figure 9d the DVM saturated toward the end of the run. By excluding the points for which the voltage readings are constant, and provided there are sufficient measurements to extract a straight line fit, a measurement of this type can be used. At the very lowest pressures (densities) in the vapor phase at temperatures much below the critical temperature some plots look like the one shown in figure 9e. The physical interpretation of this run is that we see a Knudsen effect at short times and an outer boundary effect at the longer times. No valid range for the hot wire instrument exists and these results are rejected. In the region near the critical point the onset of convection occurs much more rapidly. Measurements in this fluid region have to be made at lower power levels and at shorter times. For the measurements on oxygen experimental times of t1 ≅ 33 ms and t2 ≅ 500 ms were found to be appropriate.
Figure 9d.
Point 31022, propane liquid.
Figure 9e.
Point 28003, oxygen vapor.
A second criterion which is used in accepting or rejecting experimental measurements is by considering the change in the measured thermal conductivity as the applied power, q, is varied. Examples are given in the sections on nitrogen and helium. In a general way this criterion suggests that measurements in which the final ΔT’s are larger than about 5 K are suspect. This includes most of the critical region where the results have to be evaluated quite carefully, almost on an individual point by point basis.
6. Performance Verification
6.1. Nitrogen Results
One of the gases selected for apparatus testing was nitrogen. Typical measurements on nitrogen are presented in table 3. There are two different sets of measurements. Run 4 is an abbreviated isotherm to check the functioning of the system as the pressure is varied. In contrast, all measurements of run 5 are taken at a single density while several of the pertinent apparatus parameters are varied.
Table 3.
Thermal Conductivity of Nitrogen Near 300 K.
| Adjusted Thermal Conductivity | ||||||||
|---|---|---|---|---|---|---|---|---|
| Run Pt. | Pressure MPa | Temperature K | Density mol/L | Power W/m | Thermal Conductivity W/m·K | STAT | with T = 300.65 K W/m·K | with T = 300.65 K and ρ = 6.3 mol/L W/m·K |
| 4001 | 69.123 | 297.004 | 17.5101 | .14023 | .06868 | .034 | .06891 | |
| 4002 | 69.124 | 297.439 | 17.4916 | .20067 | .06880 | .021 | .06900 | |
| 4003 | 69.124 | 298.096 | 17.4635 | .27180 | .06821 | .013 | .06837 | |
| 4004 | 69.123 | 298.759 | 17.4351 | .35381 | .06829 | .009 | .06841 | |
| 4005 | 69.125 | 299.583 | 17.4003 | .44662 | .06845 | .007 | .06852 | |
| 4006 | 69.125 | 300.322 | 17.3691 | .55006 | .06831 | .004 | .06833 | |
| 4007 | 61.132 | 298.146 | 16.4493 | .27174 | .06344 | .012 | .06360 | |
| 4008 | 61.133 | 298.905 | 16.4166 | .35371 | .06379 | .009 | .06390 | |
| 4009 | 61.128 | 299.709 | 16.3813 | .44650 | .06333 | .006 | .06339 | |
| 4010 | 61.131 | 300.741 | 16.3376 | .54992 | .06347 | .005 | .06346 | |
| 4011 | 54.586 | 298.026 | 15.5156 | .23468 | .05971 | .014 | .05988 | |
| 4012 | 54.588 | 298.703 | 15.4863 | .31117 | .05962 | .009 | .05974 | |
| 4013 | 54.588 | 299.475 | 15.4528 | .39862 | .05980 | .007 | .05987 | |
| 4014 | 54.588 | 300.334 | 15.4156 | .49695 | .05977 | .006 | .05979 | |
| 4015 | 47.903 | 300.778 | 14.3096 | .49683 | .05555 | .004 | .05554 | |
| 4016 | 47.903 | 299.771 | 14.3531 | .39857 | .05551 | .006 | .05557 | |
| 4017 | 47.905 | 298.863 | 14.3927 | .31119 | .05570 | .009 | .05581 | |
| 4018 | 47.905 | 298.042 | 14.4285 | .23469 | .05555 | .014 | .05571 | |
| 4019 | 40.607 | 297.907 | 13.0618 | .20044 | .05049 | .016 | .05066 | |
| 4020 | 40.608 | 298.705 | 13.0277 | .27163 | .05078 | .010 | .05090 | |
| 4021 | 40.609 | 299.584 | 12.9903 | .35361 | .05092 | .007 | .05099 | |
| 4022 | 40.609 | 300.704 | 12.9427 | .44624 | .05104 | .005 | .05104 | |
| 4023 | 33.596 | 298.229 | 11.4980 | .20061 | .04616 | .015 | .04631 | |
| 4024 | 33.596 | 299.023 | 11.4655 | .27208 | .04600 | .010 | .04610 | |
| 4025 | 33.596 | 300.028 | 11.4247 | .35423 | .04636 | .007 | .04640 | |
| 4026 | 33.596 | 301.176 | 11.3782 | .44717 | .04633 | .005 | .04630 | |
| 4027 | 26.643 | 297.741 | 9.7001 | .14033 | .04128 | .023 | .04146 | |
| 4028 | 26.642 | 298.530 | 9.6705 | .20078 | .04135 | .013 | .04148 | |
| 4029 | 26.643 | 299.522 | 9.6340 | .27210 | .04199 | .009 | .04206 | |
| 4030 | 26.642 | 300.611 | 9.5939 | .35421 | .04154 | .006 | .04154 | |
| 4031 | 19.700 | 300.643 | 7.4708 | .31180 | .03707 | .006 | .03707 | |
| 4032 | 19.700 | 299.992 | 7.4902 | .27212 | .03693 | .008 | .03697 | |
| 4033 | 19.700 | 298.934 | 7.5221 | .20073 | .03695 | .012 | .03706 | |
| 4034 | 19.700 | 297.950 | 7.5521 | .14029 | .03678 | .019 | .03695 | |
| 4035 | 19.700 | 297.532 | 7.5651 | .11414 | .03676 | .026 | .03696 | |
| 4036 | 12.708 | 297.418 | 5.0731 | .09066 | .03223 | .035 | .03243 | |
| 4037 | 12.708 | 298.319 | 5.0546 | .14029 | .03212 | .017 | .03227 | |
| 4038 | 12.708 | 299.457 | 5.0314 | .20079 | .03216 | .011 | .03224 | |
| 4039 | 12.708 | 300.749 | 5.0054 | .27209 | .03238 | .008 | .03237 | |
| 4040 | 5.681 | 301.332 | 2.2732 | .23508 | .02837 | .010 | .02833 | |
| 4041 | 5.681 | 300.556 | 2.2798 | .20076 | .02830 | .013 | .02831 | |
| 4042 | 5.681 | 299.102 | 2.2923 | .14028 | .02816 | .021 | .02826 | |
| 4043 | 5.681 | 297.843 | 2.3032 | .09064 | .02813 | .042 | .02831 | |
| 4044 | 5.681 | 299.714 | 2.2870 | .16920 | .02821 | .016 | .02827 | |
| 4045 | 5.681 | 298.464 | 2.2975 | .11412 | .02807 | .030 | .02821 | |
| 4046 | 1.430 | 299.675 | .5751 | .14031 | .02605 | .024 | .02611 | |
| 4047 | 1.430 | 298.299 | .5779 | .09064 | .02582 | .041 | .02597 | |
| 4048 | 1.429 | 297.129 | .5799 | .05179 | .02618 | .097 | .02640 | |
| 4049 | 1.429 | 297.703 | .5788 | .06983 | .02581 | .064 | .02600 | |
| 4050 | 1.429 | 298.984 | .5761 | .11411 | .02608 | .030 | .02618 | |
| 5001 | 16.327 | 297.649 | 6.3985 | .09069 | .03439 | .032 | .03458 | .03440 |
| 5002 | 16.327 | 298.523 | 6.3757 | .14036 | .03453 | .019 | .03466 | .03452 |
| 5003 | 16.327 | 299.492 | 6.3507 | .20084 | .03484 | .011 | .03491 | .03482 |
| 5004 | 16.327 | 300.657 | 6.3209 | .27209 | .03489 | .007 | .03489 | .03485 |
| 5005 | 16.327 | 301.440 | 6.3010 | .31171 | .03508 | .006 | .03503 | .03503 |
| 5006 | 16.328 | 301.373 | 6.3030 | .31172 | .03485 | .006 | .03480 | .03479 |
| 5007 | 16.328 | 300.632 | 6.3218 | .27203 | .03495 | .006 | .03495 | .03491 |
| 5008 | 16.329 | 299.496 | 6.3511 | .20069 | .03467 | .011 | .03474 | .03465 |
| 5009 | 16.329 | 298.426 | 6.3787 | .14025 | .03471 | .018 | .03485 | .03471 |
| 5010 | 16.329 | 297.614 | 6.3999 | .09061 | .03459 | .035 | .03478 | .03460 |
| 5011 | 16.329 | 297.512 | 6.4028 | .09071 | .03447 | .032 | .03467 | .03448 |
| 5012 | 16.329 | 298.293 | 6.3824 | .14037 | .03453 | .018 | .03468 | .03453 |
| 5013 | 16.329 | 299.270 | 6.3571 | .20090 | .03463 | .011 | .03472 | .03462 |
| 5014 | 16.329 | 300.472 | 6.3263 | .27222 | .03468 | .007 | .03469 | .03464 |
| 5015 | 16.329 | 301.184 | 6.3083 | .31195 | .03482 | .006 | .03479 | .03477 |
| 5016 | 16.330 | 297.460 | 6.4043 | .09069 | .03505 | .060 | .03525 | .03506 |
| 5017 | 16.330 | 298.264 | 6.3834 | .14035 | .03459 | .033 | .03474 | .03459 |
| 5018 | 16.330 | 299.300 | 6.3566 | .20085 | .03481 | .019 | .03490 | .03480 |
| 5019 | 16.330 | 300.512 | 6.3255 | .27213 | .03476 | .012 | .03477 | .03472 |
| 5020 | 16.330 | 301.228 | 6.3074 | .31179 | .03470 | .009 | .03466 | .03465 |
| 5021 | 16.329 | 296.862 | 6.4199 | .05183 | .03397 | .186 | .03421 | .03399 |
| 5022 | 16.329 | 297.554 | 6.4017 | .09073 | .03459 | .081 | .03479 | .03460 |
| 5023 | 16.329 | 298.358 | 6.3807 | .14043 | .03436 | .041 | .03450 | .03435 |
| 5024 | 16.329 | 299.454 | 6.3524 | .20091 | .03447 | .024 | .03455 | .03445 |
| 5025 | 16.329 | 300.573 | 6.3235 | .27225 | .03468 | .014 | .03468 | .03464 |
| 5026 | 16.329 | 302.013 | 6.2871 | .35420 | .03497 | .011 | .03488 | .03490 |
| 5027 | 16.329 | 303.570 | 6.2483 | .44706 | .03505 | .009 | .03487 | .03496 |
| 5028 | 16.329 | 305.150 | 6.2095 | .55073 | .03486 | .010 | .03458 | .03474 |
| 5031 | 16.328 | 301.848 | 6.2910 | .35473 | .03465 | .008 | .03457 | .03459 |
| 5032 | 16.328 | 303.341 | 6.2537 | .44782 | .03481 | .006 | .03464 | .03472 |
| 5033 | 16.328 | 305.077 | 6.2109 | .55174 | .03514 | .005 | .03486 | .03502 |
| 5034 | 16.328 | 306.934 | 6.1660 | .66648 | .03509 | .004 | .03469 | .03493 |
| 5035 | 16.327 | 308.967 | 6.1175 | .79195 | .03528 | .003 | .03476 | .03509 |
| 5036 | 16.333 | 297.573 | 6.4025 | .09074 | .03478 | .037 | .03497 | .03478 |
| 5037 | 16.333 | 298.377 | 6.3815 | .14047 | .03471 | .019 | .03485 | .03470 |
| 5038 | 16.333 | 299.450 | 6.3537 | .20096 | .03479 | .011 | .03487 | .03477 |
| 5039 | 16.333 | 300.685 | 6.3222 | .27231 | .03488 | .007 | .03488 | .03484 |
| 5040 | 16.333 | 301.270 | 6.3073 | .31209 | .03483 | .006 | .03479 | .03478 |
| 5041 | 16.337 | 297.448 | 6.4073 | .09066 | .03435 | .034 | .03455 | .03435 |
| 5042 | 16.337 | 298.207 | 6.3874 | .14029 | .03464 | .019 | .03479 | .03463 |
| 5043 | 16.337 | 299.265 | 6.3600 | .20074 | .03469 | .011 | .03478 | .03467 |
| 5044 | 16.338 | 300.475 | 6.3293 | .27202 | .03477 | .007 | .03478 | .03473 |
| 5045 | 16.338 | 301.173 | 6.3115 | .31171 | .03483 | .006 | .03480 | .03478 |
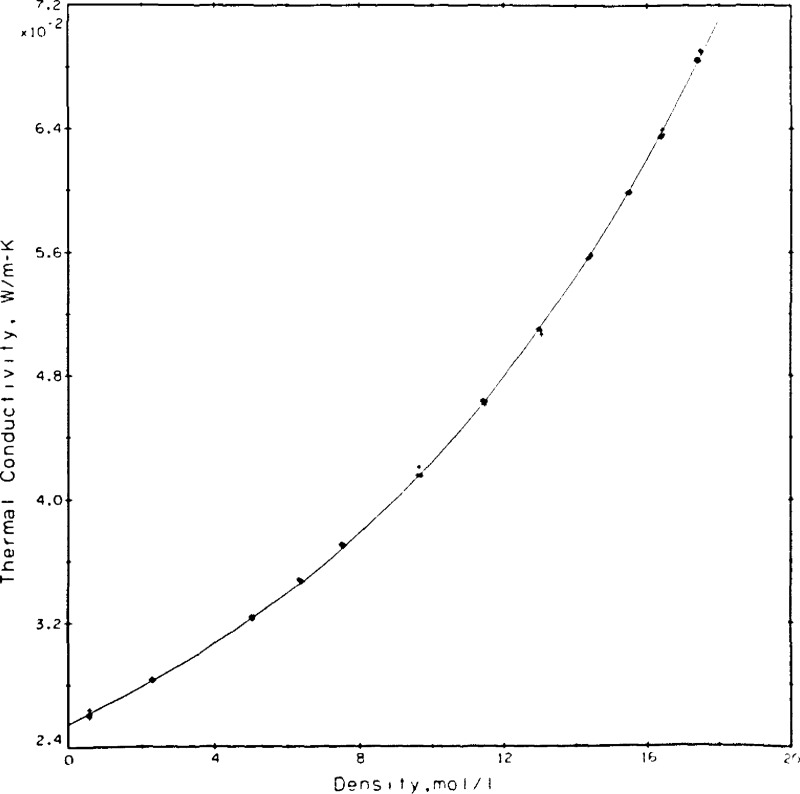
Run 4, the pseudo-isotherm, was measured at temperatures between 297 and 301 K with pressures up to 68 MPa. At each pressure (density) level a minimum of four different power settings were used. The results, a total of 50 points at varying temperatures are shown in table 3. For easy comparison with the results of others and using a Fixed dλ/dT of 0.00063 W/m•K2 the results were shifted at the experimental densities to an even temperature of 300.65 K as shown in the next to last column of table 3. The results so adjusted are represented with a curve fit of the type used by Clifford, et al. [31]
| (8) |
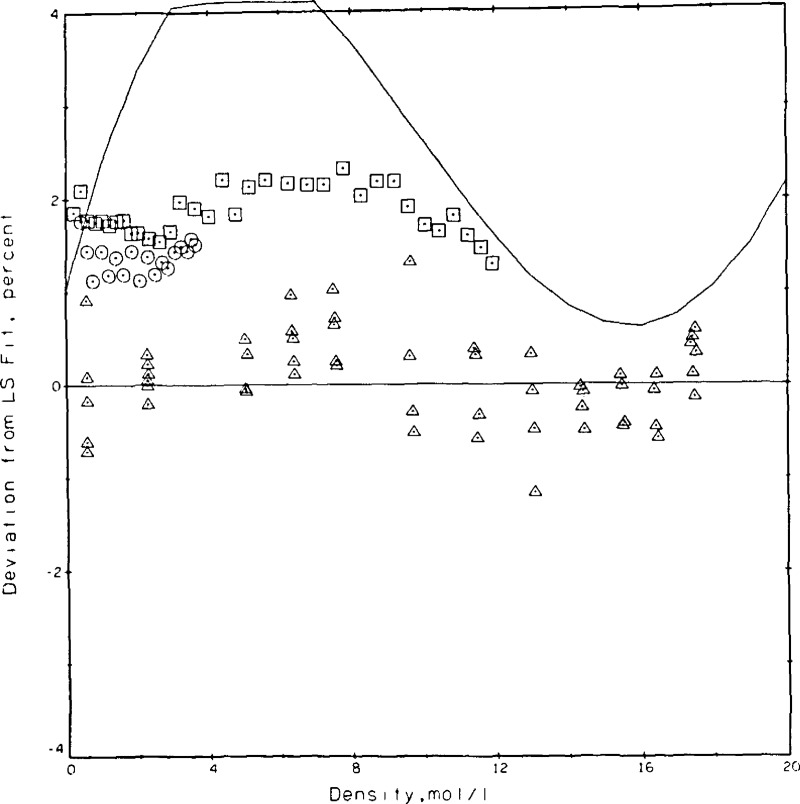
The coefficients were determined as A = 0.02550, B = 0.000112, C = 0.310567 × 10⁻⁴, and D = 0.261641 × 10⁻⁵ with λ in W/m•K and ϱ in mol/L. The standard deviation for the fit is 0.00022 W/m•K which translates to roughly 0.5 percent in the middle of the density range. The experimental measurements as adjusted to 300.65 K and the curve fit are shown in figure 10. Taking the curve fit of eq (8) as the base, the present results and those of others [31,32,33] are compared in figure 11. When all results are considered together they span a range of 3 percent. The differences between the present results and those of Clifford, et al. [31] who use a transient hot wire system range between 1.3 and 2.3 percent, the differences to the more recent measurements of Assael, et al. [32] range from 1.1 to 1.7 percent. Differences between the present results and a published wide-range correlation for nitrogen [33] lie between 0.6 and 4.5 percent. Reference [33] serves as the source of the equation of state for nitrogen.
Figure 10.
Nitrogen measurements shifted to 300.65 K with curve fit, eq (8).
Figure 11.
Comparison of the present results with those of others for nitrogen at 300.65 K. Base line eq (8), △ this paper, □ Clifford, et al. [31], ○ Assael, et al. [32], —— Hanley, et al. [33] correlation.
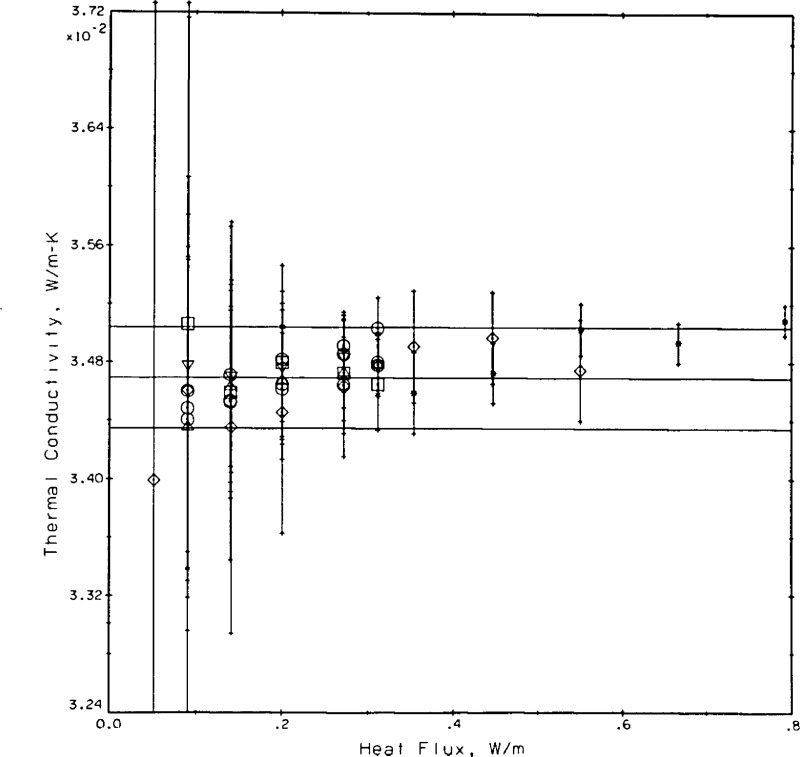
Run 5 was measured at the same nominal pressure, about 16.3 MPa, with experimental temperatures varying from 297 to 309 K. For easy comparison these results are referred to a common temperature, 300.65 K, as indicated above. However, they are further adjusted to a common density of 6.3 mol/L using eq (8). The values so adjusted are shown in the last column of table 3, and are plotted in figure 12 versus the power applied, q. The first 15 points, shown as circles in figure 12, are repetitive measurements to establish the base of comparison. The mean of these 15 points is the straight line in the center of figure 12 while the lines above and below represent changes of one percent.
Figure 12.
Measured thermal conductivity as a function of the applied power. Apparatus tests with nitrogen gas.
○ normal measurements, △ cell top cold, ▽ cell top hot
□ 5 ms delay, time increment 9.02 ms
◇ 10 ms delay, time increment 14.02 ms
* larger than normal powers.
We indicated previously that the time increment can be varied. A series of such measurements was made on nitrogen gas with time delays of 5 and 10 ms. The runs are shown in table 3 as points 5016—5028. The actual time increment between voltage measurements is 9.02 ms for runs 5016—5020 and 14.02 ms for runs 5021—5028 compared to a normal time increment of 3.02 ms. A plot of point 5027 is given in figure 9b, where the straight line segment indicates the range of times, t1 = 154.22 ms and t2 = 757.08 ms, used to evaluate the result given in table 3. If proper times t1 and t2 are selected, then runs of this type can yield valid results. However, the associated regression statistics deteriorate because a smaller number of points is available to the least squares analysis.
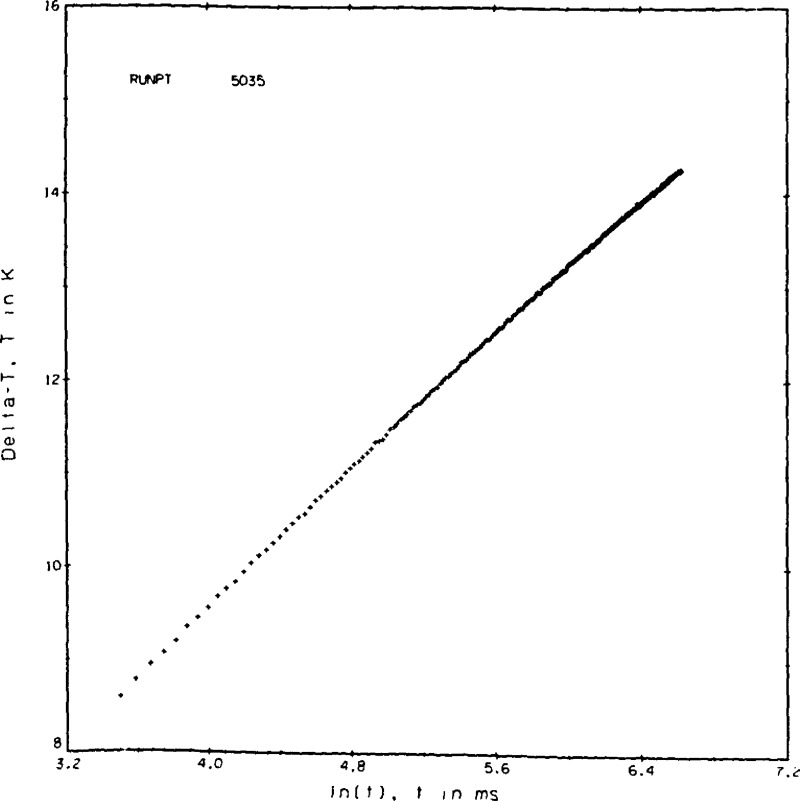
A second test involves larger than normal powers. The idea is to compare measurements made at one reference temperature with a very large power to measurements made at a higher reference temperature with a much smaller applied power, an overlapping of isotherms so to speak. For example a run at Tref =295 K and a power level to produce ΔT’s of around 15 K or a Texp of 310 K could be compared to a second run of Tref = 307 K and a power level to produce ΔT’s ~ 4 K with a Tref also of 310 K. The measurements taken are shown in table 3 as points 5031—5035. The test fails because we can see a slight dependence on power level for the high powers in figure 12. The reason the test fails is because the plot of ΔT versus ℓn(t) instead of being a straight line is curved at the very large ΔT’s involved, as shown in figure 9f for point 5035. The test might become valid in the future, provided a reanalysis of the corrections to the experimental ΔTw is made which allows for sufficiently large ΔT.
Figure 9f.
Point 5035, nitrogen gas.
A final experimental test involves the gradient along the high pressure cell. The cell is fitted with a thermocouple that measures the temperature difference from the top to the bottom of the cell. Nearly all runs were measured with the top of the cell slightly warmer than the bottom, about 10 to 15 mk. Test runs with the cell top hotter by 47 mk are shown as points 5036—5040 while similar measurements with the cell top colder by about 35 mk are given by points 5041—5045. The results show that the thermal conductivities measured under these conditions vary by roughly 0.2 percent, which in view of the other uncertainties is negligible.
6.2. Helium Results
The rare gas selected initially was helium. Results obtained subsequently on argon have already been published [30]. For helium a single pseudo isotherm was measured at a nominal temperature of 307 K with pressures up to 68 MPa. At each pressure (density) level two different power settings were used, while at three selected densities a larger range of power was covered. The results, a total of 77 points at varying temperatures are shown in table 4. For easy comparison with the results of others and using a fixed dλ/dT of 0.00035 W/m•K2 the results were shifted at the experimental densities to a temperature of 300.65 K as shown in the last column of table 4. The results so adjusted are represented with a curve fit of the same type as used on argon earlier.
| (9) |
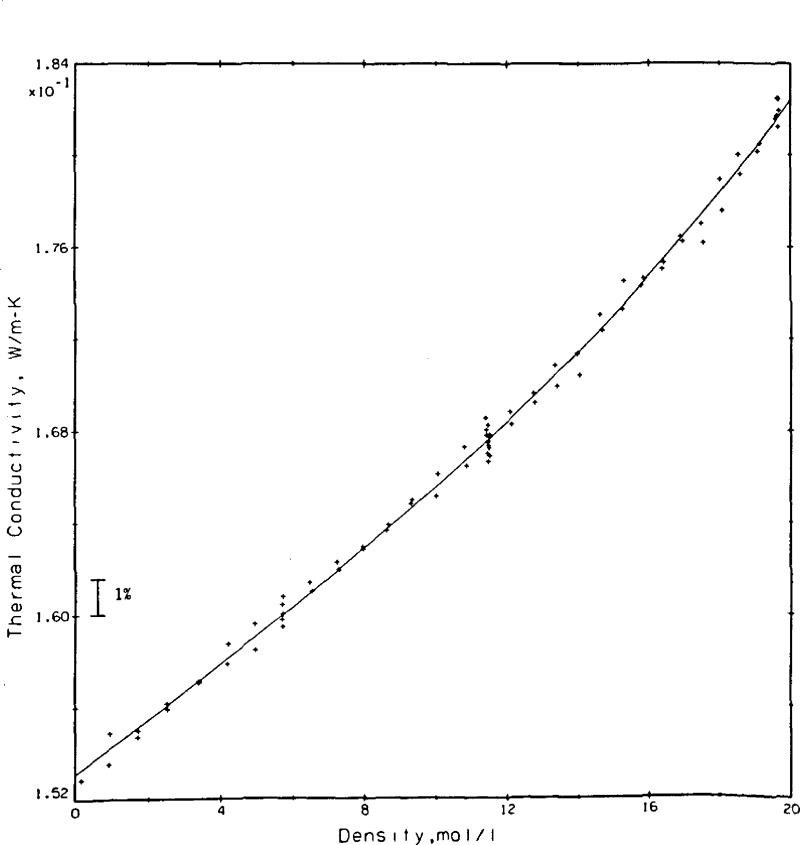
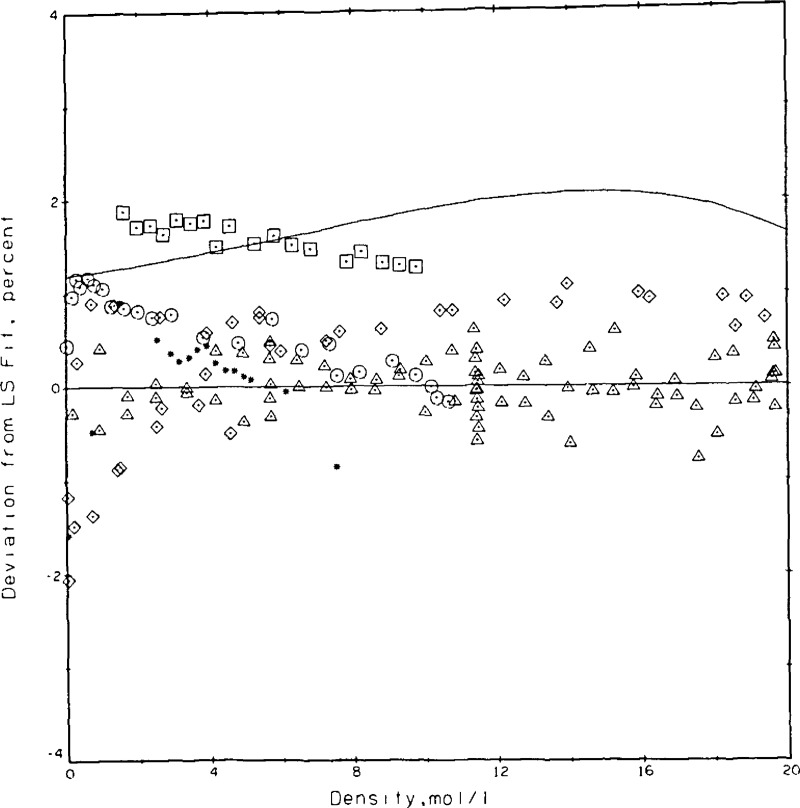
The coefficients were determined as A = 0.153099, B = 0.108257 × 10⁻², and C = 0.613662 × 10⁻³ with λ in W/m•K and ϱ in mol/L. The standard deviation for the fit is 0.00049 W/m•K which translates to roughly 0.6 percent at the 95 percent confidence level or 0.9 percent at the 99 percent confidence level. In other words, of the 77 measurements 71 lie within ± 0.5 percent of the fitted curve. The experimental measurements as adjusted to 300.65 K and the curve fit are shown in figure 13. The densities at which a larger variety of power settings was measured are easily noted in figure 13 as 5.7, 11.5, and 19.6 mol/L. Taking the curve fit of eq (9) as the base, the present results and those of others [7,34,35,36,37] are compared in figure 14. These results span a range of ±2 percent. The deviations between the present results and those of Le Neindre, et al. [34], Johannin, et al. [35], and Ho and Leidenfrost [36] are a nominal 1 percent or less. The differences between the present results and those of Kestin, et al. [7], who also use a transient hot wire system, range between 1.3 and 1.9 percent, while the differences between the present results and a published wide-range correlation for helium [37] also lie between 1 and 2 percent. Differences between the present results and the most recent ones of Assael, et al. [10], who also use a transient hot wire system, range from 1.0 to 1.7 percent. The source used as equation of state for obtaining the densities of helium is [37].
Table 4.
Thermal Conductivity of Helium Near 300 K.
| Run Pt. | Pressure MPa | Temperature K | Density mol/L | Power W/m | Thermal Conductivity W/m·K | STAT | Adjusted Thermal Conductivity with T = 300.65 K W/m·K |
| 9001 | 63.980 | 306.154 | 19.6780 | .36457 | .18386 | .022 | .18193 |
| 9002 | 63.978 | 306.459 | 19.6629 | .46029 | .18445 | .014 | .18242 |
| 9003 | 63.978 | 306.788 | 19.6469 | .56726 | .18336 | .011 | .18121 |
| 9004 | 63.979 | 307.287 | 19.6229 | .68489 | .18479 | .009 | .18247 |
| 9005 | 63.979 | 307.741 | 19.6010 | .81392 | .18424 | .006 | .18176 |
| 9006 | 63.979 | 308.241 | 19.5769 | .95386 | .18427 | .005 | .18161 |
| 9007 | 61.905 | 306.849 | 19.1335 | .56688 | .18268 | .010 | .18051 |
| 9008 | 61.905 | 308.397 | 19.0601 | .95337 | .18285 | .005 | .18014 |
| 9009 | 59.692 | 306.827 | 18.5826 | .56708 | .18132 | .010 | .17916 |
| 9010 | 59.693 | 307.794 | 18.5380 | .81386 | .18250 | .007 | .18000 |
| 9011 | 57.621 | 306.382 | 18.0798 | .46038 | .17957 | .014 | .17756 |
| 9012 | 57.622 | 307.822 | 18.0144 | .81384 | .18141 | .006 | .17890 |
| 9013 | 55.588 | 306.292 | 17.5633 | .46046 | .17811 | .015 | .17614 |
| 9014 | 55.588 | 307.767 | 17.4977 | .81391 | .17947 | .006 | .17698 |
| 9015 | 53.338 | 306.324 | 16.9781 | .46030 | .17822 | .015 | .17623 |
| 9016 | 53.338 | 307.769 | 16.9154 | .81397 | .17892 | .007 | .17643 |
| 9017 | 51.292 | 306.429 | 16.4358 | .46023 | .17730 | .015 | .17528 |
| 9018 | 51.293 | 307.763 | 16.3793 | .81388 | .17749 | .006 | .17500 |
| 9019 | 49.069 | 306.377 | 15.8453 | .46028 | .17662 | .014 | .17462 |
| 9020 | 49.070 | 307.784 | 15.7876 | .81385 | .17682 | .006 | .17432 |
| 9021 | 46.963 | 306.311 | 15.2786 | .46031 | .17652 | .015 | .17454 |
| 9022 | 46.964 | 307.749 | 15.2211 | .81389 | .17577 | .006 | .17329 |
| 9023 | 44.676 | 306.361 | 14.6495 | .46023 | .17437 | .013 | .17237 |
| 9024 | 44.678 | 307.731 | 14.5966 | .81401 | .17554 | .006 | .17306 |
| 9025 | 42.449 | 306.396 | 14.0279 | .46025 | .17243 | .013 | .17042 |
| 9026 | 42.449 | 307.874 | 13.9726 | .81371 | .17387 | .006 | .17134 |
| 9027 | 40.222 | 306.328 | 13.4010 | .46013 | .17191 | .014 | .16992 |
| 9028 | 40.222 | 307.816 | 13.3472 | .81378 | .17336 | .006 | .17085 |
| 9029 | 38.053 | 306.321 | 12.7787 | .46027 | .17121 | .013 | .16923 |
| 9030 | 38.053 | 307.861 | 12.7251 | .81376 | .17216 | .006 | .16964 |
| 9031 | 35.850 | 306.292 | 12.1378 | .46029 | .17026 | .014 | .16829 |
| 9032 | 35.851 | 307.886 | 12.0847 | .81381 | .17134 | .006 | .16881 |
| 9033 | 33.592 | 305.206 | 11.5040 | .20675 | .16850 | .042 | .16691 |
| 9034 | 33.592 | 305.508 | 11.4943 | .28015 | .16954 | .029 | .16784 |
| 9035 | 33.592 | 305.853 | 11.4833 | .36455 | .16908 | .020 | .16726 |
| 9036 | 33.592 | 306.306 | 11.4688 | .46028 | .16863 | .014 | .16665 |
| 9037 | 33.593 | 306.741 | 11.4552 | .56704 | .17039 | .010 | .16826 |
| 9038 | 33.594 | 307.256 | 11.4389 | .68485 | .16933 | .008 | .16702 |
| 9039 | 33.594 | 307.857 | 11.4198 | .81389 | .17057 | .006 | .16805 |
| 9040 | 33.594 | 305.799 | 11.4856 | .36407 | .16952 | .020 | .16772 |
| 9041 | 33.594 | 306.338 | 11.4684 | .45965 | .16955 | .013 | .16756 |
| 9042 | 33.595 | 306.824 | 11.4531 | .56620 | .16952 | .011 | .16736 |
| 9043 | 33.595 | 307.313 | 11.4375 | .68391 | .16982 | .008 | .16749 |
| 9044 | 33.595 | 307.790 | 11.4223 | .81285 | .17030 | .006 | .16780 |
| 9045 | 33.595 | 308.438 | 11.4018 | .95255 | .17128 | .005 | .16855 |
| 9045 | 31.497 | 306.173 | 10.8425 | .46033 | .16840 | .013 | .16647 |
| 9046 | 31.497 | 307.807 | 10.7931 | .81402 | .16980 | .006 | .16730 |
| 9047 | 28.968 | 306.381 | 10.0629 | .46036 | .16811 | .013 | .16610 |
| 9048 | 28.968 | 307.941 | 10.0184 | .81396 | .16769 | .006 | .16514 |
| 9049 | 26.634 | 306.344 | 9.3369 | .46035 | .16695 | .014 | .16496 |
| 9050 | 26.634 | 307.965 | 9.2936 | .81397 | .16735 | .005 | .16479 |
| 9051 | 24.532 | 306.354 | 8.6709 | .46038 | .16588 | .014 | .16388 |
| 9052 | 24.532 | 307.963 | 8.6306 | .81417 | .16621 | .006 | .16365 |
| 9053 | 22.396 | 306.379 | 7.9829 | .46046 | .16482 | .013 | .16281 |
| 9054 | 22.395 | 308.019 | 7.9445 | .81418 | .16552 | .006 | .16294 |
| 9055 | 20.255 | 306.511 | 7.2793 | .46102 | .16399 | .013 | .16194 |
| 9056 | 20.255 | 308.186 | 7.2434 | .81536 | .16490 | .006 | .16226 |
| 9057 | 17.991 | 306.347 | 6.5288 | .46009 | .16298 | .014 | .16099 |
| 9058 | 17.913 | 308.066 | 6.4692 | .81378 | .16397 | .006 | .16137 |
| 9059 | 15.627 | 305.967 | 5.7333 | .36458 | .16262 | .018 | .16076 |
| 9060 | 15.627 | 306.425 | 5.7254 | .46017 | .16148 | .012 | .15946 |
| 9061 | 15.626 | 306.897 | 5.7170 | .56700 | .16220 | .010 | .16001 |
| 9062 | 15.626 | 307.578 | 5.7052 | .68465 | .16218 | .008 | .15976 |
| 9063 | 15.626 | 308.170 | 5.6951 | .81363 | .16305 | .006 | .16042 |
| 9064 | 13.436 | 305.988 | 4.9748 | .36453 | .16032 | .019 | .15841 |
| 9065 | 13.436 | 307.519 | 4.9516 | .68483 | .16199 | .007 | .15959 |
| 9066 | 11.253 | 305.990 | 4.2056 | .36453 | .16059 | .019 | .15872 |
| 9067 | 11.253 | 307.633 | 4.1844 | .68454 | .16030 | .008 | .15786 |
| 9068 | 9.013 | 305.969 | 3.4013 | .36451 | .15889 | .019 | .15703 |
| 9069 | 9.013 | 307.727 | 3.3827 | .68445 | .15957 | .007 | .15709 |
| 9070 | 6.648 | 305.860 | 2.5362 | .36460 | .15773 | .012 | .15591 |
| 9071 | 6.648 | 307.452 | 2.5232 | .68476 | .15851 | .006 | .15613 |
| 9072 | 4.466 | 305.982 | 1.7199 | .36440 | .15684 | .016 | .15497 |
| 9073 | 4.466 | 307.438 | 1.7119 | .68485 | .15705 | .008 | .15467 |
| 9074 | 2.419 | 306.028 | .9401 | .36441 | .15672 | .023 | .15484 |
| 9075 | 2.418 | 307.670 | .9349 | .68458 | .15595 | .012 | .15349 |
| 9076 | .415 | 306.143 | .1627 | .36423 | .15477 | .222 | .15285 |
Figure 13.
Helium measurements shifted to 300.65 K with curve fit, eq (9).
Figure 14.
Comparison of the present results with those of others for helium at 300.65 K. Base line eq (9), △ this paper, □ Kestin, et al. [7], ◇ Le Neindre, et al. [34], * Johannin, et al. [35], O Ho and Leidenfront [36], —— McCarty [37] correlation.
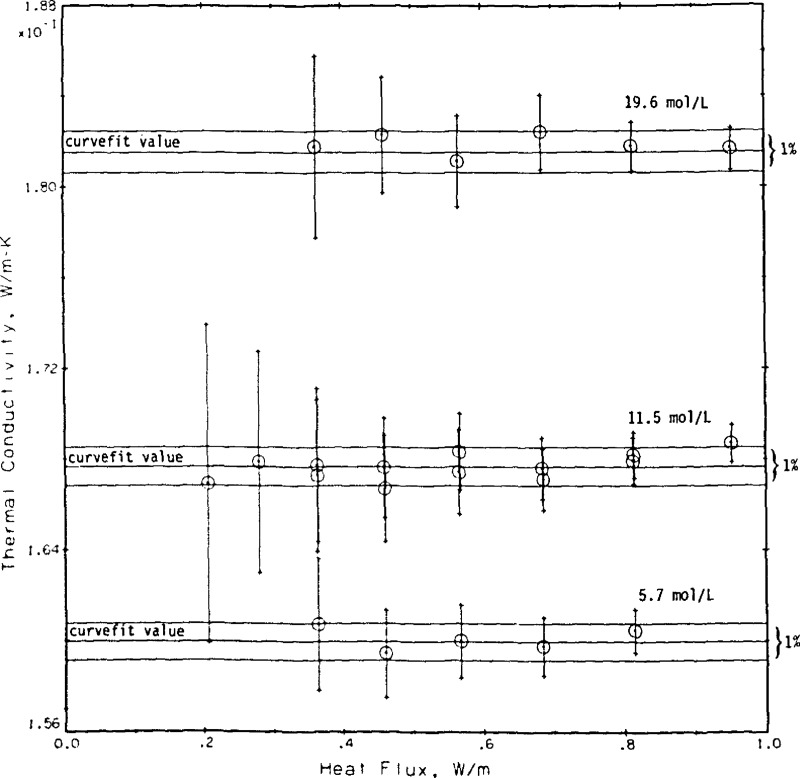
Finally, we apply a test that has not been applied extensively to other transient hot wire systems. In analogy to a flat plate steady state thermal conductivity apparatus [38] we insist that the measured thermal conductivity in the present apparatus should be independent of the applied power. Figure 15 shows the measurements for helium gas at 19.6, 11.5, and 5.7 mol/L plotted as a function of the applied power. Whereas q changes by a factor of nearly five no dependence of the measured conductivity on power level is discernible. For reference, the values of the curve fit (eq (9)) plus or minus 0.5 percent are shown as three straight lines for each density in figure 15. The error bars for each point are those originating from the regression straight line fit for each point, see column STAT in table 4.
Figure 15.
Measured thermal conductivity as a function of the applied power. Apparatus test with helium gas.
6.3. Cell Alinement
During the construction of the apparatus we sought to keep the cell in vertical alinement to insure that convection in the cell would be delayed as long as possible. Later we sought to verify the alinement by a series of experimental measurements, some 162 points with oxygen gas as a sample at a pressure near 10 MPa and a temperature of around 240 K. The position of each cell alinement screw was varied in turn by a measured amount. For each setting of the screws a series of seven to nine measurements were taken varying the applied power, q. If the cell is out of alinement the measured thermal conductivity increases. The increase is more pronounced at the higher power levels. The proper setting for the alinement screws occurs when the measured results are most nearly independent of q as illustrated in figure 15. The final settings chosen were nearly identical to those first achieved during construction of the apparatus. In fact, the measurements on helium, Run No. 9, were taken four months before the series on alinement, Run No. 19.
6.4. Other Tests
Tests were run on nitrogen gas at room temperature with only a single hot wire in the bridge. The circuit was rewired so that either R4 or R3, see figure 2, were replaced by yet another 100 Ω standard resistor. The data reduction program had to be modified accordingly. The results were evaluated only on the minicomputer, and are relative to similar measurements made the same day with the full bridge. The apparent conductivities for the single wires increase above those of the full bridge as follows
| full bridge | 1.000 |
| long hot wire only | 1.048 |
| short hot wire only | 1.083. |
Measurements of this type show the relative effect of the end corrections which would be required for the single wire, but which are presumed to be off setting in the bridge circuit.
7. Errors
Precision, reproducibility, internal consistency, and accuracy are discussed here.
Precision
The measurement variation in the voltages across the Wheatstone bridge is ±28 μV which corresponds to about 25 mK. The effective errors in the experimental ΔT values are 6 percent for the very small power levels, i.e., a final ΔT of about 0.5 K, to 0.4 percent for a final ΔT of about 6 K. An example of the distribution of the experimental ΔT’s about the calculated straight line was shown in figure 8b. The regression program accounts for the spread in measurements by assigning a variance to the coefficients of the calculated straight line. The value STAT as printed in tables 3 and 4 is the fractional error in the slope of the straight line obtained from the variance in the slope (2σ) divided by by the slope itself. The value STAT is the primary measure of the experimental precision because other contributions such as an error in q are quite negligible. For final ΔT values of 3.5 K or more which includes about 70 percent of all measurements made to date the nominal precision (2σ) is 0.6 percent or slightly less.
Reproducibility was tested by measuring (a) repeatedly the same point at the same fluid conditions on a given day, (b) by measuring similar points at different power levels, and (c) by repeating different isotherms at different times some months apart. Examples of (a) are found in table 3, examples of (b) are given in the sections on nitrogen and helium. For (c), isotherms at 160 K, 200 K, and 240 K were repeated during the measurements on oxygen [26].
Internal consistency
When measurements are made over a large portion of the thermal conductivity surface, and if an analytical function is used to represent the surface, then it becomes possible to check the internal consistency of the set of measurements by intercomparing the deviations and deviation patterns for the various isotherms. Such checks are possible for both propane [27] and oxygen [26]. In propane seven different liquid isotherms can be represented with an overall deviation of 1.2 percent (2σ). For oxygen, 13 isotherms from the surface which includes gas, liquid, subcritical vapor and the near critical region for an average deviation of 1.6 percent.
Accuracy
The accuracy of the measurement can in principle be established from the measurements and certain theoretical considerations, i.e., for the rare gases the Eucken factor [7]. For argon [30] the 0.3 percent obtained in the low density extrapolation was considered a fortunate coincidence and an overall accuracy of ±1 percent was claimed. For the results on helium in table 4 the low density extrapolation yields a result which is 1.8 percent low. Accuracy can also be estimated by comparison to the results of others. For the present apparatus these intercomparisons cover a wide range of fluids, and a wide range of pressures, densities and temperatures. Summarized these comparisons are:
Nitrogen: this apparatus is 1.3 to 2.3 percent lower than other authors [31,32,33].
Helium: this apparatus is 1. to 1.8 percent lower than other authors [7,34,35,36,37].
Argon: this apparatus is 1. percent lower than other authors [30].
Oxygen: this apparatus is 1–2 percent lower than other authors [26].
Propane: this apparatus is higher at some densities, lower at other densities when compared to other authors [27].
Hydrogen: this apparatus is 1.5 percent lower than other authors [39].
8. Summary
A new transient hot wire thermal conductivity apparatus for fluids has been developed. It differs from some of the other transient hot wire systems in that it uses compensating wires in a Wheatstone bridge arrangement. It differs from those transient hot wire systems that use a bridge in that the voltages developed across the bridge are measured directly. The apparatus is a very rapid measuring device. Sixty points, a full pseudo-isotherm, are possible in a day. The system is capable of measuring a wide range of fluid temperatures, densities, and pressures. Fluid states, such as dilute gas, dense gas, the near critical states, vapor at temperatures below critical, compressed liquid states, and metastable liquid states at densities below saturation, are accessible for many liquefied gases. A wide variety of simple fluids has been measured in the system so far. It appears that the precision of the new system is on the order of 0.6 percent while its accuracy is close to 1.5 percent.
Acknowledgments
This work was carried out at the National Bureau of Standards under the sponsorship of the National Aeronautics and Space Administration (C-32369-C).
Appendix I. The Minicomputer Program
Appendix II. Data for Point 9044, Helium Gas
Appendix III. The Helium Data Reduction Program
Footnotes
Figures in brackets indicate literature references at the end of this paper.
9. References
- [1].Pittman J. F. T. Fluid thermal conductivity determination by the transient line source method. Thesis University of London; London; 1968. [Google Scholar]
- [2].Haarman J. W. Thesis Technische Hogeschool; Delft; 1969. [Google Scholar]
- [3].Mani N. Precise determination of the thermal conductivity of fluids using absolute transient hot-wire technique. Thesis University of Calgary. Calgary, Alberta, Canada: 1971. August. [Google Scholar]
- [4].de Groot J. J.; Kestin J.; Sookiazian H. Instrument to measure the thermal conductivity of gases. Physica. 75: 454–482; 1974. [Google Scholar]
- [5].Healy J. J.; de Groot J. J.; Kestin J. The theory of the transient hot wire method for measuring thermal conductivity. Physica 82C(2): 392–408; 1976. April. [Google Scholar]
- [6].de Groot J. J.; Kestin J.; Sookiazian H. The thermal conductivity of four monatomic gases as a function of density near room temperature. Physica. 92A: 117–144; 1978. [Google Scholar]
- [7].Kestin J.; Paul R.; Clifford A. A.; Wakeham W. A. Absolute determination of the thermal conductivity of the noble gases at room temperature up to 35 MPa. Physica 100A(2): 349–369; 1980. February. [Google Scholar]
- [8].Kestin J.; Wakeham W. A. A contribution to the theory of the transient hot-wire technique for thermal conductivity measurements. Physica. 92A(1 and 2): 102–116; 1978. June. [Google Scholar]
- [9].Clifford A. A.; Kestin J.; Wakeham W. A. A further contribution to the theory of the transient hot-wire technique for thermal conductivity measurements. Physica. 100A(2): 370–374; 1980. February. [Google Scholar]
- [10].Assael M. J.; Dix M.; Lucas A.; Wakeham W. A. Absolute determination of the thermal conductivity of the noble gases and two of their binary mixtures. J. Chem. Soc., Faraday Trans. 77(1): 439–464; 1981. [Google Scholar]
- [11].Menashe J.; Wakeham W. A. Absolute measurements of the thermal conductivity of liquids of pressures up to 500 MPa. to be published, Physica. [Google Scholar]
- [12].de Castro C. A. Nieto; Calado J. C. G.; Wakeham W. A.; Dix M. An apparatus to measure the thermal conductivity of liquids. Journal of Physics E: Scient. Inst. 9: 1073–1080; 1976. [Google Scholar]
- [13].de Castro C. A. Nieto; Calado J. C. G.; Wakeham W. A. Absolute measurements of the thermal conductivity of liquids using a transient hot-wire technique. Cezarilyan A. ed. Proceedings of the seventh symposium on thermophysical properties; 1977 May 10–12; Gaithersburg, Maryland; New York; ASME; 1977; 730–738. [Google Scholar]
- [14].Carslaw H. S.; Jaeger J. C. Conduction of heat in solids. 2nd Ed. Oxford: University Press; 1959. 510 p. [Google Scholar]
- [15].Riddle J. L.; Furukawa G. T.; Plumb H. H. Platinum Resistance Thermometry. Nat. Bur. Stand. (U.S.) Monogr. 126; 1973. April 129 p. [Google Scholar]
- [16].Lyman T., ed. Metals Handbook 8th Ed. Vol 1 Properties and Selection of Metals. American Society for Metals; Metals Park, Ohio; 1969. September 1300 p. [Google Scholar]
- [17].Younglove B. A. Speed of sound in fluid parahydrogen. J. Acoust. Soc. Am. 38(3): 433–438; 1965. September. [Google Scholar]
- [18].Diller D. E. Measurements of the viscosity of parahydrogen. J. Chem. Phys. 42(6): 2089–2100; 1965. March 15. [Google Scholar]
- [19].Weber L A. Density and compressibility of oxygen in the critical region. Phys. Rev. A 2(6): 2379–2388; 1970. December. [Google Scholar]
- [20].Haynes W. M.; Hiza M. J.; Frederick N. V. Magnetic suspension densimeter for measurements on fluids of cryogenic interest. Rev Sci. Instrum. 47(10): 1237–1250; 1976. October. [Google Scholar]
- [21].Straty G. C.; Younglove B. A. A fluorine compatible low temperature electrical feed through. Rev. Sci. Instrum. 43(1): 156–157; 1972. January. [Google Scholar]
- [22].Key C. F. Compatibility of materials with liquid oxygen, III National Aeronautics and Space Administration, Marshall Space Flight Center, Huntsville, Ala; Tech. Memo X67–10596; 1966. November. [Google Scholar]
- [23].Bankaitis H.; Schueller C. F. ASRDI Oxygen technology survey Volume II: cleaning requirements, procedures, and verification techniques. National Aeronautics and Space Administration Special Publication; SP-3072; 1972. 76 p. [Google Scholar]
- [24].Goodwin R. D. Apparatus for determination of pressure-density-temperature relations and specific heats of hydrogen to 350 atmospheres at temperatures above 14 K. J. Res. Nat. Bur. Stand. (U.S.) 65C(4): 231–243; 1961. Oct-Dec. [Google Scholar]
- [25].Goodwin R. D. An improved DC power regulator. Timmerhaus K. D., ed. Advances in Cryogenic Engineering. Proceedings of the 1959 Cryogenic Engineering Conference Plenum Press Inc., New York; 1960. 577–579. [Google Scholar]
- [26].Roder H. M. The thermal conductivity of oxygen. J. Res. Nat. Bur. Stand. (U.S.). to be published. [DOI] [PMC free article] [PubMed] [Google Scholar]
- [27].Roder H. M.; de Castro C. A. N. Thermal conductivity of liquid propane. Submitted to J. Chem. Engr. Data. [Google Scholar]
- [28].Hall L. A. Survey of electrical resistivity measurements on 16 pure metals in the temperature range 0 to 273 K. Nat. Bur. Stand. (U.S.) Tech. Note 365; 1968. February 111 p. [Google Scholar]
- [29].de Castro C. A. Nieto; Wakeham W. A. Experimental aspects of the transient hot-wire technique for thermal conductivity measurements Mirkovich V. V. ed. Thermal conductivity 15 1977. August 24-26; Ottawa, Ontario, Canada; New York; Plenum Publ. Corp.; 1978; 235–243. [Google Scholar]
- [30].de Castro C. A. N.; Roder H. M. Absolute determination of the thermal conductivity of argon at room temperature and pressures up to 68 MPa. J. Res. Nat. Bur. Stand. (U.S.). 86(3): 293–307; 1981. May-Jun. [DOI] [PMC free article] [PubMed] [Google Scholar]
- [31].Clifford A. A.; Kestin J.; Wakeham W. A. Thermal conductivity of N2, CH4, and CO2 at room temperature and at pressures up to 35 MPa. Physica. 97A(2): 287–295; 1979. July. [Google Scholar]
- [32].Assael M. J.; Wakeham W. A. Thermal conductivity of four poly atomic gases. J. Chem. Soc., Faraday Trans. 77(1): 697–707; 1981. [Google Scholar]
- [33].Hanley H. J. M.; McCarty R. D.; Haynes W. M. The viscosity and thermal conductivity for dense gaseous and liquid argon, krypton, xenon, nitrogen and oxygen. J. Phys. Chem. Ref. Data 3(4): 979–1017; 1974. [Google Scholar]
- [34].Le Neindre B.; Bury P.; Tufeu R.; Johannin P.; Vodar B. Recent developments at Bellevue on thermal conductivity measurements of compressed gases. Flynn D. A.; Peavy B. A. Jr. ed. Thermal conductivity; Proceedings of the seventh conference; 1967 November 13–16; Gaithersburg, Maryland Nat. Bur. Stand. (U.S.) Spec. Publ. 302; 1968 September. 579–593. [Google Scholar]
- [35].Johannin P.; Wilson M.; Vodar B. Heat conductivity of helium at elevated temperatures Masi J. F.; Tsai D. H. ed. Progress in International Research on Thermodynamic and Transport Properties. Academic Press, New York: 1962. 418–433. [Google Scholar]
- [36].Ho C. W.; Leidenfrost W. Precise determination of the thermal conductivity of helium gas at high pressures arid moderate temperatures Grigull U.; Hahnl E. eds. Progress in Heat and Mass Transfer. Pergamon Press, Oxford; 1969. 55–98. [Google Scholar]
- [37].McCarty R. D. Thermophysical properties of helium-4 from 2 to 1500 K with pressures to 1000 atmospheres. Nat. Bur. Stand. (U.S.) Tech. Note 631; 1972. November 161 p. [Google Scholar]
- [38].Roder H. M.; Diller D. E. Thermal conductivity of gaseous and liquid hydrogen. J. Chem. Phys. 52(11): 5928–5949; 1970. June 1. [Google Scholar]
- [39].Roder H. M. Thermal conductivity of normal hydrogen. Presented at the 17th International Thermal Conductivity Conference Gaithersburg, Maryland; 1981 June 15–18. [Google Scholar]


