Abstract
The long-spacings of the compounds methyl stearate, ethyl stearate, n-butyl stearate, 2-non-adecanone, n-eicosane, n-hexatriacontane and n-tetratetracontane have been examined as a function of temperature by means of low-angle x-ray diffraction. The intensity of the long-spacing was also determined versus temperature. The effect of annealing temperature and time was examined by means of the DSC. Dielectric loss was studied in two crystalline phases of n-butyl stearate.
Keywords: Dielectric loss, n-paraffins. phase transitions, x-ray scattering
1. Introduction
Various aspects of the properties of long-chain compounds have been studied by many workers over the years. For example, the crystal structure, as well as the heats and temperatures of transitions are basic properties which have been established for a number of compounds [1, 2].1
In this article some of the thermal properties of several long-chain esters and n-paraffins are presented. In particular, the differential scanning calorimeter (DSC) has been used to investigate the dependence of the DSC traces on the temperature and time of annealing.
All of these compounds crystallize in a lamellar form and the thickness of the lamellae depends both on the molecular length and the thermal history of the sample. The dependence of this lamellar thickness on temperature for the paraffins, esters and ketone has been studied by means of low-angle x-ray scattering. In an earlier article [3] we have found that the intensity of the long-spacing may increase with increasing temperature for n-paraffins. Similar observations have been made by Fischer et al. [4, 5]. In this article the dependence of the intensity of the long-spacing on temperature was further investigated and in particular samples with and without solid-solid phase transitions were examined. Dielectric loss was studied for n-butyl stearate.
2. Experimental Detail
2.1. Apparatus
a. X-Ray Diffraction
X-ray diffraction was observed using nickel-filtered Cu radiation collimated with a Kratky2 low-angle camera. The detector system was a scintillation counter with pulse height analyzer. The sample holder consisted of an insulated box with beryllium windows; temperature control was achieved with a thermistor system, as described in an earlier article [3]. All temperatures in the x-ray experiments are within ± 0.5 K.
b. Differential Scanning Calorimetry (DSC)
All samples were examined at a heating rate of 2.5 K/min (unless otherwise specified). Samples examined below 320 K involved the use of the liquid nitrogen jacket. The annealed samples were maintained at the desired temperatures in a separate bath and then transferred to the precooled DSC holder.
c. Melting Ranges
The melting ranges (± 0.1 K) of the various samples were determined by means of an optical microscope and a Mettler FP21 hot stage, at a heating rate of 0.2 K/min. No correction was made on the temperatures for the effect of heating rate.
d. Dielectric Loss
The capacitance and dissipation factor of the sample over the frequency range 2 × 10² Hz to 5 × 10⁴ Hz were determined using a General Radio 1615 transformer ratio arm bridge. Over the frequency range 10 Hz to 2 × 10² Hz, the Scheiber low frequency bridge [6] was employed. A three terminal cell with gold plated electrodes was used and the cell was kept in a constant temperature bath (±0.5 K). The cell was kept under a positive nitrogen pressure in order to keep the sample dry. A small gap (0.35 mm) was allowed between the top electrode and the sample in order to allow for sample expansion. The dielectric loss ϵ″ (ν) was determined from the measured values of sample capacitance and dissipation factor, using a correction term to account for the gap capacitance. Because of uncertainties in the sample thickness, the estimated uncertainty in ϵ″ (ν) is 10 to 20 percent.
2.2. Samples
Since homologous impurities often occur in these compounds, some attempt was made to determine the composition and to improve the purity. Solution crystallization is one means of purification and Brown [7] and Sedgwick [8] et al. have discussed the solubility of the esters in various solvents. All samples were dried under vacuum.
a. Methyl Stearate
Commercial methyl stearate was examined on a gas chromatograph (apiezon packed column, helium carrier gas) and was found to contain at least 3 percent impurities. For this reason the purification techniques of zone refining, vacuum distillation and solution recrystallization were examined on various samples. Based on gas chromatograph analyses, the technique of solution recrystallization from acetone appears to be the quickest and most effective means of removing the impurities involved. The method of solution recrystallization employed was at a concentration of 15 g ester to 1500 ml (reagent grade) acetone. The solution was kept at 268 K until crystallization occurred (a few hours) and the crystals removed by filtration. A total of three recrystallizations were performed; the crystals were then melted and passed through a fine glass frit in order to remove particulate matter.
b. Ethyl Stearate
Similarly, commercial ethyl stearate was examined on the gas chromatograph and was found to contain more than 20 percent impurities. Solution recrystallization from acetone (at 261 K) as above was found to remove the impurities observable by gas chromatography.
c. n-Butyl Stearate
Commercial n-butyl stearate was recrystallized twice from acetone as above at 257 K. A gas chromatograph analysis of the sample showed that a 1 percent higher molecular weight impurity still remained. Further recrystallization did not remove this impurity.
d. 2-Nonadecanone
Commercial 2-nonadecanone was examined on the gas chromatograph and was found to contain approximately 5 percent impurities. The sample was vacuum distilled and the middle fraction, bp 438 to 440 K, was collected. The sample was then recrystallized from acetone as above at 273 K. This process was found to remove the impurities.
e. n-Eicosane [n-C20H42]
Commercial n-eicosane (listed as 99%) was examined on the gas chromatograph and no homologous impurities were found. The sample was recrystallized from acetone as above at 283 K.
f. n-Hexatriacontane [n-C36H74]
Commercial n-C36H74 was recrystallized four times from benzene (15 g paraffin to 1500 ml benzene). Crystallization occurred at approximately 311 K.
g. n-Tetratetracontane [n-C44H90]
A 0.2 g portion of the n-C44H90 sample synthesized by Clark [9] was recrystallized from 40 ml of benzene. Crystallization occurred at approximately 313 K.
3. Results
3.1. Methyl Stearate
a. DSC Studies
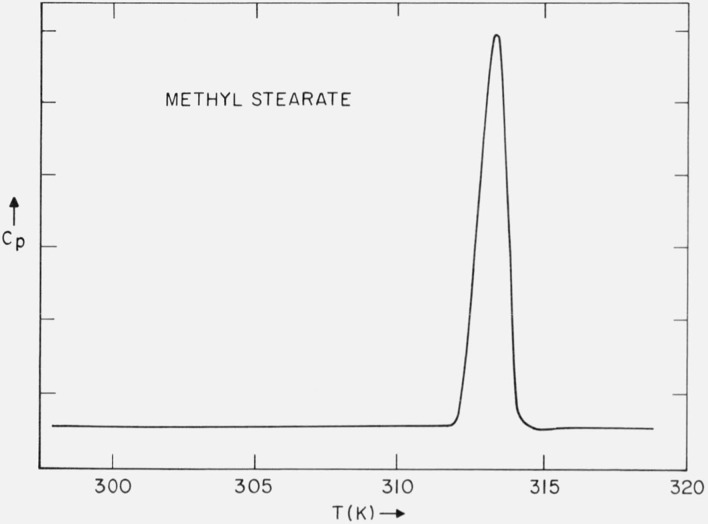
A typical DSC curve of the purified methyl stearate is shown in figure 1. The heating rate is 2.5 K/min. The purification scheme led to an increase in the melting point. Further purification did not increase the melting point nor decrease the width of the curve. The observed melting range for the solution crystallized samples was 311.0 to 312.6 K (optical microscope); for melt crystallized samples, 310.8 to 311.4 K.
Figure 1.
DSC trace of methyl stearate.
b. X-Ray Scattering
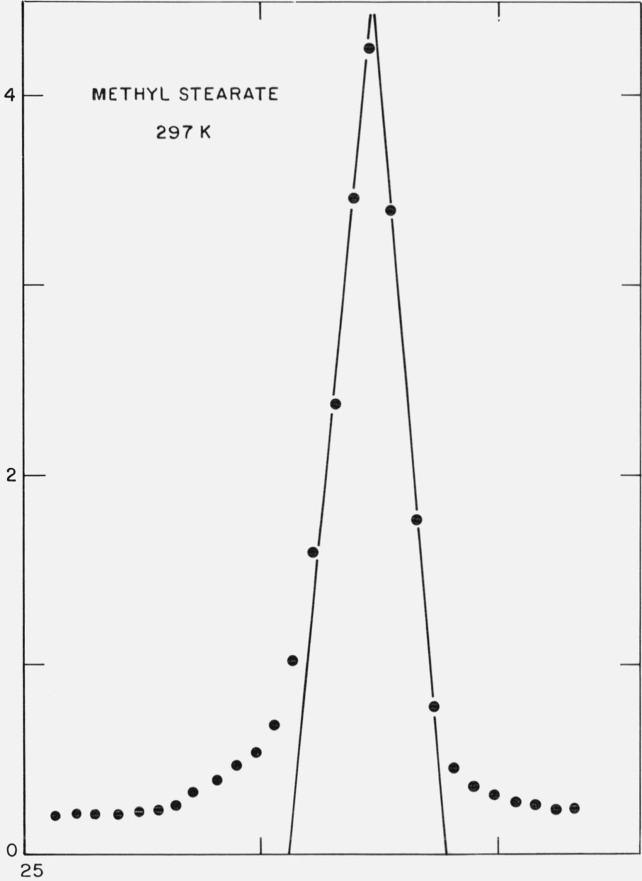
Since it was somewhat more convenient to handle solution recrystallized samples in the x-ray sample holder, a portion of the previously purified methyl stearate was further recrystallized from acetone (15 g/1500 ml) and dried under vacuum. Strips of the dried filter cake were placed in the sample holder and the scattering of x-rays at small-angles was examined as a function of temperature. The first order diffraction maximum is shown in figure 2 and corresponds to a Bragg spacing of 47.4 Å. This is consistent with the (002) diffraction maximum of the monoclinic form of methyl stearate [10]. In table 1 are shown the values of this diffraction maximum (normalized to the value at 235 K) over the temperature range 235 K ⩽ T ⩽ 307 K. The long-spacing was constant within 0.1 Å up to 312.3 K, at which temperature the sample was found to be slowly melting. No decrease in the intensity of this long-spacing occurred up to 312.0 ±0.15 K, so that the melting point of the sample must be above this temperature.
Figure 2.
X-ray diffraction from methyl stearate at 297 K.
Table 1.
X-ray diffraction intensities and long-spacings as a function of temperature for methyl and ethyl stearate
| Methyl stearate | Ethyl stearate | ||||
|---|---|---|---|---|---|
| T(K) | A(T) /A(235K) | l(Å) | T(K) | A(T) /A(235K) | l(Å) |
| 307 | 1.0 | 47.3 | 297 | 1.0 | 25.1 |
| 297 | 1.0 | 47.3 | 273 | 1.0 | 25.0 |
| 272 | 1.0 | 47.4 | 250 | 1.0 | 25.1 |
| 254 | 1.0 | 47.4 | 235 | 1.0 | 25.1 |
| 235 | 1.0 | 47.4 | |||
c. Discussion
The DSC trace (fig. 1) indicates only a single phase transition. However, there is evidence in the literature of more than one crystalline form. For example, Aleby and von Sydow [10] report two different melting points. Also Simonelli [11] found in a dilatometric study that the data was consistent with a solid-solid phase transtion near the melting point. Guy and Smith [12] report a transition at 310.7 K. And Smit [13] reports that the rate of the solid-solid phase transition within 0.5 K of the melting point is extremely slow. Craig [14] has found hysteresis in the volume as a function of temperature for solid methyl stearate, such that the specific volume at any temperature depends on the previous thermal history of the sample. And finally, Markley [1] also indicates two mp’s. We note that the mp of 312.3 K observed in this study by means of the decrease in the intensity of the (002) maximum is in agreement with the value observed with the optical microscope (311.9 to 312.6 K) and with that found by Francis [15] and by Aleby [10].
Since the long-spacing of the solution recrystallized form is constant up to the mp and this form exhibits the higher mp, it appears likely that this form does not undergo any solid-solid phase transitions. Based on the literature cited above and on the observation in this article that the melt crystallized form has a lower mp, it is probable that the form which crystallizes from the melt slowly transits to the more stable form. It appears that under the conditions of the experiment, the DSC is unable to resolve the phase transition in melt crystallized methyl stearate, since it occurs too close to the mp and proceeds too slowly.
3.2. Ethyl Stearate
a. DSC Studies
A DSC trace of the purified ethyl stearate (final stage of purification was solution recrystallization) is shown in figure 3a. The corresponding melting range – as determined on the optical microscope – was 306.9 to 307.3 K. When a sample was crystallized from the melt – but cooled no lower than 298 K – the subsequent DSC trace on heating is as shown in figure 3b. The melting range now observed was 304.6 to 304.8 K (on the optical microscope). The average difference in the mp’s of the two forms, based on the DSC scans and the observations on the optical microscope, was 2.4 K. Francis and Piper [15] reported mp’s of 304.6 K and 307.1 K for the α and γ forms respectively, i.e., a difference of 2.5 K.
Figure 3.
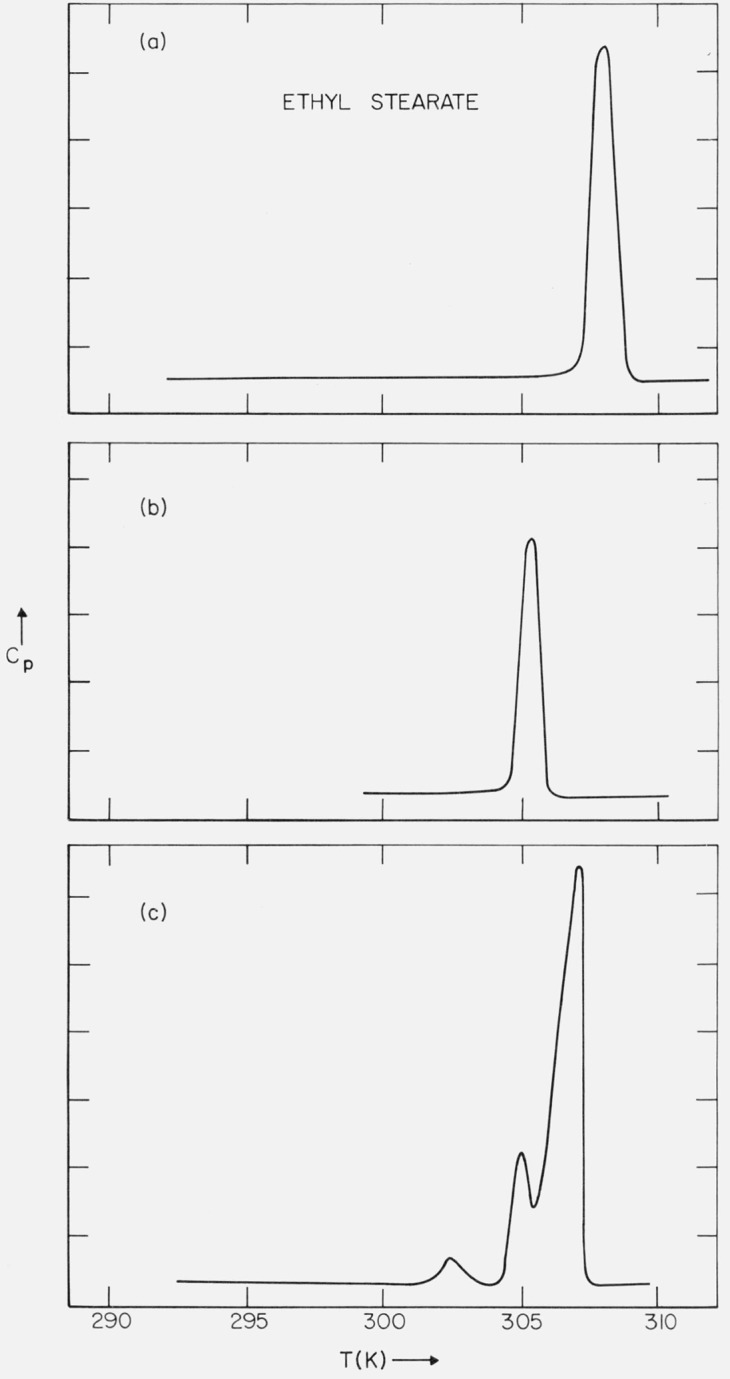
(a) DSC trace of solution-recrystallized or annealed ethyl stearate; (b) DSC trace of melt-crystallized ethyl stearate (sample cooled to 298 K); and (c) DSC trace of melt-crystallized ethyl stearate (sample cooled below 298 K).
Based on the areas under the melting transitions on the DSC scans – and on the literature value [16] for the heat of fusion of n-C20H42 (as a calibration of the DSC), i.e., 16.70 kcal/mol, then the heat of fusion of the form melting at 306.9 to 307.3 K is approximately 15.5 kcal/mol; the heat of fusion of the form melting at 304.6 to 304.8 K is approximately 9.8 kcal/mol.
When a sample was crystallized from the melt – and cooled below 298 K – a solid-solid phase transition was observed in the DSC trace at 296 K (cooling rate 2.5 K/min). This transition was also observed on the optical microscope at 296.6 K (cooling rate 2 K/min). When this sample was subsequently reheated, the DSC trace was as indicated in figure 3c. The transition in figure 3b and the middle transition in figure 3c occurred at the same temperature.
The melt recrystallized form (i.e., fig. 3c) slowly transformed to the higher melting form, which exhibits no solid-solid phase transitions (i.e., fig. 3a). The rate of the transformation of the lower melting form to the higher melting form (i.e., fig. 3c → fig. 3a) was found to be temperature dependent. At 293 K, about 30 days is required; at 273 K, more than 120 days. The lowest temperature transition shown in figure 3c was found to slowly merge with the higher temperature transitions. The time required for this process was observed to be temperature dependent. At 296 K, the time required was 2 hours; at 293 K, 7 hours; at 284 K, 90 hours; at 281 K, 240 hours; at 273 K, 1630 hours.
b. X-Ray Scattering
(i). Temperature Dependence of the Intensity of the Low-Angle Diffraction
Strips of the dried filter cake from the acetone-recrystallized ethyl stearate were placed in the sample holder and the small-angle scattering examined. The first order diffraction maximum corresponds to a spacing of 25.4 Å, which is in agreement with the (002) spacing of the monoclinic form (also solution crystallized) found by Aleby [17]. In table 1 are shown the value of this long spacing and the relative integrated intensity of the diffraction maximum (normalized to the value at 235 K) over the temperature range 235 ⩽ T ⩽ 297 K. The long spacing was found constant within 0.1 Å.
A quenched sample of ethyl stearate was prepared by pouring a portion of the melt into a beaker at the temperature of liquid nitrogen. This sample was ground into a powder and dried for 3 hours under vacuum. A DSC scan of this sample was as indicated in figure 3c. The low-angle scattering was examined periodically over a period of 26 days at room temperature and the long-spacing of 25.4 Å was constant within 0.1 Å. A DSC scan was taken of the (x-rayed) sample after 26 days and corresponded to figure 3a. There was also no significant change in the observed intensity of the (002) diffraction maximum over the 26 day period.
(ii). Solid-Solid Phase Transformation
A sample of ethyl stearate was melted in the x-ray sample holder. The liquid was cooled below its melting point and the freshly crystallized sample was observed to always exhibit a long-spacing of 28.5 Å. The 28.5 Å spacing corresponds to the molecule in an extended (nontilted) form. The long-spacing spontaneously changed to the 25.4 Å form and the time for the completion of the transformation,
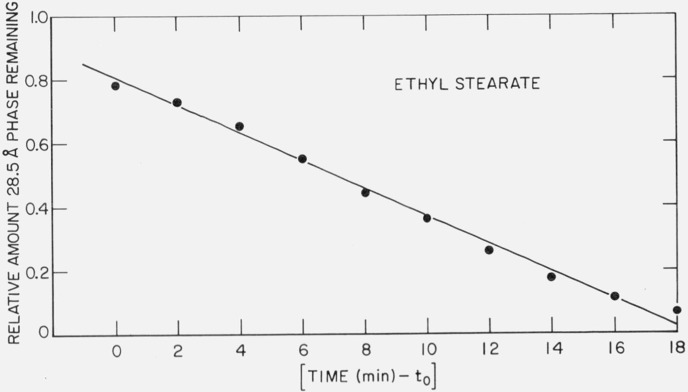
was found to be strongly temperature dependent. In table 2 is shown the amount of time as a function of temperature to complete the transformation l(28.5 Å) → l(25.4 Å). It was also found that this transformation was irreversible, i.e., the reverse reaction, l(25.4 Å) → l(28.5 Å), was not found to occur when either partially transformed or completely transformed samples were subsequently reheated. The relative amount transformed was approximately linear with time. This is illustrated in figure 4 for the transformation at 299.3 K. The ordinate is the relative amount of the 28.5 Å phase remaining, as determined by where I(t) is the intensity of the (002) diffraction maximum (either peak height or integrated intensity) as a function of time. There is an induction time for the start of the transformation, as reflected by the t0 term in the abscissa. At 302.4 K, t0 is approximately 300 min, at 300.8 K, 40 min.
Table 2.
Time dependence as a function of temperature for the long-spacing transition l(28.5 Å) → l(25.4 Å) for ethyl stearate
| Ethyl stearate | |
|---|---|
| T(K) |
l(28.5 Å) → l(25.4Å) time required (min.) |
| 303.9 | 2075 |
| 303.2 | 725 |
| 302.4 | 475 |
| 301.7 | 307 |
| 300.8 | 135 |
| 299.3 | 20.5 |
| 297.9 | 4.1 |
Figure 4.
Time dependence for the phase transition l(28.5 Å) → l(25.4 Å) at 299.3 K.
c. Discussion
The x-ray and DSC data are consistent with at least four crystalline forms. The crystal structure of the stable form (i.e., fig. 3a) has been studied by Aleby [17]. As with methyl stearate, ethyl stearate was also observed to undergo very slow solid-solid phase transformations. The intensity of the long-spacing of the stable form was found to be temperature independent in the range covered. However, one should also notice that the intensity of the long-spacing of the quenched sample – which did undergo solid-solid phase transitions, but no tilt transition during and after the initial x-ray scan – was also independent of temperature. The long-spacing of the quenched sample was constant at 25.4 Å over the period of 26 days at 297 K – during which time the DSC scans went from that corresponding to figure 3c to that of figure 3a. This indicates that none of the DSC transitions of figure 3c are associated with tilt transitions. All of the DSC transitions on heating occur for the 25.4 Å spacing and so involve some kind of rotational reorganization with respect to the lateral packing of the molecules. The solid-solid transition which occurs at 296 K on a DSC cooling curve probably is associated with the tilt transition (see table 2), since the rate of the transition becomes large around this temperature. The observed long-spacings of 28.5 Å and 25.4 Å agrees within 0.1 Å of the values reported by Malkin [18].
3.3. n-Butyl Stearate
a. DSC Studies
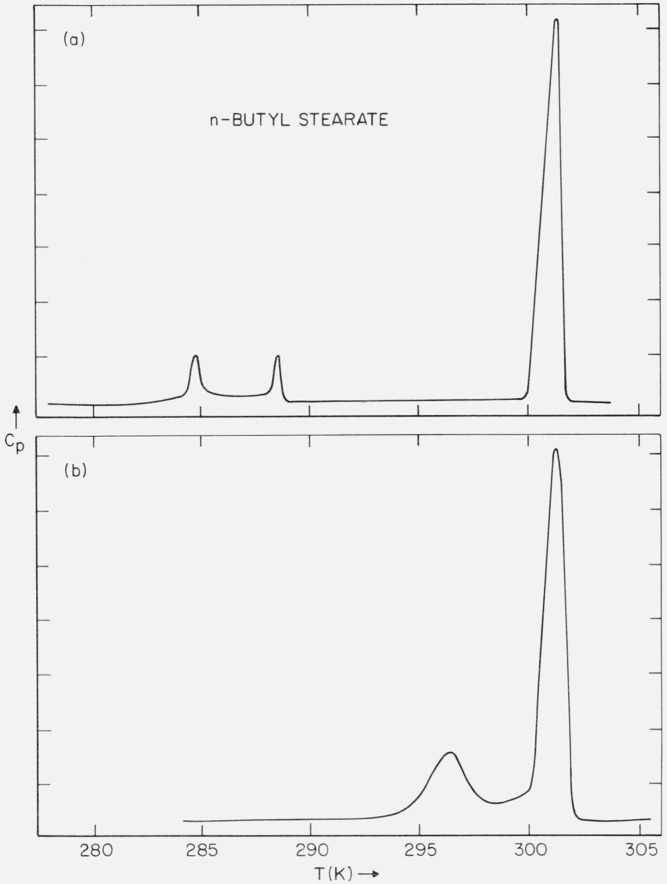
While the original sample was found to have a broad melting range, the purified sample was found to have a sharp melting point. A typical DSC curve of the purified sample is shown in figure 5a. In addition to the solid-liquid transition at 299.9 to 300.1 K (optical microscope) observed on heating, two solid-solid phase transitions (288.4 and 284.5 K) were found for all samples freshly crystallized from the melt. These solid-solid phase transitions were found to be reversible and occurred without much supercooling. If the samples were allowed to stand at 293 K for one month or longer, a phase transformation occurred so that the heat capacity versus temperature curve was as shown in figure 5b. It can be seen that a new solid-solid phase transition occurred (294 K) and the two transitions (at 288.4 and 284.5 K) were no longer present. The transition at 294 K was found to be irreversible, i.e., if the sample were heated through this transition (without melting the sample) and then cooled, only the transitions at 288.4 and 284.5 K again occurred. If the sample were subsequently reheated, the transition at 294 K was no longer found (i.e., unless the sample was again annealed for one month at 293 K). The rate of the transformation (fig. 5a → fig. 5b) was found to be dependent on temperature. At 293 K, 30 days was required; at 289 K, 15 days; at 284 K, 7 days; at 277 K, 2 days; and at 272 K, 2 days.
Figure 5.
(a) DSC trace of unannealed n-butyl stearate; and (b) DSC trace of annealed n-butyl stearate.
b. X-Ray Scattering
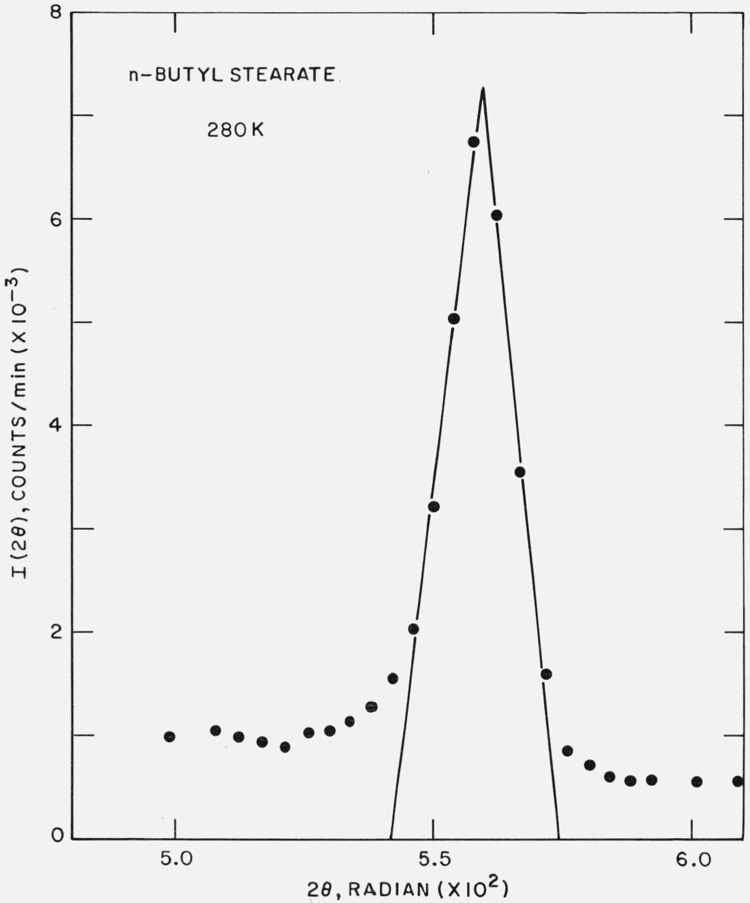
Strips of the filter cake from an acetone recrystallization (sample dried under vacuum one hour, using a liquid nitrogen trap) were placed in the (previously cooled) sample holder and the small-angle scattering examined. The first order diffraction maximum is shown in figure 6 and corresponds to a Bragg spacing of 27.6 Å. Malkin [19] has reported a value of 27.2 Å for the β form of n-butyl stearate.
Figure 6.
X-ray diffraction from n-butyl stearate at 280 K.
A solid-solid phase transition involving a change in the long-spacing was observed at 296.6 K for the solution recrystallized sample. Below 296 K, the stable phase corresponded to l = 27.6 Å; above 296.6 K, the observed spacing was 31.0 Å. It was found that while the process l(27.6 Å) → l(31.0 Å) at 296.6 K was rapid (and complete), the reverse process l(31.0 Å) → l(27.6 Å) at 296 K was slow (and incomplete). Thus, after five days at 296 K, only about ½ the sample was in the 27.6 Å form. The spacing of 31.0 Å is consistent with the chains in a vertical form, as reported by Malkin [19]. Dryden [20] has reported a value of 31.7 Å.
In order to determine if the DSC transition at 294 K and the transition l(27.6 Å) → l(31.0 Å) at 296.6 K were identical, several samples were prepared with the 31.0 Å spacing. These samples were maintained at 274 K for three days in the x-ray sample holder; the spacing remained constant at 31.0 Å, indicating that the rate of the transformation l(31.0 Å) → l(27.6 Å) may be slow at this temperature or that impurities may be affecting the transition. However, all samples so annealed exhibited the DSC trace of figure 5b, so that the transition at 294 K does not appear to be the tilt transition.
c. Dielectric Loss
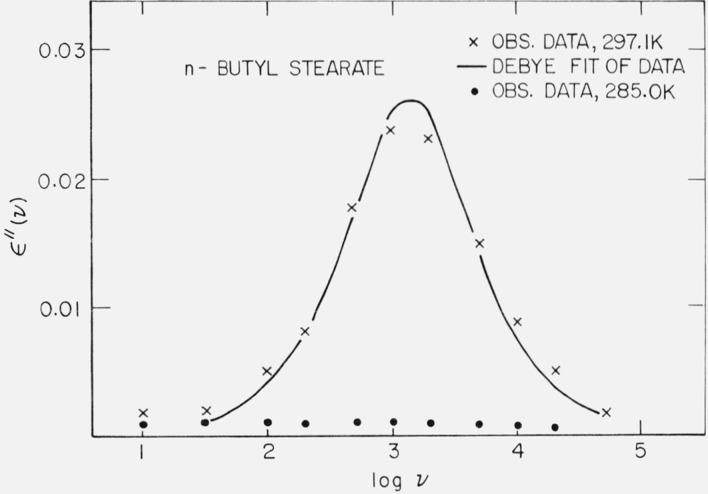
The sample was ground to a powder and pressed into a disc of 2.54 cm diameter and 0.2 cm thickness. The sample was kept at 277 K for approximately 4 months, so that its DSC corresponded to figure 5b. The sample was placed in the previously cooled cell (273 K) and the system kept under a positive nitrogen pressure. The dielectric loss was examined below (285.0 K) and above (297.1 K) the solid-solid phase transition in figure 5b, and the data is shown in figure 7. It can be seen that below the phase transition temperature there is no loss peak and ϵ″(ν) < 0.0035 over the frequency range covered. However, above the phase transition temperature a loss peak occurs. Little change in the loss peak was observed over a period of 30 days at 297 K. The sample was again cooled to 273 K and kept at this temperature for 4 days, so that its DSC curve corresponded to figure 5b. The loss was again examined at 285 K and ϵ″(ν) < 0.0027 over the frequency range covered.
Figure 7.
Dielectric loss for n-butyl stearate.
obs. data at 285.0 K.,
X obs. data at 297.1 K,
—— Debye fit of data at 297.1 K
d. Discussion
As with methyl and ethyl stearates, n-butyl stearate also undergoes slow solid-solid phase transformations. The reversible phase transitions at 288.4 and 284.5 K occur at the temperatures where Dryden [20] has found discontinuities in the frequency of maximum dielectric absorption versus 1/T plots. In agreement with the observation of Dryden [20], the long-spacing corresponding to figure 5a is 31.0 Å over the temperature range 280 to 299.9 K. Thus, the reversible phase transitions appear to involve a change in the lateral packing of the molecules.
The choice of n-butyl stearate for the dielectric loss experiment was prompted by the DSC studies. While annealed samples of methyl and ethyl stearate showed no solid-solid phase transitions on the DSC, the annealed samples of n-butyl stearate always exhibited the transition below the mp (fig. 5b). For this reason the sample could be prepared in the form of a disk suitable for the dielectric cell, then annealed for a long period of time (several months) and its loss examined. Then the sample could be heated through its solid-solid phase transition, while in the dielectric cell. Under these conditions, there is no change in the concentration of chemical impurities in the sample and any loss associated with the volume defects introduced by the solid-solid phase transition might be observed. As it turned out, the system kept at a temperature above the phase transition temperature of figure 5b does show a loss peak, which does not change with time. It appears then that the loss peak is not caused by the volume defects introduced by the phase transitions. It is also possible that the mobility of the impurities is greater in the high temperature phase.3
3.4. 2-Nonadecanone
a. DSC Studies
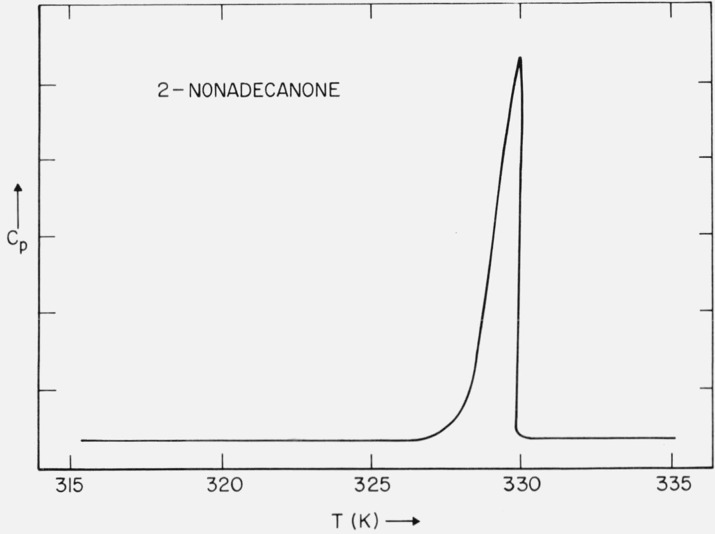
The original sample was found to have a rather broad melting curve. A typical DSC run on the purified sample is shown in figure 8. No solid-solid phase transitions were found in either the solution or melt recrystal-lized samples. The melting range was found to be 328.3 to 328.5 K, as determined on the optical microscope. Saville and Shearer [21] have reported a mp of 328.7 to 329.4 K.
Figure 8.
DSC trace of 2-nonadecanone.
b. X-Ray Scattering
The observed (002) diffraction maximum for the purified 2-nonadecanone corresponds to a value of 51.8 Å. Saville and Shearer [21] reported a value of 52.9 Å. As can be seen in table 3, the long-spacing was constant within 0.1 Å over the temperature range 236 K ⩽ T ⩽ 325 K. The relative integrated intensity of the (002) maximum (normalized to the value of 236 K) was observed to decrease slightly over this temperature range.
Table 3.
X-ray diffraction intensities and long-spacings as a function of temperature for 2-nonadecanone and n-eicosane
| 2-nonadecanone | n-C20H42 | ||||
|---|---|---|---|---|---|
| T(K) | A(T)/A(236K) | l(Å) | T(K) | A(T)/A(233K) | l(Å) |
| 325 | 0.97 | 51.8 | 308 | 1.1 | 25.4 |
| 297 | 25.4 | ||||
| 1.05 | |||||
| 296 | 0.96 | 51.8 | 275 | 1.0 | 25.4 |
| 236 | 1.0 | 51.8 | 233 | 1.0 | 25.4 |
c. Discussion
The observed long-spacing of 51.8 Å corresponds to the length of two molecules. As with methyl stearate, it appears likely that the ketone groups in adjacent lamellae are nearest each other in 2-nonadecanone, giving rise to the 51.8 Å repeat distance.
3.5. Eicosane
a. DSC Studies
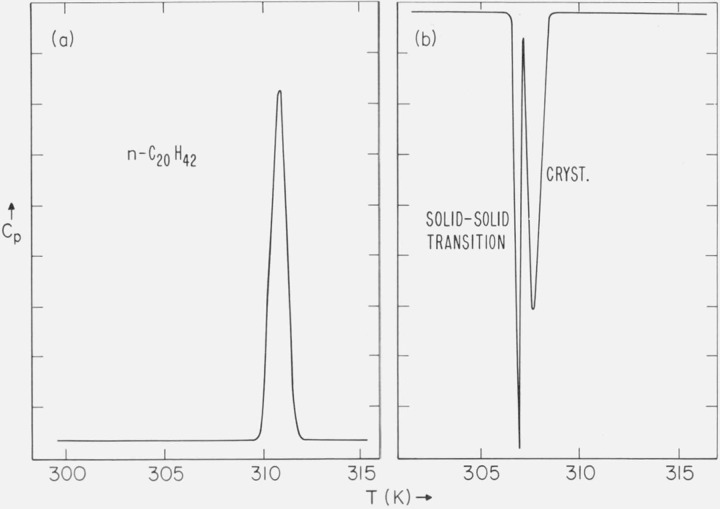
A typical DSC trace of the purified n-C20H42 is shown in figure 9a. No solid-solid phase transitions were found when either solution-crystallized or melt-crystallized samples were heated. However, when the melt was cooled, in addition to the liquid-solid transition, a solid-solid phase transition was always observed within 3 K of the crystallization temperature. This is shown in the DSC trace of figure 9b. The solid-solid transition was also observed as an abrupt transition on the optical microscope. This transition as observed on the microscope occurred 5 to 6 K below the crystallization temperature (309.2 K). The melting point of the form which had not been cooled sufficiently to experience the solid-solid transition was 309.3 to 309.5 K. The melting point of the form which had been cooled through the transition was 309.7 to 309.9 K (both observed on the optical microscope). A solid-solid phase transition has been reported by Seyer et al. [22] and by Schaerer et al. [16, 23]. The melting points of the two forms are in agreement with those reported by Schaerer [23]. Based on the areas under the DSC curves for the solid-solid and crystallization transitions, and on the literature value [16] for the heat of fusion of the higher melting form of n-C20H42, the heat of the solid-solid transition is approximately 7 kcal/mole.
Figure 9.
(a) DSC trace of n-C20H42 (heating); and (b) DSC trace of n-C20H42 (cooling).
b. X-ray Scattering
A portion of the recrystallized sample of n-C20H42 was examined in the x-ray camera. The first order diffraction maximum at 297 K corresponds to a spacing of 25.4 Å. This is in agreement with the value reported by Crissman et al. [24] for the triclinic form. As can be seen in table 3, the long-spacing of 25.4 Å was constant within 0.1 Å over the temperature range 233 ⩽ T ⩽ 308 K. The integrated intensity of the first order low-angle maximum (normalized to the value of 233 K) increased slightly (about 10%) over this same temperature range.
c. Discussion
For the n-paraffins with an even number of carbon atoms from n-C22H46 to n-C42H86, a reversible phase transition [2] occurs below the mp. The transition is reversible in the sense that it occurs on both heating and cooling the sample. n-C20H42 appears to be a borderline case. When the sample is crystallized from the melt, it apparently can crystallize into the rotator state and subsequently into the stable form, as evidenced by the DSC transition shown in figure 9b. However, the transition does not again occur when the sample is heated (fig. 9a).
3.6. n-Hexatriacontane
a. DSC Studies
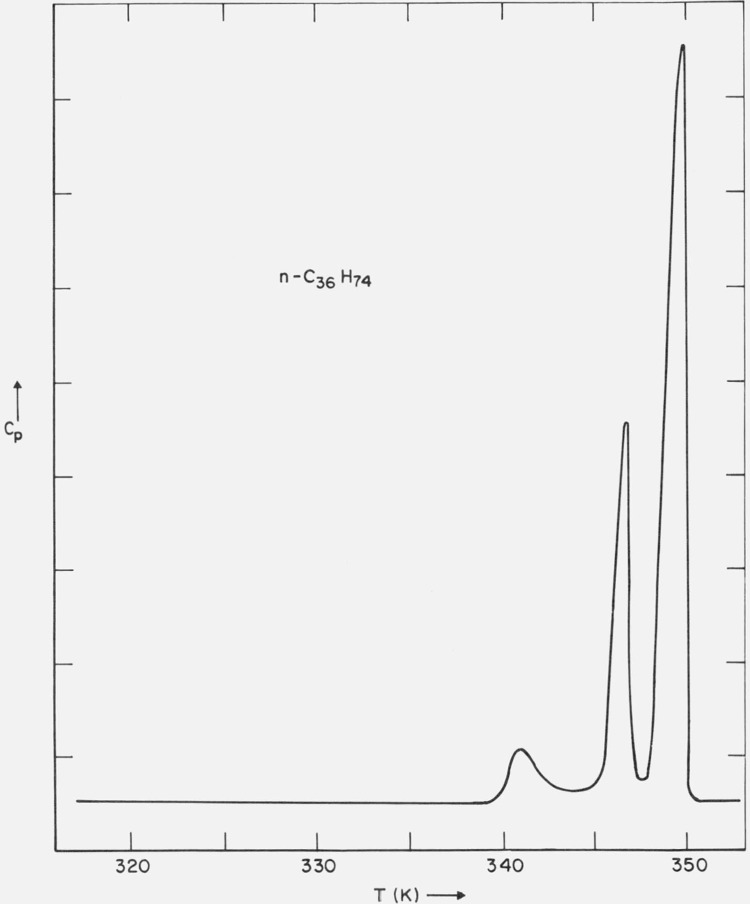
A typical DSC scan of the purified sample is shown in figure 10. In addition to the solid-liquid transition at 348.9 K (determined on the optical microscope), two solid-solid phase transitions were observed, one at 347.0 K (optical microscope and DSC) and the other at 340.7 K (DSC). The lower temperature solid-solid transition (340.7 K) was found to be irreversible, i.e., it did not occur on a subsequent heating scan on a sample crystallized from the melt. The higher temperature solid-solid transition (347.0 K) was found to be reversible. Schaerer [16] et al. report a mp of 349.1 K.
Figure 10.
DSC trace of n-C36H74.
b. X-Ray Scattering
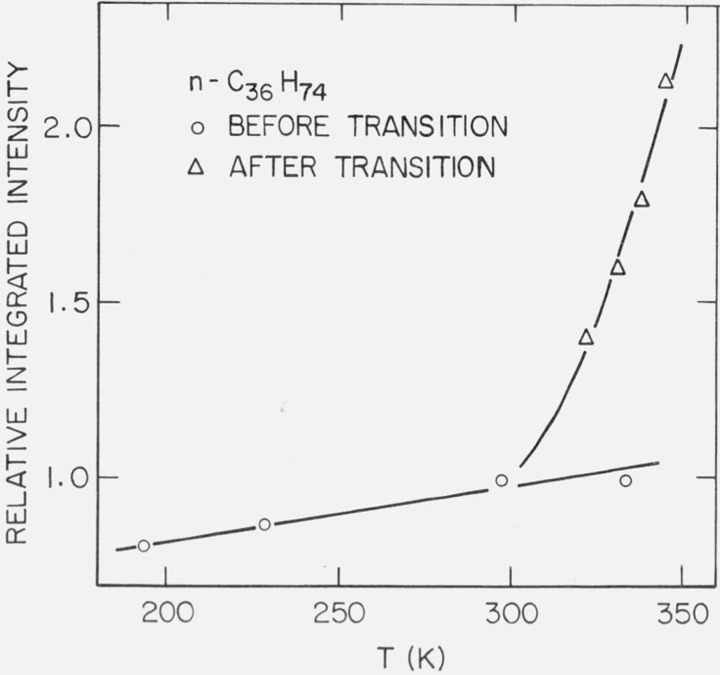
A portion of the benzene recrystallized sample was examined in the x-ray camera. The first order diffraction maximum corresponds to a spacing of 42.4 Å, which is consistent with the monoclinic form reported by Shearer and Vand [25]. It can be seen in table 4 that the spacing of 42.4 Å was observed over the temperature range 192.6 ⩽ T ⩽ 333.6 K. The heating path over this range was in this order: 297, 333.6, 297, 229.5, 297, 192.6, and 297 K. The integrated intensities at 297 K were reproducible within ± 5 percent.
Table 4.
X-ray diffraction intensities and long-spacings as a function of temperature for n-hexatriacontane and n-tetratetracontane
| n-C36H74 | |||||
|---|---|---|---|---|---|
| Before transition | After transition | ||||
| T(K) | A(T)/A(297K) | l(Å) | T(K) | A(T)IA(297K) | l(Å) |
| 333.6 | 1.00 | 42.4 | 344.0 | 2.13 | 46.2 |
| 297 | 1.00 | 42.4 | 337.9 | 1.80 | 46.8 |
| 229.5 | 0.87 | 42.4 | 330.7 | 1.61 | 46.7 |
| 192.6 | 0.81 | 42.4 | 324.6 | 1.41 | 47.1 |
| 319.0 | 1.41 | 46.8 | |||
| 297 | 1.00 | 47.3 | |||
When the sample was heated above 340.7 K, the 42.4 Å spacing was no longer observed. The spacing increased approximately 4 Å, as can be seen in table 4. Furthermore, the long-spacing did not return to the 42.4 Å value when the sample was cooled to room temperature. The heating path for the sample after the solid-solid phase transition was (in order): 344.0, 297, 324.6, 337.9, 344.0, 330.7, 319.0, and 297 K. The integrated intensities at 297 K were reproducible within ±2 percent. The intensity data in table 4 have been normalized to 297 K, so that the values before and after the transition at 297 K are adjusted to be equal. However, the observed values of the intensity before and after the long-spacing transition were approximately equal at room temperature.
From table 4 one can see that the relative intensity change over 192.6 ⩽ T ⩽ 333.6 K, i.e., over a 141 K temperature range, is 19 percent (before the long-spacing transition). However, over the temperature range 297 ⩽ T ⩽ 344.0 K, i.e., over a 47 K temperature range, the relative intensity change is more than 100 percent (after the long-spacing transition). This is shown in figure 11, in which the relative integrated intensity is plotted as a function of temperature.
Figure 11.
Relative integrated intensity of (002) diffraction maximum of n-C36H74.
0 before phase transition
Δ after phase transition
c. Discussion
The phase transition at 347.0 K is apparently the rotator type transition [2] and involves a change in the lateral packing of the molecules. The phase transition at 340.7 K is a tilt transition (with little change in the lateral packing of the molecules). In a previous article [3] it was found that crystallization from toluene by quenching the sample in a dry-ice acetone bath led to the orthorhombic phase, with a long-spacing of 47.7 Å (at 297 K). When this orthorhombic form was heated to 345 K, the long-spacing decreased to 45.7 Å. Also, when the monoclinic form was heated to 344 K, the long-spacing increased to 46.2 Å (table IV). It appears that these systems are both approaching a phase with long-spacing around 46 Å above 341 K.
3.7. n-Tetratetracontane a. DSC Studies
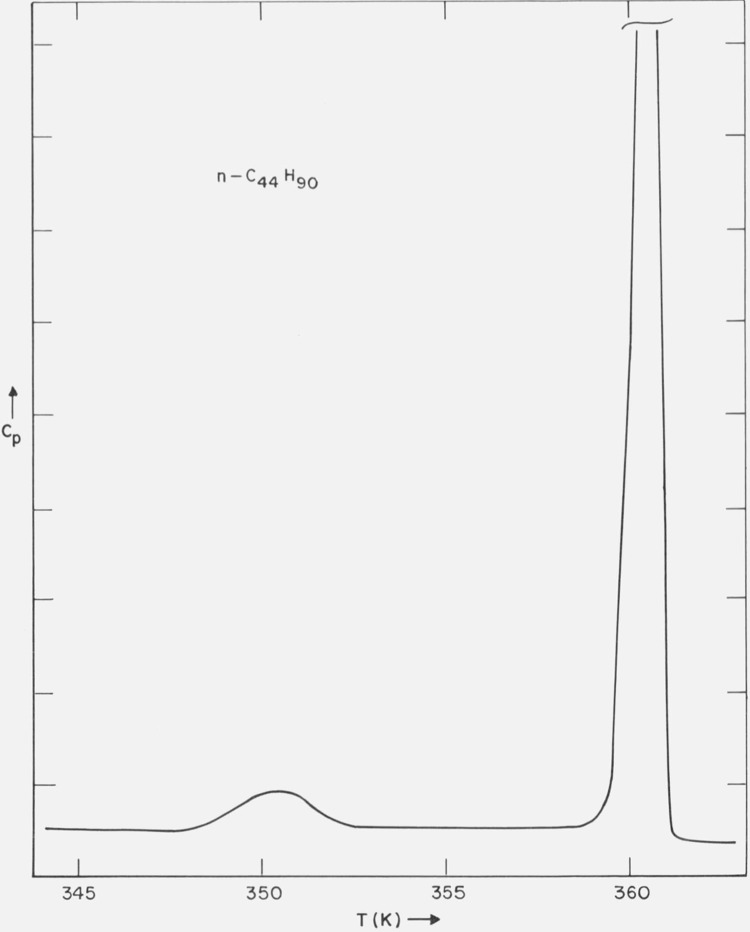
A typical DSC scan of the solution recrystallized n-C44H90 sample is shown in figure 12. In addition to the solid-liquid transition, 359.3 to 359.5 K (optical microscope), a solid-solid transition was observed at 348.2 K (DSC). This solid-solid transition was found to be irreversible, i.e., it did not occur on a cooling curve, nor reoccur on the subsequent heating curve.
Figure 12.
DSC trace of n-C44H90.
b. X-Ray Scattering
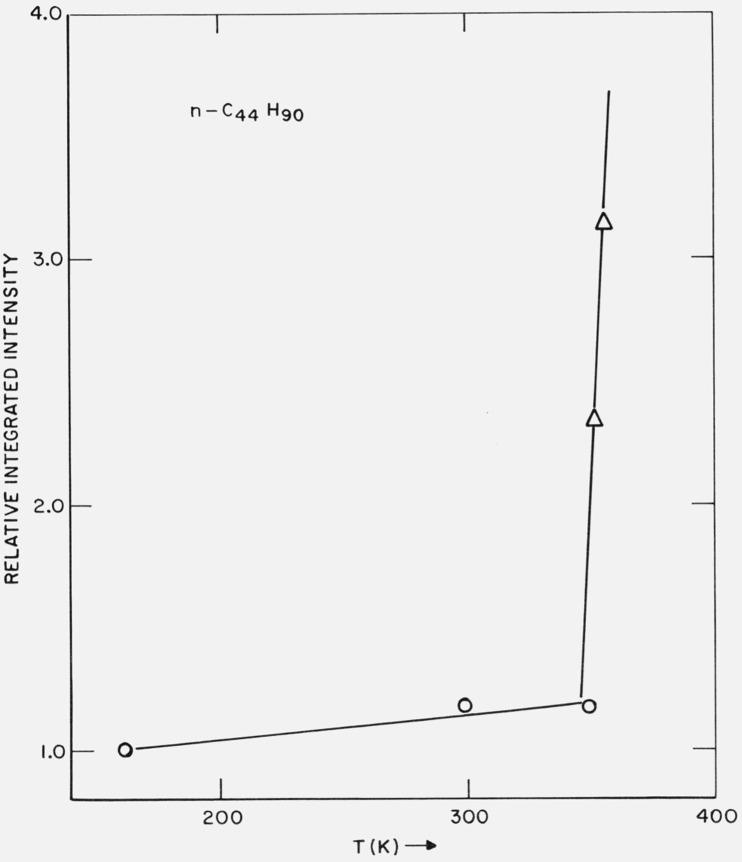
A portion of the benzene recrystallized sample was examined in the x-ray camera. The first order diffraction maximum at 297 K was observed to be 51.2 Å. In table 4 are shown the long-spacing, as well as the relative integrated intensity of the first-order diffraction maximum (normalized to the value at 161.7 K) over the temperature range 161.7 ⩽ T ⩽ 354.9 K. The relative integrated intensities as a function of temperature are shown in figure 13. It can be seen that the relative intensity of the maximum changed continuously over the temperature range 161.7 ⩽ T ⩽ 347.2 K, but above the temperature of the solid-solid transition (348.2 K), the relative intensity increased sharply.
Figure 13.
Relative integrated intensity of (002) diffraction maximum of n-C44H90 as a function of temperature.
0 before phase transition
Δ after phase transition
c. Discussion
n-C44H90, like n-C20H44, shows no phase transition to the rotator state when the sample is heated. However, n-C44H90 also did not exhibit this transition as the sample was cooled from the melt. The observed long-spacing of 51.2 Å is consistent with a monoclinic form, based [2] on a long-spacing of 57.9 Å for the orthorhombic form. The DSC transition at 348.2 K is a tilt transition, with the long-spacing increasing almost 3 Å.
4. General Discussion
From the above observations, it can be seen that except for 2-nonadecanone, all samples underwent solid-solid phase transitions. Furthermore, in some cases the rates of such transitions can be quite slow. Thus, one must be careful about the thermal history and purity of paraffin systems in order to insure the achievement of a stable form. With respect to crystal spacings and dielectric loss, some discussion is given below for systems in a stable form, and the effect of the phase transitions.
4.1. X-Ray Scattering
All samples in the x-ray sample holder were examined with respect to the height of the sample above the x-ray beam, i.e., in the plane normal to the propagation direction of the primary beam. This allows a determination of the uniformity of the scattering with respect to the height of the sample, which can change as the sample temperature changes. Care was taken to insure the same portion of the sample was examined as the temperature was changed.
a. n-Paraffins
For a given crystalline phase, the temperature dependence of the intensity of a diffraction maximum is determined by the temperature dependence of the scattering factor F(T):
| (1) |
If the scattering units in the system undergo small oscillations, then the Debye-Waller factor can be separated out of F(T). However, at the low angles of scattering of interest in this article, the effect of this factor is small. For n-paraffins, the remaining temperature dependence of F(T) can be related [3] to the interlamellar distance. At temperatures T1 and T2, one has:
| (2) |
where A(T) is the temperature dependent interlamellar distance. Processes that lead to an increase in A(T), i.e., an increase (with increasing temperature) in the concentration of voids on the surfaces of the lamellae, should lead to an increase in the integrated intensity of the maximum relative to some lower temperature.
In the case of n-C20H42 over the temperature range 233 K ⩽ T ⩽ 308 K (table 3), the long-spacing is constant at 25.4 Å and the relative change in the integrated intensity of the first-order diffraction maximum is 10 percent. For n-C36H74 over the temperature range 192.6 ⩽ T ⩽ 333.6 K, the relative change in the integrated intensity is 19 percent, with the long-spacing constant at 42.4 Å. And for n-C44H90 over 161.7 ⩽ T ⩽ 347.2 K, the intensity change is 16 percent and the long-spacing changed slightly.
It appears that for the n-paraffins, when the long-spacing is very nearly constant, the change in the relative integrated intensity of the first order (00l) maximum is 10 to 20 percent (in the temperature range considered). However, after the system has experienced a solid-solid phase transition, the temperature coefficient of the relative integrated intensity appears to increase substantially. This is shown for n-C36H74 in figure 11. In this case the solid-solid phase transition occurred at 340.7 K, such that the long-spacing increased approximately 4 Å (table 4). The situation is similar for n-C44H90, as is shown in figure 13. The transition occurred at 348.2 K and the long-spacing increased approximately 2.5 Å. The data appears to be consistent with the view that the solid-solid phase transitions – which involve a volume change – are one mechanism to generate substantial amounts of vacancies on the surfaces of the lamellae.
b. Long-Chain Esters and the Ketone
From table 1, one notes that for methyl stearate, there is no observable change in the relative integrated intensity of the (002) diffraction maximum over the temperature range 235 K ⩽ T ⩽ 307 K. The long-spacing was constant within 0.1 Å. Similarly, for solution recrystallized ethyl stearate, there is no change in the relative intensity of the first order maximum over 235 K ⩽ T ⩽ 297 K. Also, the long-spacing was constant within 0.1 Å. And for 2-nonadecanone, the relative intensity change over 236 K ⩽ T ⩽ 325 K was 4 percent and the long-spacing constant at 51.8 Å. It appears that without the vacancy producing mechanism of a tilt transition, the esters and the ketone have a small temperature coefficient for the relative intensity change with temperature of the (00l) maxima.
We note that a tilt transition has been observed for ethyl stearate crystallized from the melt. However, since the sample was crystallized in the x-ray sample holder, only a small drop of liquid was involved. It was then difficult to determine the uniformity of the intensity of scattering from the crystalline sample as the height was changed, even though the location of the maxima could easily be determined. Thus we cannot say from the data if the intensity of the long-spacing maximum for this sample increased due to the tilt transition.
The intensity of the 25.4 Å spacing of the quenched sample of ethyl stearate (sec. 3.2b) was observed to be constant over a period of 26 days at room temperature. However, the sample has undergone solid-solid phase transitions as evidenced by the initial and final DSC scans. It appears that these phase transitions have no measurable effect on the intensity of the low-angle maxima.
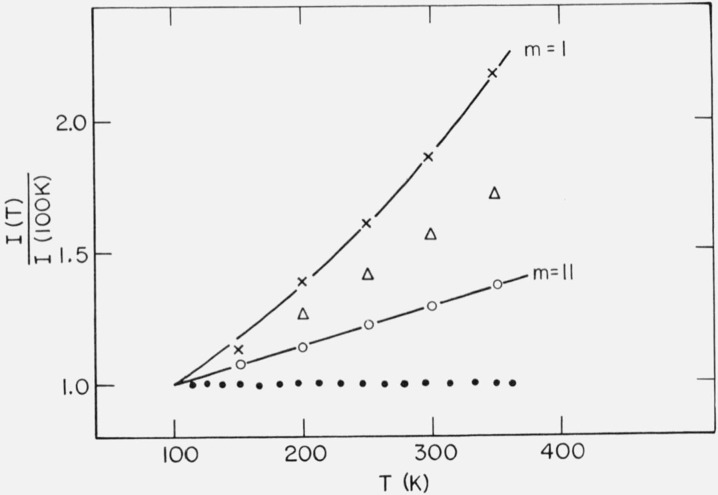
However, it is also possible that the (00l) diffraction intensities for these compounds are not as sensitive to surface voids, as is the case for the n-paraffins. One possible reason for this could be that the mechanisms of the phase transitions are different from those of the n-paraffins. In order to compare the relative intensity change with temperature of the n-paraffins, esters and the ketone, an estimate was made of the (002) diffraction intensity as a function of temperature for n-paraffins and branched paraffins, all of the same total number of carbon atoms. The results are shown in figure 14 and the calculation follows.
Figure 14.
Estimate of the relative integrated intensity as a function of temperature for the (002) diffraction maximum.
⋅, 0. X branched paraffins (see text)
Δ linear paraffin
We consider as the scattering unit two lamellae of each system. For the n-paraffin this unit is indicated in figure 15a. In the usual notation [26], the scattering factor for the n-paraffin is:
| (3) |
where there are n′ + 1 scatterers (i.e., CH2 groups) in the two lamellae and each −CH2− group has a scattering factor f(θ). For the (00l) maxima discussed in this article, one can write eq (3) as:
| (4) |
where there are N molecules in a lamella and each molecule has n + 1 units.
Figure 15.

Repeat unit for (a) linear paraffin and (b), (c) branched paraffins, with different arrangement of side group.
Summing over the scattering for one molecule and assuming , one has for the n-paraffin:
| (5) |
where nx is the projection of rn onto s.
For the branched paraffin, with one −CH3 group in the mth position along the chain, there are two possibilities with respect to how the molecules are arranged in the crystal, indicated in figures 15b and 15c. Ethyl stearate and n-butyl stearate are essentially examples of case (b), while methyl stearate and 2-nonadecanone are examples of case (c) (the scattering factor of oxygen at these low-angles is considered approximately that of a −CH2− group).
For case (b), eq (3) becomes:
| (6) |
And finally, for case (c), eq (3) becomes:
| (7) |
One can write the temperature dependent scattering factor F(θ, T) in terms of the temperature dependent molecular length l(T) and interlamellar distance A(T), where l(T) = (n +1)x + A(T). Suppose that the change with temperature of A(T) is the same for the linear paraffin and both cases of the branched paraffin. Assume this change is which is about the change in the a axis observed by Cole and Holmes [27] for n-C36H74.
Recalling that I(θ, T) is proportional to ∣F(θ, T∣2, then from eqs (5), (6), and (7) one can estimate the change with temperature of the relative intensities of the low-angle maxima for the various cases of the linear and branched paraffins, all with the same total number of carbon atoms.
The results of these calculations are shown in figure 14. Case (c), the dotted line in figure 14, is found to be practically temperature independent (1% decrease) over the range of the calculation. The observed data for methyl stearate and 2-nonadecanone (tables 1 and 3), which approximate case (c), are consistent with the calculation. For case (c), there is a negligible temperature effect (for the intensity of the (002) maximum) of the location of the side group on the chain.
For the calculation with the branched paraffin of case (b), the location of the side group on the chain does affect the temperature dependence of the intensity of the (002) maximum. When the side group is near the center of the chain (m = 11), the intensity increase over the 250 K temperature range is about 37 percent. When the side group is near the end of the chain (m = l), the intensity increase is estimated to be 120 percent. All cases with 1 ⩽ m ⩽ 11 fall between the two solid lines of figure 14. The n-paraffin case (Δ in fig. 14) falls between m = 1 and m = 11. For ethyl stearate (m = 3), the estimated increase in intensity is 22 percent over 200 ⩽ T ⩽ 300 K. There is no observed intensity change (c.f. tab. 1) over this temperature range. In fact, the long-spacings for methyl stearate, ethyl stearate, 2-nonadecanone and n-C20H42 are practically constant over the temperature ranges of observation, so that the assumed interlamellar expansion of is probably too large. Thus the estimates shown in figure 14 should only be considered as an upper bound.
4.2. Dielectric Relaxation
It appears that the loss peak at 297.1 K for n-butyl stearate is an equilibrium property of the material, since little change in the peak was observed over a period of 30 days. The solid line in figure 7 is a fit of the data to a Debye curve, using the observed values of ϵ′ (0) − ϵ′ (∞) = 0.053 and a relaxation time of τ = 1.1 × 10⁻⁴ s. The loss was calculated [28] from the equation:
| (8) |
It can be seen that the Debye curve is a reasonable approximation to the observed data.
For the sample of n-butyl stearate stored at 273 K for 4 days (which is sufficient time for the solid-solid phase transition to complete itself), the loss is quite small at 285 K. Furthermore, a long annealing time, e.g., 4 months at 277 K, does not appreciably change the loss, so that below the solid-solid phase transition shown in figure 5b, the equilibrium value of the loss (over the frequency range 10 Hz to 2 × 10⁴ Hz) is quite small. While the long annealing time should allow the healing out of volume defects, once the phase transition has completed itself, further annealing does not appear to reduce the loss measurably.
Dryden [20] has similarly observed a loss peak in n-butyl stearate at 293 K, with τ approximately 1.5 × 10⁻⁴ s. Also, Dryden found from a plot of log ωmax. versus 1/T that two discontinuities occurred, one at approximately 287 K, the other at 284 K. These temperatures correspond to the phase transition temperatures observed with the DSC in this article, viz; 288.4 and 284.5 K. However, it should be pointed out that the loss peaks Dryden has observed at 293 K and lower are probably not equilibrium properties, since as discussed in section 3.3(a), the system is slowly undergoing a phase transition to a more stable form.
Dryden and Welsh [29] have also shown that ϵ′ (0) − ϵ′ (∞), for similar long-chain esters, increases with increasing amounts of added impurity. However, the data shown in figure 7 at 285.0 K and 297.1 K is for the same sample, so that the impurity level is constant. Thus, in addition to chemical impurities as a cause of dielectric loss, the crystalline phase of the substance is also an important factor.
5. Conclusions
For a series of long chain n-paraffins, long chain esters and a long chain ketone, the intensity change of the long-spacing (determined by x-ray scattering) was no more than 10 to 20 percent over a temperature range of 100 K, when no tilt transition occurred. However the temperature coefficient of the intensity of the long-spacing was found to increase substantially for n-paraffins when a tilt transition occurred. The dielectric loss in an annealed sample of n-butyl stearate was found to be quite small. However at 297.1 K, a distinct loss peak was observed, which did not change with time. Both reversible solid-solid phase transitions (n-C36H74, n-butyl stearate) and irreversible transitions (ethyl stearate, n-butyl stearate, n-C20H42) were observed with these systems. The rate of the irreversible phase transitions (n-butyl stearate and ethyl stearate) were found to be strongly temperature dependent.
| n-C44H90 | ||
|---|---|---|
| T(K) | A (T)/ A (161.7K) | l(Å) |
| 354.9 | 3.15 | 53.3 |
| 350.8 | 2.35 | 53.9 |
| 347.2 | 1.16 | 51.1 |
| 297 | 1.17 | 51.2 |
| 161.7 | 1.00 | 51.5 |
Acknowledgments
The author is pleased to acknowledge the assistance and numerous helpful discussions of Anthony J. Bur and James J. Weeks.
Footnotes
Figures in brackets indicate the literature references at the end of this paper.
Certain commercial materials and equipment are identified in this paper in order to specify adequately the experimental procedure. In no case does such identification imply recommendation or endorsement by the National Bureau of Standards, nor does it imply that the material or equipment is necessarily the best availaale for the purpose.
This suggestion was made by Prof. E. R. Fitzgerald (Johns Hopkins Univ.).
6. References
- [1].Markley K. S., Fatty Acids, (Interscience, 1947). [Google Scholar]
- [2].Broadhurst M. G., J. Res. Nat. Bur. Stand. (U.S.), 66A (Phys. and Chem.) No. 2, 241–249 (May–June 1962). [Google Scholar]
- [3].Sullivan P. K. and Weeks J. J., J. Res. Nat. Bur. Stand. (U.S.), 74A (Phys. and Chem.), No. 2, 203–214 (Mar.–Apr. 1970). [DOI] [PMC free article] [PubMed] [Google Scholar]
- [4].Fischer E. W., Pure J. and Applied Chem. 26, 385 (1971). [Google Scholar]
- [5].Heitz W., Wirth T., Peters R., Strobl G., and Fischer E. W., Die Makromolekulare Chemie 162, 63 (1972). [Google Scholar]
- [6].Scheiber D. J., J. Res. Nat. Bur. Stand. (U.S.), 65C (Eng. and Instr.), 23 (1961). [Google Scholar]
- [7].Brown J. B., Am J.. Oil Chem. Soc. 32, 646 (1955). [Google Scholar]
- [8].Sedgwick R. S., Hoerr C. W., and Harwood H. J., J. Org. Chem. 17, 327, (1952). [Google Scholar]
- [9].Clark S. G., Thesis M. S., The Penn State Univ., 1956 [Google Scholar]
- [10].Aleby S., and von Sydow E., Acta Cryst. 13, 487 (1960). [Google Scholar]
- [11].Simonelli A. P., Ph. D. Thesis, Univ. Wisc., 1960. [Google Scholar]
- [12].Guy J. B., and Smith J. C., J. Chem. Soc. 615 (1939). [Google Scholar]
- [13].Smit W M., Anal. Chim. Acta, 17, 27, (1957). [Google Scholar]
- [14].Craig B. M., Am J.. Oil Chemists Soc. 34, 30, (1957). [Google Scholar]
- [15].Francis F. and Piper S. H., J. Am. Chem. Soc., 61, 577, (1939). [Google Scholar]
- [16].Schaerer A. A., Busso C. J., Smith A. E. and Skinner L. B., J. Am. Chem. Soc. 77, 2017 (1955). [Google Scholar]
- [17].Aleby S., Acta Cryst. 15, 1248 (1962). [Google Scholar]
- [18].Malkin T., J. Chem. Soc. 2796 (1931). [Google Scholar]
- [19].Malkin T., Trans. Faraday Soc. 29, 977 (1933). [Google Scholar]
- [20].Dryden J. S., J. Chem. Phys. 26, 604 (1957). [Google Scholar]
- [21].Saville W. B. and Shearer G., J. Chem. Soc. 591 (1925). [Google Scholar]
- [22].Seyer W. F., Patterson R. F. and Keays J. L., J. Am. Chem. Soc. 66, 179 (1944). [Google Scholar]
- [23].Schaerer A. A., Boyle G. G., and Mazee W. M., Rec. Trav. Chim. 75, 513 (1956). [Google Scholar]
- [24].Crissman J. M., Passaglia E., Eby R. K., and Colson J. P., J.Appl. Cryst. 3, 194, (1970). [Google Scholar]
- [25].Shearer H. M. M., and Vand V., Acta Cryst. 9, 379 (1956). [Google Scholar]
- [26].James R. W., Optical Principles of the Diffraction of X-Rays (Cornell Univ. Press, Ithaca, N.Y., 1965). [Google Scholar]
- [27].Cole E. A., and Holmes D. R., J. Polymer Sci. 46, 245 (1960). [Google Scholar]
- [28].Debye P., Polar Molecules (Dover Pub. Inc., N.Y., 1929). [Google Scholar]
- [29].Dryden J. S., and Welsh H. K., Disc. Faraday Soc. 48, 211 (1969). [Google Scholar]


