Abstract
Recent technology has made it possible to measure DNA methylation profiles in a cost-effective and comprehensive genome-wide manner using array-based technology for epigenome-wide association studies. However, identifying differentially methylated regions (DMRs) remains a challenging task because of the complexities in DNA methylation data. Supervised methods typically focus on the regions that contain consecutive highly significantly differentially methylated CpGs in the genome, but may lack power for detecting small but consistent changes when few CpGs pass stringent significance threshold after multiple comparison. Unsupervised methods group CpGs based on genomic annotations first and then test them against phenotype, but may lack specificity because the regional boundaries of methylation are often not well defined. We present coMethDMR, a flexible, powerful, and accurate tool for identifying DMRs. Instead of testing all CpGs within a genomic region, coMethDMR carries out an additional step that selects co-methylated sub-regions first. Next, coMethDMR tests association between methylation levels within the sub-region and phenotype via a random coefficient mixed effects model that models both variations between CpG sites within the region and differential methylation simultaneously. coMethDMR offers well-controlled Type I error rate, improved specificity, focused testing of targeted genomic regions, and is available as an open-source R package.
INTRODUCTION
Many diseases are caused by a complex interplay of genes and environmental factors, such as smoking, poor diet and lack of exercise. Epigenetic studies investigate the mechanisms that modify the expression levels of selected genes without changes to the underlying DNA sequence. The study of these epigenetic patterns hold excellent promise for detecting new regulatory mechanisms that may be susceptible to modification by environmental factors, which in turn increase the risk of disease. Among epigenetic modifications, DNA methylation is the most widely studied. The addition or removal of a methyl group at the fifth position of a cytosine is the key feature of DNA methylation. Alterations of DNA methylation levels have been shown to be involved in many diseases (1), such as cancers (2–4) and neurodegenerative diseases (5–9).
While whole-genome bisulfite sequencing is still too costly for large epidemiologic studies, recent technology has made it possible to measure DNA methylation profiles in a cost-effective and comprehensive genome-wide manner using array-based technology such as the Infinium MethylationEPIC BeadChip Kit, which allows researchers to interrogate more than 850 000 methylation sites per sample at single-nucleotide resolution. The first wave of epigenome analysis tools have focused on comprehensive DNA methylation analysis of single base sites, that is, identifying differentially methylated CpG sites, while more recent effort have shifted to analyzing differentially methylated regions (DMRs) (10,11).
The shift to analysing DMRs is driven by both biological and statistical reasons. Biologically, it has been observed that methylation levels are strongly correlated across the genome, and methylation often occurs as a regional phenomenon (12). In the study of complex diseases, various studies have reported functionally-relevant genomic regions, such as CpG islands (13) or CpG island shores (14), are associated with diseases. While changes at single sites should not be overlooked, DMRs have increasingly been deemed the hallmarks of differential methylation, and replication of DMRs are often more successful compared with changes at single sites (15,16). Statistically, because of the large number of CpG sites interrogated by methylation arrays, testing regions (rather than individual CpGs) can help improve power by reducing the number of tests conducted. In addition, while effect size in a single CpG might be small and difficult to detect, by borrowing information from all the CpGs within a region, statistical test for regions can more effectively leverage information within the region to increase sensitivity and specificity.
A number of statistical methods for identifying DMRs have been proposed (10,11,17–20), reviewed (21,22) and compared (23–25). Methods for DMR identification can be classified into supervised and unsupervised methods. Supervised methods (e.g. bumphunter (17), DMRcate (18), and probeLasso (11)) typically start with computing P-values for differential methylation at individual CpG sites, and then scan the genome to identify regions with adjacent low P-values. The statistical significance of these regions is then computed by combining individual CpG P-values in the region using methods such as Stouffer's Z (10). However, a challenge with supervised methods is that they may lack power for detecting small but consistent changes when few CpGs pass stringent significance threshold after multiple comparison (25).
An alternative strategy is to use an unsupervised approach, which defines relevant regions across the genome first, independently of any phenotype information, and then tests methylation levels in these predefined regions against a phenotype (19,20,26). In this study, we propose a new unsupervised approach for testing differential methylation in regions against continuous phenotype such as age, tumor size or marker protein concentrations. Note that in the proposed mixed effects model (Supplementary Text, Section 1), the phenotype variable is included as an independent variable and the methylation values as the outcome variable. Therefore, no distributional assumptions (e.g. normal distribution) are made for the continuous phenotypes.
Table 1 lists several previously proposed unsupervised methods. A challenge with unsupervised approaches is their lack of specificity. Unlike gene expression data, the regional boundary of DNA methylation is often not well defined. Therefore, currently available approaches that summarize methylation levels in a region using mean or median methylation levels of the CpGs within the region may have results that vary depending on the boundaries of the region. In addition, when testing associations between phenotype and the summarized methylation levels in a genomic region, the spatial correlations between CpG sites within the region is ignored.
Table 1.
Summary of unsupervised methods
| Definition of Genomic Regions | Test Association Between Methylations in Genomic Regions vs. Continuous Phenotypea | Reference | |
|---|---|---|---|
| Previously proposed methods | |||
| IMA_mean (rforge.net/IMA/) | Illumnina annotation (e.g. CGI, TSS200) | linear model:  where where  is mean of methylation levels over all CpGs in the region, for sample is mean of methylation levels over all CpGs in the region, for sample 
|
(26) |
| IMA_median (rforge.net/IMA/) | Illumnina annotation (e.g. CGI, TSS200) | linear model:  where where  is median of methylation levels over all CpGs in the region, for sample is median of methylation levels over all CpGs in the region, for sample 
|
(26) |
| Aclust (github.com/tamartsi/Aclust/) | Adjacent Site Clustering (A-clustering) algorithm | Generalized Estimating Equation model:  , where , where  = methylation value for CpG = methylation value for CpG  in sample in sample  ; ;  for some mean-zero distribution F with covariance matrix for some mean-zero distribution F with covariance matrix  . . |
(20) |
| Seqlm (github.com/raivokolde/seqlm) | Minimum Description Length principle | simple linear mixed model:  , where , where  is the sample random effect is the sample random effect |
(19) |
| Proposed in this study | |||
| coMethDMR_simple (github.com/lissettegomez/coMethDMR) | CoMethAllRegions function | simple linear mixed model:  , where , where  is the sample random effect is the sample random effect |
|
| coMethDMR_randCoef (github.com/lissettegomez/coMethDMR) | CoMethAllRegions function | random coefficient mixed model:  where where  is the sample random effect; is the sample random effect;  are random coefficients for intercepts and slopes; are random coefficients for intercepts and slopes;  is an unstructured covariance matrix. is an unstructured covariance matrix. |
a
 continuous phenotype (e.g. disease stage) for sample
 ;
;
Here, we present coMethDMR, a new unsupervised approach that effectively leverages covariations among CpGs within genomic regions to identify genomic regions associated with continuous phenotypes. Instead of testing all CpGs within a genomic region, coMethDMR carries out an additional step that clusters co-methylated sub-regions without using any outcome information. Next, coMethDMR tests association between methylation within the sub-region and continuous phenotype using a random coefficient mixed effects model (27), which models both variations between CpG sites within the region and differential methylation simultaneously.
In the following sections, we provide methodological details of the coMethDMR analysis pipeline and compare this new method with several existing tools. The advantages of coMethDMR is demonstrated using both simulated and real methylation datasets. We show that the additional CpG selection step (subregion identification) improves power substantially while preserving Type I error rate. In addition, the new random coefficient model improves specificity and is robust against association signals from outlier CpGs when detecting changes in differential methylation in the regions.
MATERIALS AND METHODS
The coMethDMR analysis pipeline
Figure 1 shows the workflow of the coMethDMR analysis pipeline, which is implemented in the coMethDMR R package (https://github.com/lissettegomez/coMethDMR). There are two major steps in the coMethDMR pipeline: (i) within a genomic region, identify the sub-region with contiguous and co-methylated CpGs and (ii) test association of CpG methylation in the subregion with phenotype, while modelling for variabilities among the CpGs simultaneously.
Figure 1.
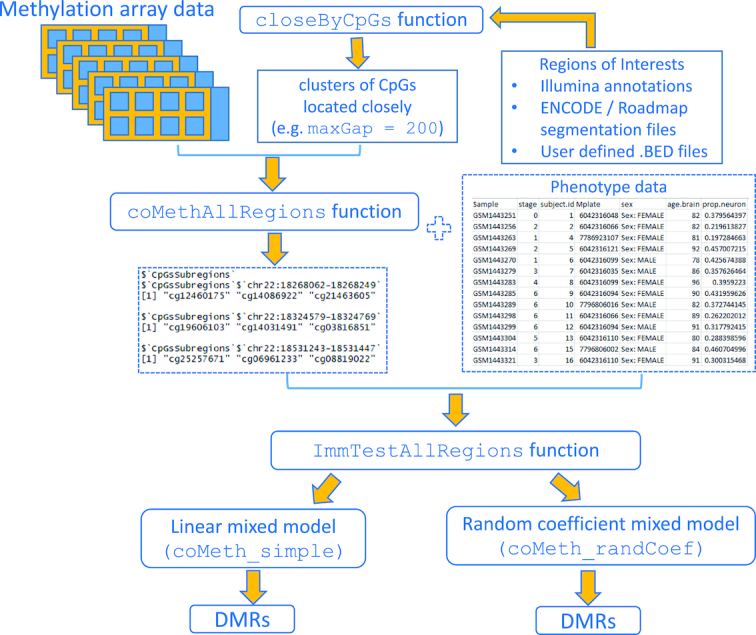
Workflow of the coMethDMR analysis pipeline.
In the first step, the genome will be divided into regions by taking advantage of methylation array annotations. Because the Illumina chips target methylation sites primarily at genic regions and CpG islands (CGIs, regions in the genome where there are more CG dinucleotides found than expected by chance), the regions can be defined based on their relations to genes or CGIs. For example, genomic regions can be annotated as TSS1500, TSS200, 5′UTR, first exon, gene body or 3′UTR. Alternatively, we can also group CpG probes by their relation to CGIs, that is island, shores, or shelves. We first extract clusters of CpG probes located closely within these genomic regions. By default, the coMethDMR function WriteCloseByAllRegions obtains CpG clusters with at least three CpGs (minCpGs = 3) and requires the maximum separation between any two consecutive probes within the clusters to be 200 bp (maxGap = 200) (Figure 1). This step helps to ensure the genomic regions would have similar CpG densities (Supplementary Text, Section 3).
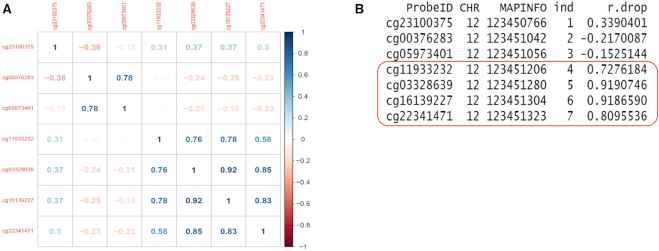
Figure 2A shows correlation between methylation levels among CpGs in an example of a genomic region corresponding to the CGI located at chr12:123450766–123451323. This region includes seven CpG probes ordered by their locations on the chromosome. Note that in spite of belonging to the same CGI, only the last four probes constitute the co-methylated region. To select the co-methylated region, we use the rdrop statistic, which is the correlation between each CpG with the sum of methylation levels in all other CpGs (Figure 2B). Note that in this example, the co-methylated region consists of all the contiguous CpGs with rdrop statistics greater than 0.5. We evaluated the sensitivity and specificity of the rdrop statistic at identifying co-methylated CpGs in the subsection ‘Optimal parameter in coMethDMR pipeline’ below.
Figure 2.
An example of a contiguous co-methylated sub-region. (A) This pre-defined region (a CGI) included seven CpG probes ordered by their location. Shown are correlation between methylation levels in each pair of CpGs. Note that only the last four probes constitute the co-methylated region within this CGI. (B) The CpGs in the co-methylated sub-region can be identified using the rdrop statistic, which is the correlation between each CpG with the sum of methylation levels in all other CpGs. In this example, all the co-methylated CpGs had rdrop statistics >0.5.
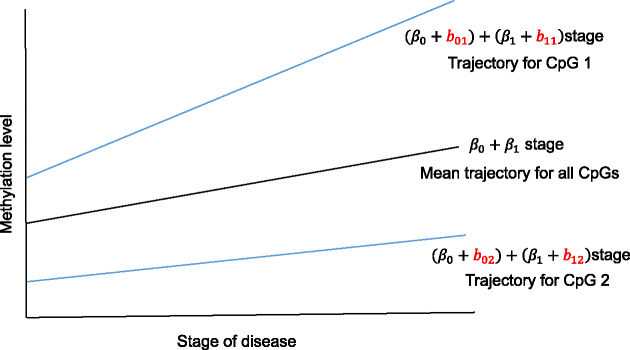
In the second step, to simultaneously model variations among the co-methylated CpGs as well as association with phenotype, we propose a random coefficient mixed model for testing groups of CpGs against phenotype. Figure 3 provides a hypothetical example fit of the mixed model for testing two CpGs against disease stage (treated as a linear variable). This model includes (i) normalized methylation values as the outcome variable, (ii) a systematic component that models the mean for each group of CpGs (the fixed effects intercept  and slope
  for variable stage) and (iii) a random component (the random coefficients) that model how each CpG’s slope for stage varies about the group mean (the random effects
  and
and  ). Because both fixed and random effects are included in this model, this model is a mixed effects model. Additional details of the random coefficient model are described in Section 1 of Supplementary Text.
Figure 3.
Illustration—proposed random coefficient mixed model for testing methylation levels in a hypothetical genomic region with two CpGs against disease stage treated as a linear variable.
We are interested in testing the null hypothesis that there is no association between phenotype (disease stage) and methylation values. This can be accomplished by testing the fixed effect for slope . In the sections below, we compare the statistical properties (i.e. power and Type I error rate) of this new random coefficient model with several currently available statistical models shown in Table 1.
RESULTS
Optimal parameter in coMethDMR pipeline
The only parameter in the entire coMethDMR pipeline is the rdrop threshold in the identification of co-methylated sub-regions within a genomic region (Figure 2B). These rdrop statistics are the leave-one-out correlations between each CpG with the sum of methylation levels in all other CpGs using methylation M-values. The co-methylated regions can be identified by ordering the CpGs by location, and selecting contiguous CpGs with leave-one-out correlations greater than a pre-specified threshold (rDrop), such as 0.5.
Simulation study 1
We conducted an analysis to assess the sensitivity and specificity of different rDrop values at identifying co-methylated CpGs. For each of the 19 977 CGI regions with at least three CpGs, we computed pairwise correlations of the CpGs within each CGI region. Next, we selected regions with 3, 5 or 8 CpGs (simulation parameter ncpgs) that have average pairwise correlations between 0.5–0.8 or 0.8–1 (simulation parameter minCorr) for this simulation study. For each genomic region, we added additional irrelevant CpGs by sampling CpGs randomly from the genome. The number of random CpGs added were either the same as ncpgs (simulation parameter fold = 1), or two times of ncpgs (simulation parameter fold = 2). Therefore, by design of the experiment, the status of each CpG, i.e. whether they belong to a co-methylated cluster or not, is known.
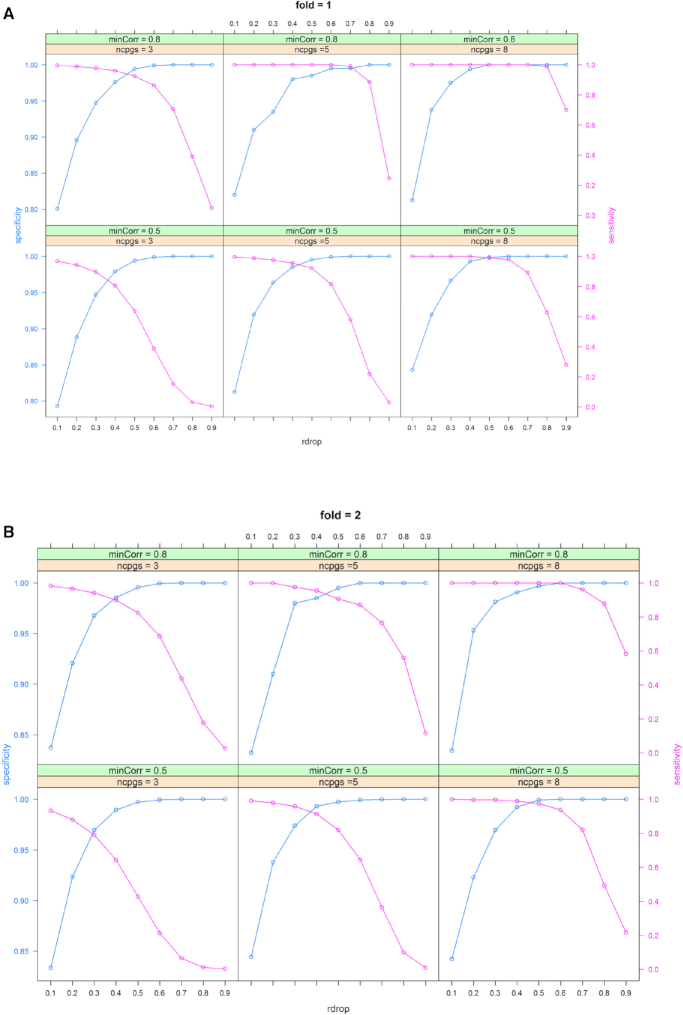
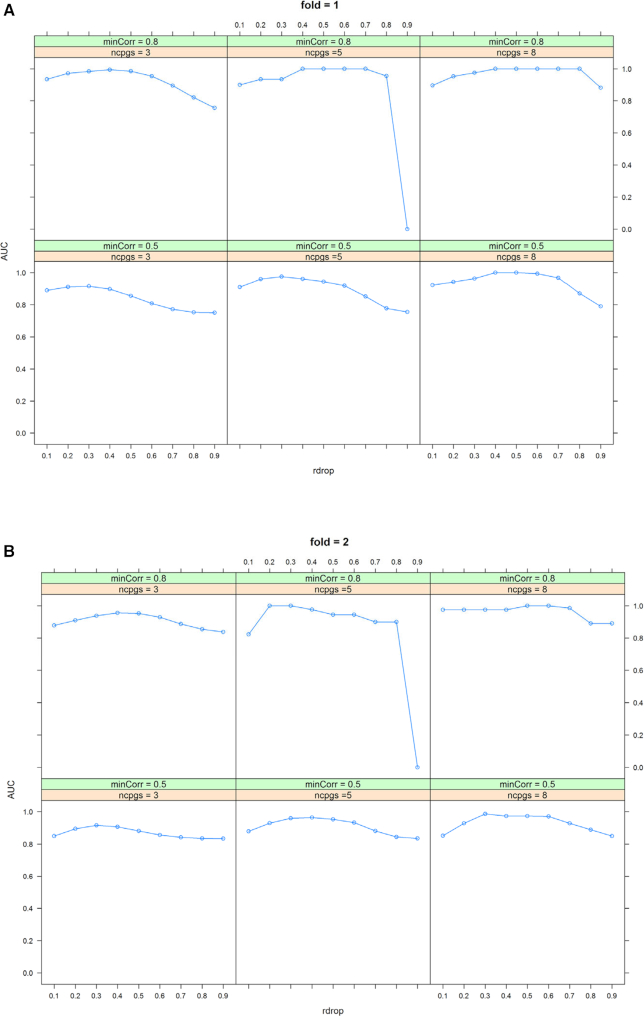
These parameter values yielded 12 simulation scenarios: ncpgs (3, 5 or 8) × minCorr (0.5–0.8 or 0.8–1) × fold (1 or 2). For each scenario, this process was repeated 10 times to generate a total of 120 simulation datasets. Step 1 in the coMethDMR pipeline was used to identify co-methylated regions for each simulated genomic region. Supplementary Table S1 and Figures 4–5 show average sensitivity, specificity, and area under the ROC curve (AUC) for each value of the rDrop parameter. These performance measures were computed by comparing true status of the CpGs (whether they belonged to co-methylated CpG clusters or were sampled randomly from the genome) with predicted status of the CpGs (whether a CpG was included in a co-methylated region identified by coMethDMR at each rDrop parameter value). AUC was computed using function auc from R package pROC.
Optimal AUC occurred at or near rDrop = 0.4 for most of the simulation scenarios (Supplementary Table S1). Figure 4 and 5 also showed that at rDrop = 0.4, both sensitivity and specificity were over 0.9 for all but one simulation scenario. Therefore, we set rDrop at 0.4 for subsequent analysis. Supplementary Table S2 shows using beta values and M-values resulted in similar sensitivity, specificity and AUC values.
Figure 4.
Optimal sensitivities and specificities for coMethDMR were achieved when the parameter rDrop is close to 0.4, when the number of random CpGs in the regions is (A) the same as ncpgs (fold = 1) or (B) two times the value of ncpgs (fold = 2).
Figure 5.
Optimal area under ROC curve (AUC) for coMethDMR was also achieved when the parameter rDrop is close to 0.4, when the number of random CpGs in the regions is (A) the same as ncpgs (fold = 1) or (B) two times the value of ncpgs (fold = 2).
coMethDMR controls Type I error when testing association between methylation levels in the genomic regions with phenotype.
We conducted two additional simulation studies to assess the Type I error (i.e. false positive rate) of the proposed method. In Simulation Study 2, we assume the genomic regions are pre-determined and we compared results using different statistical models for testing association of methylation levels with randomly generated phenotypes. In Simulation Study 3, we assume the genomic regions are not pre-determined, and we determined Type I error for the entire coMethDMR pipeline. That is, we first identified co-methylated regions, then tested these selected regions for association with randomly generated phenotypes.
Simulation study 2
We evaluated the Type I error rate of several currently available statistical methods, along with the newly-proposed random coefficient mixed model, by generating random phenotype data and test their association with genomic regions in a real DNA methylation dataset. More specifically, we compared the five statistical models listed in Table 1: (i) a linear model with mean methylation M-values as summary for a genomic region, (ii) a linear model with median M-values as summary for a genomic region, (iii) a GEE model, (iv) a simple linear mixed model and (v) our proposed random coefficient linear mixed model.
To emulate correlation structure between different CpGs in real data, we generated simulation datasets using a real methylation dataset (GSE59685) as input. Lunnon et al. (2014) conducted an AD study that measured DNA methylation levels in four brain regions postmortem from 122 individuals using the Infinium HumanMethylation450K BeadChip platform (7). For this Type I error analysis, we used prefrontal cortex methylation data from 27 control subjects. For each simulation dataset, we randomly generated an age value for each sample. In the following sections, we use the term pseudo age to refer to the computer-simulated age variable.
First, we select 10 CpG island genomic regions randomly. For each region, we generated pseudo age randomly from a Poisson distribution with mean 65, independently of the methylation data. Therefore, by design of experiment, these pseudo age values are not associated with any methylation regions. This procedure was repeated 1000 times, to generate 10 000 simulation datasets (10 genomic regions × 1000 repetitions). Under the null hypothesis of no association between methylation and pseudo age, we expected the P-value distributions for a model to follow the uniform distribution, where 5% of the P-values would be less than 0.05, corresponding to a Type I error rate of 0.05.
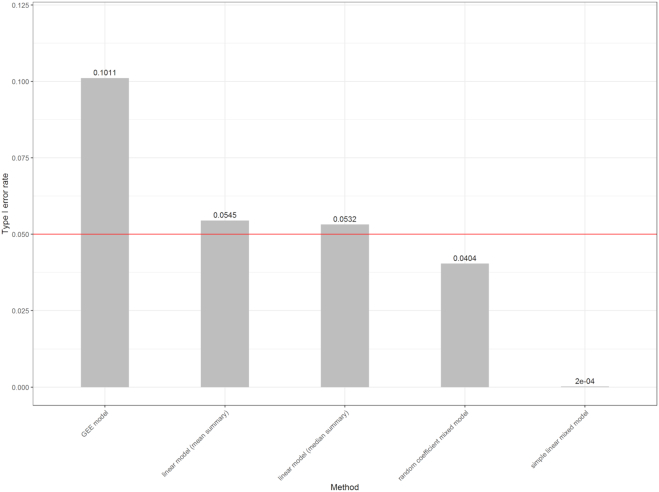
In Figure 6, the estimated Type I error rates for models in Table 1 were 0.1011 (GEE model), 0.0545 (linear model with mean summary), 0.0532 (linear model with median summary), 0.0404 (random coefficient mixed model) and 0.0002 (simple linear mixed model). We can see that the GEE model showed inflated false positive rate, with highest Type I error at about 0.1. The inflated Type I error rate by GEE model was also observed recently in simulation studies conducted by another group (19). On the other hand, the simple linear mixed model was overly conservative, with Type I error around 0.0002. Among the models, the proposed random coefficient mixed model and the linear models with mean or median summary had Type I error closest to 0.05.
Figure 6.
Type I error rates in the absence of differential methylation for different statistical models. Shown above the bars are proportions of CpG island genomic regions with P-values less than 0.05, for association with randomly generated ‘age’ from Poisson distribution with mean 65, average over 10 000 simulation datasets. Under the null hypothesis of no association, we expected P-values to follow a uniform distribution, so methods that control Type I error at nominal level would be close to the red line.
Simulation study 3
We next determined Type I error rate for coMethDMR when genomic regions are not pre-determined. That is, we determined if the coMethDMR pipeline, which includes both identifying co-methylated methylation clusters, and testing methylation regions against phenotype using linear mixed models, would still have controlled Type I error rates. To this end, we first identified 4444 co-methylated genomic regions mapped to CpG islands. Next we selected 10 co-methylated regions randomly, and then repeated Simulation Study 2 on these co-methylated regions. That is, for each co-methylated region, pseudo age values were generated randomly from Poisson distribution with mean of 65 for each of the samples. This procedure was repeated 1000 times to generate 10 000 simulation datasets (10 co-methylated regions × 1000 repetitions). Suppl. Figure 1 shows that after selecting co-methylated CpGs, Type I error remained well-controlled for both mixed models.
coMethDMR improves power substantially compared to fitting mixed model directly to methylation data
Simulation study 4
Because genomic regions are typically defined a priori based on annotations, without regard to the methylation data sets to be analyzed, we expect only a subset of CpGs in a pre-defined genomic region would be associated with the phenotype. We hypothesized that power can be improved by selecting consecutive CpGs in the co-methylated region first. To assess the power of the models, we performed a simulation study similar to Simulation Study 2 and 3 described above, except by testing methylation levels in the genomic regions against randomly generated pseudo age that are ranked in the same order as the mean of methylation values in the co-methylated subregion. Therefore, by design of the experiment, the values of pseudo ages of the samples are associated with co-methylated CpGs in each genomic region.
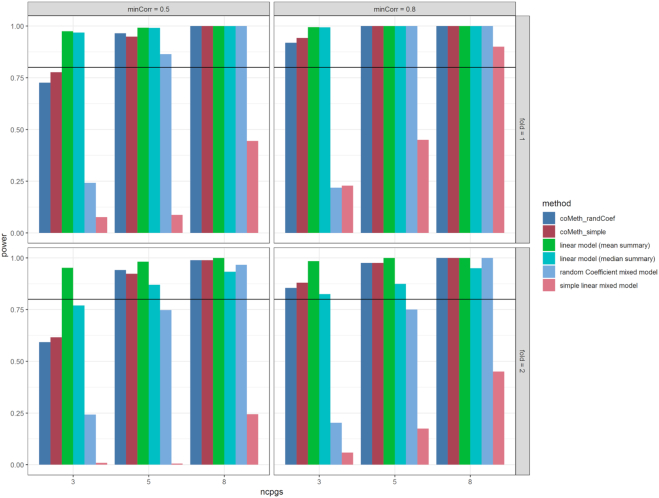
The results in Figure 7 show that for both random coefficient and simple linear mixed models, power improved substantially after selecting the co-methylated regions (coMeth_randCoef and coMeth_simple models). Between the two mixed models, without selecting co-methylated CpGs, the random coefficient mixed model had more power. After selecting co-methylated CpGs, both models performed similarly, especially when the number of co-methylated CpGs was at least moderate (i.e. nCpGs ≥ 5).
Figure 7.
Power is improved when fitting simple linear mixed model and random coefficient mixed model to co-methylated CpGs in genomic regions (coMeth_randCoef, coMeth_simple), compared to fitting the mixed models to all CpGs in genomic regions. When nCpGs = 3, linear model with mean summary had best power. When nCpGs = 5 or 8, coMeth_randCoef and coMeth_simple had similar power as the linear models. Reference line is at 80% power.
We also compared the power of the mixed models with other methods that had Type I error rate close to the nominal level, which are the linear models with mean or median summary as outcome variable. Figure 7 shows that among all models, the linear models and the mixed models fitted to co-methylated CpGs (coMeth_randCoef and coMeth_simple) achieved similar power in all scenarios except when the number of CpGs in the region is small and the correlations between CpGs is moderate (nCpGs = 3, minCorr = 0.5). When nCpGs = 3 and minCorr = 0.5, the linear models had better power around 95%, while the mixed models coMeth_randCoef and coMeth_simple had power ranging from 60% to 77%. On the other hand, without selecting co-methylated CpGs, the mixed models lacked power in all simulation scenarios, except for random coefficient mixed model when the number of CpGs in the true positive genomic region is large (nCpGs = 8).
Random coefficient mixed model improves specificity when identifying differentially methylated regions
As mentioned above, a key challenge in unsupervised approaches for identifying DMRs is their lack of specificity. In particular, it is desirable to identify significant genomic regions that include only CpG probes significantly associated with the continuous phenotype and exclude those CpGs not related to phenotype. To further evaluate the specificity of different statistical models on real methylation data, we next applied the five models described above as well as several supervised approaches (bumphunter (17), DMRcate (18), Probe Lasso (11) and comb-p (10)) to all 110 prefrontal cortex samples in the Lunnon et al.'s dataset (7) mentioned above to identify CGIs associated with Braak scores. Braak staging scores are a standardized measure of neurofibrillary tangle burden determined at autopsy (28). These scores range from 0 to 6, indicating different pathological severity of the disease. We treat these scores as a linear variable, adjusting for covariate effects from age, sex, batch and estimated proportions of neurons.
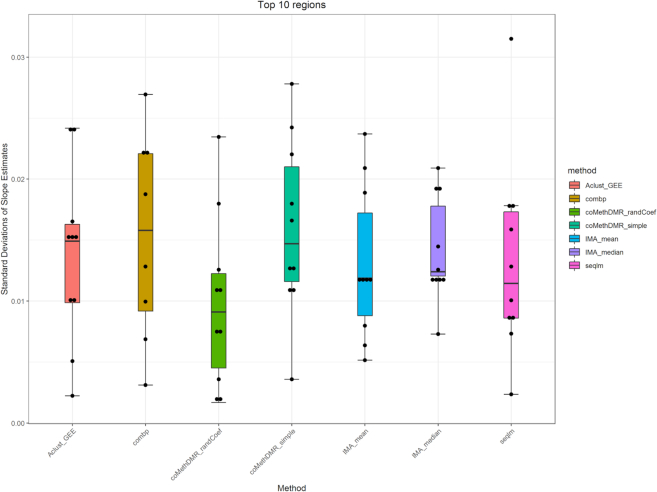
Supplementary Figure S2 shows mean trajectories of corrected methylation M-values (after adjusting for covariate effects) for individual CpGs in top 10 most significant genomic regions, identified by IMA_mean (linear model with mean summary implemented in IMA software), IMA_median (linear model with median summary implemented in IMA software), Aclust_GEE (GEE model implemented in Aclust software), seqlm (simple linear mixed model implemented in seqlm software), coMethDMR_simple (simple linear mixed model implemented in coMethDMR software), coMethDMR_randCoef (random coefficient mixed model implemented in coMethDMR software) and comb-p software. Among the supervised methods, only comb-p returned significant regions. In the figures, each dot corresponds to an average corrected methylation M value for samples from a particular Braak stage. Each line represents linear regression fitted on a particular CpG. Note that within these most significant regions, there were large heterogeneities in slopes for individual CpGs for all methods, except coMethDMR_randCoef. Figure 8 shows standard deviations of slope estimates for individual CpGs within the top 10 regions. Each dot represents standard deviation of individual CpG slope estimates within a significant region selected by a particular method. We observed that significant regions selected by random coefficient model (coMethDMR_randCoef) showed much less variances in individual CpG slopes estimates (which are obtained by applying a linear model to single CpGs), corresponding to more homogeneous associations between individual CpG methylations and disease stages.
Figure 8.
Significant regions selected by random coefficient model showed less variances in individual CpG slope estimates (i.e. more homogeneous associations between individual CpG methylations and disease stage). We considered the top 10 most significant regions with at least three CpGs by each method, except for comb-p which only returned 8 significant regions. Each dot represents standard deviation of individual CpG slope estimates within a significant region selected by a particular method. Note that standard deviations for coMethDMR_randCoef method are substantially lower than those from other methods.
To understand how the random coefficient mixed model improves specificity, note that this model specifically models co-variation of the slopes. In Figure 3 and Supplementary Text (subsection ‘Random coefficient mixed model’ under Section 1 ‘Unsupervised Approaches for Identifying DMRs’), the CpG specific slopes are modelled by random effects , where we assume
  . The variations in the CpG specific slopes will be captured by estimated variance component
  for the random effects
 , which contributes to variance of
 , the slope main effect for the continuous phenotype (e.g. disease stage). Thus, genomic regions with more consistent differential changes in methylation levels among the CpGs will have a lower value for
  , corresponding to a lower value for variance of
  , and yielding a more significant P-value for the slope main effect. On the other hand, regions with outlier CpGs would have large variances for
  , resulting non-significant P-values for the slope main effect.
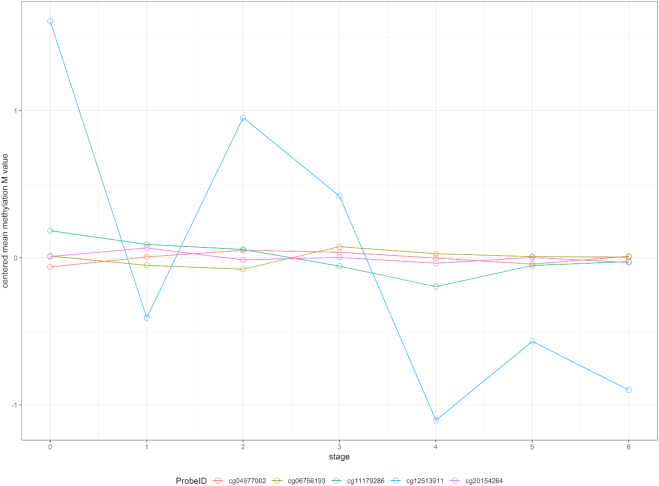
To further illustrate the effect of modeling heterogeneity in CpG slopes, consider the 5 CpGs located within the CGI at chr13:115046754–115048034 (Figure 9). To simplify this example, we tested methylation M-values in this region against disease stage, without controlling for any covariate variables. The results showed that the P-values for this region are  (IMA_mean),
  (IMA_median),
  (GEE in Aclust), and
  (simple linear mixed model in seqlm and coMethDMR_simple). However, note that the significance of this region is driven by only 1 CpG, cg12513911 (light blue). On the other hand, the P-value for random coefficient model in coMethDMR_randCoef is 0.315, which indicates that the random coefficient mixed model correctly classified this CGI as a non-significant region.
Figure 9.
Trajectories of five individual CpGs. Each dot indicates the average methylation M-value for all samples available at a given disease stage. These averages are then mean centered to put all CpGs on the same graph. The P-values for this region by different methods are 2 (IMA_mean),
  (IMA_median), 1
 (GEE in Aclust), and
  (simple linear mixed model in seqlm and coMethDMR_simple), 0.315 (random coefficient model in coMethDMR_randCoef).
This example shows that without specifically modeling variances in the slopes, the significant regions identified might have large heterogeneity in individual CpG slopes. As a result, the region may include a substantial number of non-significant CpGs. In particular, region-wise P-values using conventional unsupervised methods can be driven by a single outlier CpG that has strong association signal, which does not constitute a DMR by definition. In contrast, the proposed random coefficient mixed model would prioritize genomic regions where the mean methylation trajectory for multiple CpGs is highly correlated with continuous phenotype, and the heterogeneity in trajectories for individual CpGs within the region is low.
coMethDMR identifies biologically-meaningful DMRs
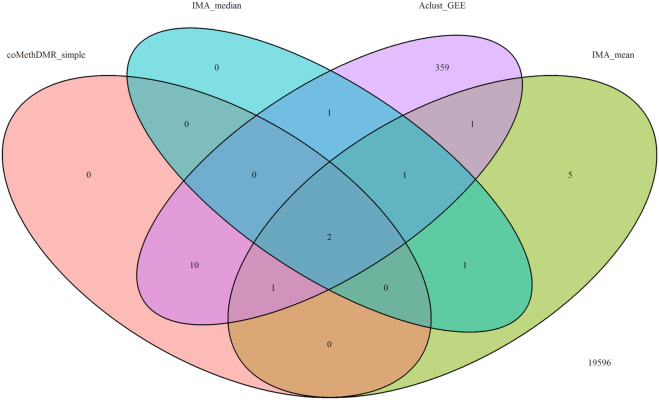
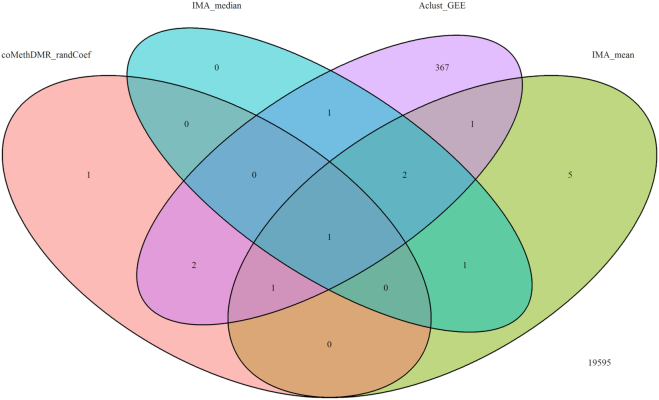
To evaluate the biological plausibility of DMRs identified by different methods, we next examined the analysis results for testing methylation levels with AD stages in the Lunnon et al.'s dataset. After adjusting for age, sex, batch, and estimated proportions of neurons, coMethDMR_simple and coMethDMR_randCoef identified 10 and 4 significant regions at 5% false discovery rate (FDR), respectively. We compared these results with significant DMRs identified by other methods, including the IMA_mean, IMA_median, Aclust_GEE and seqlm methods. We also tested several supervised methods, including DMRcate, bumphunter, probelasso, and comb-p. Figures 10–11 show the overlap of significant regions identified by these methods and the coMethDMR_simple and coMethDMR_randCoef methods, respectively. The seqlm method (unsupervised) and DMRcate, bumphunter, and probeLasso methods (supervised) were excluded from these figures because they did not identify any DMRs at 5% FDR.
Figure 10.
Comparison of significant regions at 5% False Discovery Rate (FDR) selected by coMethDMR_simple with other unsupervised approaches (IMA_median, IMA_mean and Aclust_GEE).
Figure 11.
Comparison of significant regions at 5% FDR selected by coMethDMR_randCoef with other unsupervised approaches (IMA_median, IMA_mean and Aclust_GEE).
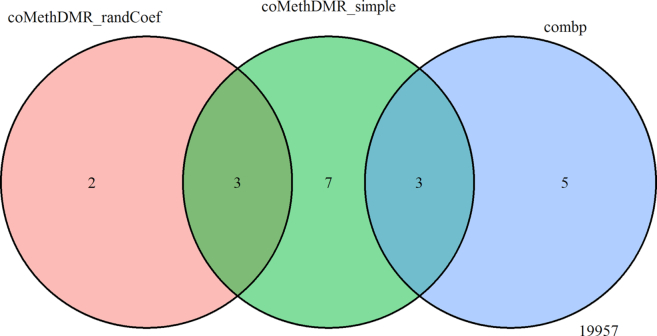
The results showed that all except one DMR identified by IMA_median were also identified by IMA_mean. Three (out of 13) DMRs identified by coMethDMR_simple and two (out of 5) DMRs identified by coMethDMR_randCoef were also identified by IMA_mean. Among these, two DMRs (chr21:47855893–47856020 and chr7:27146237–27146445) were identified by all three methods (Figures 10–11, Table 2). Results from coMethDMR also had substantial overlap with Aclust_GEE results. However, this could be due to the fact that Aclust_GEE method identified a large number of DMRs. Given that the Type I error rates for Aclust_GEE was inflated (Figure 6), many of the significant DMRs could be false positives. Compared to the overlap between comb-p and coMethDMR_randCoef, results from coMethDMR_simple agreed more with the supervised method comb-p (Figure 12), probably because neither method accounts for heterogeneities in CpG slopes.
Table 2.
Differentially methylated regions associated with AD stages identified by coMethDMR
| Region | Gene | Estimate | StdErr | P value | FDR |
|---|---|---|---|---|---|
| method =coMethDMR_randCoef | |||||
| chr22:19709548–19709755 | SEPT5;GP1BB | 0.041 | 0.008 | 6.21E–07 | 0.003 |
| chr21:47855893–47856020 | PCNT | 0.042 | 0.009 | 1.37E–06 | 0.003 |
| chr2:241721922–241722113 | KIF1A | 0.024 | 0.005 | 9.15E–06 | 0.013 |
| chr7:27146237–27146445 | HOXA3 | 0.054 | 0.012 | 1.54E–05 | 0.017 |
| chr1:160040544–160040667 | KCNJ10 | –0.027 | 0.006 | 2.07E–05 | 0.018 |
| method = coMethDMR_simple | |||||
| chr22:19709548–19709755 | SEPT5;GP1BB | 0.041 | 0.008 | 3.16E–07 | 0.001 |
| chr21:47855893–47856020 | PCNT | 0.042 | 0.008 | 8.68E–07 | 0.002 |
| chr7:27153580–27153636 | HOXA3 | 0.064 | 0.014 | 3.41E–06 | 0.005 |
| chr7:27146237–27146445 | HOXA3 | 0.054 | 0.012 | 5.01E–06 | 0.005 |
| chr17:74475240–74475402 | RHBDF2 | 0.060 | 0.014 | 2.40E–05 | 0.021 |
| chr7:27155002–27155358 | HOXA3 | 0.047 | 0.012 | 4.12E–05 | 0.024 |
| chr7:27185136–27185512 | HOXA6 | 0.036 | 0.009 | 4.76E–05 | 0.024 |
| chr17:3848156–3848506 | ATP2A3 | 0.045 | 0.011 | 4.81E–05 | 0.024 |
| chr18:74799495–74799572 | MBP | 0.063 | 0.016 | 4.84E–05 | 0.024 |
| chr16:29675846–29676071 | SPN | –0.051 | 0.013 | 6.41E–05 | 0.028 |
| chr1:55246867–55247140 | TTC22 | 0.050 | 0.013 | 9.64E–05 | 0.038 |
| chr19:1070986–1071208 | HMHA1 | 0.050 | 0.013 | 1.15E–04 | 0.042 |
| chr19:10736006–10736355 | SLC44A2 | 0.050 | 0.013 | 1.45E–04 | 0.049 |
Figure 12.
Comparison of significant regions at 5% FDR (or Sidak P-value for comb-p) selected by coMethDMR_randCoef, coMethDMR_simple and the supervised approach comb-p.
Table 2 shows the significant regions identified by coMethDMR_simple and coMethDMR_randCoef. For the DMRs identified by coMethDMR_randCoef, the most significant region is in the gene body of SEPT5, a brain-expressed cytoskeletal organizing gene that was nominally associated with AD in family-based GWAS studies (29). It has been identified in neurofibrillary tangles, neuropil threads, and dystrophic neuritis in senile plaques of brains affected by AD (30) and was shown by proteomic analysis to have altered levels in brains of AD patients (31). The second gene, PCNT, has also been linked to altered methylation in AD brains (6). The third region is in KIF1A, a member of the kinesin family that transports cargo along axonal microtubules. One of KIF1A’s major roles is to transport BACE1 in neuronal axons (32). The fourth region is in the 3′ UTR of the HOXA3 gene, which is part of a gene cluster on chromosome 7. Recently, aberrant methylation of this region has been shown to be associated with AD neuropathology in multiple AD EWAS datasets (33). The fifth region maps to the KCNJ10 gene, which encodes Kir4.1, an inwardly rectifying potassium channel expressed in glial cells in the central nervous system (34). Kir4.1 has been linked to multiple neurological disorders such as Alzheimer disease (35), amyotrophic lateral sclerosis (36) and Huntington disease (37). In particular, the loss of Kir4.1 expression has been observed in post-mortem tissues from AD patients with moderate to severe amyloid deposition (35) and the expression of KCKJ10 was shown to be regulated by DNA methylation (38,39).
The coMethDMR_simple model identified several more genes that were previously implicated in AD etiology. For example, the MBP gene encodes myelin sheath of oligodendrocytes and Schwann cells in the nervous system. Brains from patients with AD had significant loss of intact MBP. Myelin disruption is an important feature of Alzheimer's disease (AD) that contributes to impairment of neuronal circuitry and cognition (40,41). Another important gene, ATP2A3, encodes one of the SERCA Ca(2+)-ATPases, which are involved in maintenance of low intraneural Ca2+ concentration. The malfunction of this pump was recently found in brains of AD subjects (42,43). On the protein-protein interaction network, the RHBDF2 gene is connected to ADAM17, which is an alpha-secretase candidate processing amyloid precursor protein (APP) (44). The HMHA1 gene is close to the 3′ untranslated region of ABCA7, a known AD susceptibility gene (45), which was also found to be abnormally methylated in ALS (46). SLC24A4 may be involved in neural development (47) and was found to increase risk of AD (48). For the remaining genes, TTC22 is involved in chaperone activity and SPN appears to be involved in immunological and inflammatory process that may relate to AD pathophysiology. Notably, methylation of CpGs located within the HOXA3, RHBDF2, TTC22, SPN, HMHA1 and SLC44A2 genes were also identified to be significantly associated with AD pathology previously in other large EWAS cohorts (6,49–51). Taken together, these results suggested that coMethDMR can identify disease-relevant genes and replicate previous single-site and regional methylation analyses, as well as nominate novel genes that are likely involved in AD pathogenesis.
DISCUSSION
Although a number of methods have been proposed, identifying differentially methylated regions remains a challenging task because of the complexities in DNA methylation data. One such challenge with supervised DMR-identification methods is their lack of power when the difference in beta values between two groups was small but consistent (i.e. difference in mean beta values is <0.05) (25). This is likely because supervised methods scan the genome to identify regions with adjacent low P-values, so a number of positions that pass a multiple-comparison-corrected significance threshold are required. On the other hand, unsupervised methods, which define genomic regions first and then test them against phenotype, tend to lack specificity and often prioritize irrelevant genomic regions.
In this paper, we have presented coMethDMR, an unsupervised method for identifying differentially methylated regions for methylation data measured by Illumina arrays. Several additional features of coMethDMR make it especially attractive in a practical setting:
First, coMethDMR improves specificity and prioritizes genomic regions with co-methylated CpGs that are consistently associated with a continuous phenotype. In addition to the identification of DMRs, this improved accuracy in scoring and ranking genomic regions would also provide more accuracy in downstream analysis such as network or pathway analysis, where genes are represented by genomic regions mapped to them, as well as integration with other types of -Omics data, such as gene expression measured by RNAseq.
Second, coMethDMR improves power by identifying and testing co-methylated regions in the genome, instead of testing all genomic regions in the genome. By limiting analysis to only the most relevant regions in the genome, P-values are not diluted by multiple-comparison correction for regions that are unlikely to be candidate for DMRs. Note the co-methylated regions are selected without using any outcome information, so that Type I error rates for the coMethDMR pipeline are preserved.
Third, coMethDMR is flexible in the genomic regions one would like to focus on. The input for coMethDMR can be one, two or many genomic regions. This flexibility allows focused testing of targeted genomic regions, for example, testing significant DMRs from previous studies in a new dataset. By testing fewer number of genomic regions, the burden for multiple comparisons is reduced. In addition to annotations provided by Illumina, other definitions of genomic regions can also be used to group CpG probes, such as the cell-type specific chromatin state segmentations identified by patterns of histone modifications in ENCODE project (52), chromatin accessible regions detected in ATAC-seq data, or transcription factor binding sites detected in ChIP-seq data. This new feature of coMethDMR facilitates integration of DNA methylation data with carefully-curated metadata generated by large consortia such as ENCODE (52) and Roadmap Epigenomics (53), improving power by focusing on the gene-regulatory regions which are most likely to be differentially methylated.
In summary, coMethDMR offers a flexible, powerful, and accurate solution for DMR analysis of array-based DNA methylation data. The entire analytical pipeline is implemented as an open-source R package, freely available to the research community. We have shown coMethDMR provides well-controlled false positive rate, as well as improved power over directly testing a genomic region with a continuous phenotype. In the analysis of an Alzheimer's dataset, the agreement between results obtained by coMethDMR and previous reports further validates this proposed method. coMethDMR empowers epigenetic researchers to discover meaningful biological insights from vast amounts of large and complex DNA methylation datasets.
DATA AVAILABILITY
The R package coMethDMR can be accessed at https://github.com/lissettegomez/coMethDMR. A user guide for coMethDMR which provides details of commands and output is included in Section 4 of Supplementary Text. The analysis scripts used in this study can be accessed at github at https://github.com/lissettegomez/coMethDMRPaper.
The Lunnon et al. Alzheimer's Disease dataset are available in the GEO data repository (accession numbers: GSE59685, GSE43414)
Supplementary Material
ACKNOWLEDGEMENTS
The authors would like to thank Michael Schmidt for testing the software and providing helpful suggestions.
SUPPLEMENTARY DATA
Supplementary Data are available at NAR Online.
FUNDING
National Institutes of Health [R01AG061127, R01 AG062634 and R21AG060459 to L.W., R01CA158472, R01 CA200987 and U24 CA210954 to X.C.]. Funding for open access charge: National Institutes of Health.
Conflict of interest statement. None declared.
REFERENCES
- 1. Portela A., Esteller M.. Epigenetic modifications and human disease. Nat. Biotechnol. 2010; 28:1057–1068. [DOI] [PubMed] [Google Scholar]
- 2. Melotte V., Lentjes M.H., van den Bosch S.M., Hellebrekers D.M., de Hoon J.P., Wouters K.A., Daenen K.L., Partouns-Hendriks I.E., Stessels F., Louwagie J. et al.. N-Myc downstream-regulated gene 4 (NDRG4): a candidate tumor suppressor gene and potential biomarker for colorectal cancer. J. Natl. Cancer Inst. 2009; 101:916–927. [DOI] [PubMed] [Google Scholar]
- 3. Schmidt B., Liebenberg V., Dietrich D., Schlegel T., Kneip C., Seegebarth A., Flemming N., Seemann S., Distler J., Lewin J. et al.. SHOX2 DNA methylation is a biomarker for the diagnosis of lung cancer based on bronchial aspirates. BMC Cancer. 2010; 10:600. [DOI] [PMC free article] [PubMed] [Google Scholar]
- 4. Jain S., Chen S., Chang K.C., Lin Y.J., Hu C.T., Boldbaatar B., Hamilton J.P., Lin S.Y., Chang T.T., Chen S.H. et al.. Impact of the location of CpG methylation within the GSTP1 gene on its specificity as a DNA marker for hepatocellular carcinoma. PLoS One. 2012; 7:e35789. [DOI] [PMC free article] [PubMed] [Google Scholar]
- 5. Lord J., Cruchaga C.. The epigenetic landscape of Alzheimer's disease. Nat. Neurosci. 2014; 17:1138–1140. [DOI] [PMC free article] [PubMed] [Google Scholar]
- 6. De Jager P.L., Srivastava G., Lunnon K., Burgess J., Schalkwyk L.C., Yu L., Eaton M.L., Keenan B.T., Ernst J., McCabe C. et al.. Alzheimer's disease: early alterations in brain DNA methylation at ANK1, BIN1, RHBDF2 and other loci. Nat. Neurosci. 2014; 17:1156–1163. [DOI] [PMC free article] [PubMed] [Google Scholar]
- 7. Lunnon K., Smith R., Hannon E., De Jager P.L., Srivastava G., Volta M., Troakes C., Al-Sarraj S., Burrage J., Macdonald R. et al.. Methylomic profiling implicates cortical deregulation of ANK1 in Alzheimer's disease. Nat. Neurosci. 2014; 17:1164–1170. [DOI] [PMC free article] [PubMed] [Google Scholar]
- 8. Pidsley R., Viana J., Hannon E., Spiers H., Troakes C., Al-Saraj S., Mechawar N., Turecki G., Schalkwyk L.C., Bray N.J. et al.. Methylomic profiling of human brain tissue supports a neurodevelopmental origin for schizophrenia. Genome Biol. 2014; 15:483. [DOI] [PMC free article] [PubMed] [Google Scholar]
- 9. Jaffe A.E., Gao Y., Deep-Soboslay A., Tao R., Hyde T.M., Weinberger D.R., Kleinman J.E.. Mapping DNA methylation across development, genotype and schizophrenia in the human frontal cortex. Nat. Neurosci. 2016; 19:40–47. [DOI] [PMC free article] [PubMed] [Google Scholar]
- 10. Pedersen B.S., Schwartz D.A., Yang I.V., Kechris K.J.. Comb-p: software for combining, analyzing, grouping and correcting spatially correlated P-values. Bioinformatics. 2012; 28:2986–2988. [DOI] [PMC free article] [PubMed] [Google Scholar]
- 11. Butcher L.M., Beck S.. Probe Lasso: a novel method to rope in differentially methylated regions with 450K DNA methylation data. Methods. 2015; 72:21–28. [DOI] [PMC free article] [PubMed] [Google Scholar]
- 12. Irizarry R.A., Ladd-Acosta C., Carvalho B., Wu H., Brandenburg S.A., Jeddeloh J.A., Wen B., Feinberg A.P.. Comprehensive high-throughput arrays for relative methylation (CHARM). Genome Res. 2008; 18:780–790. [DOI] [PMC free article] [PubMed] [Google Scholar]
- 13. Jaenisch R., Bird A.. Epigenetic regulation of gene expression: how the genome integrates intrinsic and environmental signals. Nat. Genet. 2003; 33:245–254. [DOI] [PubMed] [Google Scholar]
- 14. Irizarry R.A., Ladd-Acosta C., Wen B., Wu Z., Montano C., Onyango P., Cui H., Gabo K., Rongione M., Webster M. et al.. The human colon cancer methylome shows similar hypo- and hypermethylation at conserved tissue-specific CpG island shores. Nat. Genet. 2009; 41:178–186. [DOI] [PMC free article] [PubMed] [Google Scholar]
- 15. Ventham N.T., Kennedy N.A., Adams A.T., Kalla R., Heath S., O’Leary K.R., Drummond H., consortium I.B., consortium I.C., Wilson D.C. et al.. Integrative epigenome-wide analysis demonstrates that DNA methylation may mediate genetic risk in inflammatory bowel disease. Nat. Commun. 2016; 7:13507. [DOI] [PMC free article] [PubMed] [Google Scholar]
- 16. Rutten B.P.F., Vermetten E., Vinkers C.H., Ursini G., Daskalakis N.P., Pishva E., de Nijs L., Houtepen L.C., Eijssen L., Jaffe A.E. et al.. Longitudinal analyses of the DNA methylome in deployed military servicemen identify susceptibility loci for post-traumatic stress disorder. Mol. Psychiatry. 2018; 23:1145–1156. [DOI] [PMC free article] [PubMed] [Google Scholar]
- 17. Jaffe A.E., Murakami P., Lee H., Leek J.T., Fallin M.D., Feinberg A.P., Irizarry R.A.. Bump hunting to identify differentially methylated regions in epigenetic epidemiology studies. Int. J. Epidemiol. 2012; 41:200–209. [DOI] [PMC free article] [PubMed] [Google Scholar]
- 18. Peters T.J., Buckley M.J., Statham A.L., Pidsley R., Samaras K., R V.L., Clark S.J., Molloy P.L.. De novo identification of differentially methylated regions in the human genome. Epigenet. Chromatin. 2015; 8:6. [DOI] [PMC free article] [PubMed] [Google Scholar]
- 19. Kolde R., Martens K., Lokk K., Laur S., Vilo J.. seqlm: an MDL based method for identifying differentially methylated regions in high density methylation array data. Bioinformatics. 2016; 32:2604–2610. [DOI] [PMC free article] [PubMed] [Google Scholar]
- 20. Sofer T., Schifano E.D., Hoppin J.A., Hou L., Baccarelli A.A.. A-clustering: a novel method for the detection of co-regulated methylation regions, and regions associated with exposure. Bioinformatics. 2013; 29:2884–2891. [DOI] [PMC free article] [PubMed] [Google Scholar]
- 21. Chen D.P., Lin Y.C., Fann C.S.. Methods for identifying differentially methylated regions for sequence- and array-based data. Brief. Funct. Genomics. 2016; 15:485–490. [DOI] [PubMed] [Google Scholar]
- 22. Robinson M.D., Kahraman A., Law C.W., Lindsay H., Nowicka M., Weber L.M., Zhou X.. Statistical methods for detecting differentially methylated loci and regions. Front. Genet. 2014; 5:324. [DOI] [PMC free article] [PubMed] [Google Scholar]
- 23. Zhang Q., Zhao Y., Zhang R., Wei Y., Yi H., Shao F., Chen F.. A comparative study of five association tests based on CpG set for epigenome-wide association studies. PLoS One. 2016; 11:e0156895. [DOI] [PMC free article] [PubMed] [Google Scholar]
- 24. Li D., Xie Z., Pape M.L., Dye T.. An evaluation of statistical methods for DNA methylation microarray data analysis. BMC Bioinformatics. 2015; 16:217. [DOI] [PMC free article] [PubMed] [Google Scholar]
- 25. Mallik S., Odom G.J., Gao Z., Gomez L., Chen X., Wang L.. An evaluation of supervised methods for identifying differentially methylated regions in Illumina methylation arrays. Brief. Bioinform. 2018; doi:10.1093/bib/bby085. [DOI] [PMC free article] [PubMed] [Google Scholar]
- 26. Wang D., Yan L., Hu Q., Sucheston L.E., Higgins M.J., Ambrosone C.B., Johnson C.S., Smiraglia D.J., Liu S.. IMA: an R package for high-throughput analysis of Illumina's 450K Infinium methylation data. Bioinformatics. 2012; 28:729–730. [DOI] [PMC free article] [PubMed] [Google Scholar]
- 27. Littell R.C., Miliken G.A., Stroup W.W., Wolfinger R.D.. SAS for Mixed Models. 2006; Cary, N.C: SAS Institute Inc. [Google Scholar]
- 28. Braak H., Braak E.. Staging of Alzheimer's disease-related neurofibrillary changes. Neurobiol. Aging. 1995; 16:271–278. [DOI] [PubMed] [Google Scholar]
- 29. Herold C., Hooli B.V., Mullin K., Liu T., Roehr J.T., Mattheisen M., Parrado A.R., Bertram L., Lange C., Tanzi R.E.. Family-based association analyses of imputed genotypes reveal genome-wide significant association of Alzheimer's disease with OSBPL6, PTPRG, and PDCL3. Mol. Psychiatry. 2016; 21:1608–1612. [DOI] [PMC free article] [PubMed] [Google Scholar]
- 30. Kinoshita A., Kinoshita M., Akiyama H., Tomimoto H., Akiguchi I., Kumar S., Noda M., Kimura J.. Identification of septins in neurofibrillary tangles in Alzheimer's disease. Am. J. Pathol. 1998; 153:1551–1560. [DOI] [PMC free article] [PubMed] [Google Scholar]
- 31. Musunuri S., Wetterhall M., Ingelsson M., Lannfelt L., Artemenko K., Bergquist J., Kultima K., Shevchenko G.. Quantification of the brain proteome in Alzheimer's disease using multiplexed mass spectrometry. J. Proteome Res. 2014; 13:2056–2068. [DOI] [PubMed] [Google Scholar]
- 32. Hung C.O., Coleman M.P.. KIF1A mediates axonal transport of BACE1 and identification of independently moving cargoes in living SCG neurons. Traffic. 2016; 17:1155–1167. [DOI] [PMC free article] [PubMed] [Google Scholar]
- 33. Smith R.G., Hannon E., De Jager P.L., Chibnik L., Lott S.J., Condliffe D., Smith A.R., Haroutunian V., Troakes C., Al-Sarraj S. et al.. Elevated DNA methylation across a 48-kb region spanning the HOXA gene cluster is associated with Alzheimer's disease neuropathology. Alzheimer's Dementia. 2018; 14:1580–1588. [DOI] [PMC free article] [PubMed] [Google Scholar]
- 34. Nwaobi S.E., Cuddapah V.A., Patterson K.C., Randolph A.C., Olsen M.L.. The role of glial-specific Kir4.1 in normal and pathological states of the CNS. Acta Neuropathol. (Berl.). 2016; 132:1–21. [DOI] [PMC free article] [PubMed] [Google Scholar]
- 35. Wilcock D.M., Vitek M.P., Colton C.A.. Vascular amyloid alters astrocytic water and potassium channels in mouse models and humans with Alzheimer's disease. Neuroscience. 2009; 159:1055–1069. [DOI] [PMC free article] [PubMed] [Google Scholar]
- 36. Kaiser M., Maletzki I., Hulsmann S., Holtmann B., Schulz-Schaeffer W., Kirchhoff F., Bahr M., Neusch C.. Progressive loss of a glial potassium channel (KCNJ10) in the spinal cord of the SOD1 (G93A) transgenic mouse model of amyotrophic lateral sclerosis. J. Neurochem. 2006; 99:900–912. [DOI] [PubMed] [Google Scholar]
- 37. Tong X., Ao Y., Faas G.C., Nwaobi S.E., Xu J., Haustein M.D., Anderson M.A., Mody I., Olsen M.L., Sofroniew M.V. et al.. Astrocyte Kir4.1 ion channel deficits contribute to neuronal dysfunction in Huntington's disease model mice. Nat. Neurosci. 2014; 17:694–703. [DOI] [PMC free article] [PubMed] [Google Scholar]
- 38. Nwaobi S.E., Lin E., Peramsetty S.R., Olsen M.L.. DNA methylation functions as a critical regulator of Kir4.1 expression during CNS development. Glia. 2014; 62:411–427. [DOI] [PMC free article] [PubMed] [Google Scholar]
- 39. Nwaobi S.E., Olsen M.L.. Correlating gene-specific DNA methylation changes with expression and transcriptional activity of astrocytic KCNJ10 (Kir4.1). J. Visual. Exp.: JoVE. 2015; e52406. [DOI] [PMC free article] [PubMed] [Google Scholar]
- 40. Liao M.C., Ahmed M., Smith S.O., Van Nostrand W.E.. Degradation of amyloid beta protein by purified myelin basic protein. J. Biol. Chem. 2009; 284:28917–28925. [DOI] [PMC free article] [PubMed] [Google Scholar]
- 41. Zhan X., Jickling G.C., Ander B.P., Liu D., Stamova B., Cox C., Jin L.W., DeCarli C., Sharp F.R.. Myelin injury and degraded myelin vesicles in Alzheimer's disease. Curr. Alzheimer Res. 2014; 11:232–238. [DOI] [PMC free article] [PubMed] [Google Scholar]
- 42. Mata A.M., Berrocal M., Sepulveda M.R.. Impairment of the activity of the plasma membrane Ca(2)(+)-ATPase in Alzheimer's disease. Biochem. Soc. Trans. 2011; 39:819–822. [DOI] [PubMed] [Google Scholar]
- 43. Kawalia S.B., Raschka T., Naz M., de Matos Simoes R., Senger P., Hofmann-Apitius M.. Analytical strategy to prioritize Alzheimer's Disease candidate genes in gene regulatory networks using public expression data. J. Alzheimer's Dis.: JAD. 2017; 59:1237–1254. [DOI] [PMC free article] [PubMed] [Google Scholar]
- 44. Buxbaum J.D., Liu K.N., Luo Y., Slack J.L., Stocking K.L., Peschon J.J., Johnson R.S., Castner B.J., Cerretti D.P., Black R.A.. Evidence that tumor necrosis factor alpha converting enzyme is involved in regulated alpha-secretase cleavage of the Alzheimer amyloid protein precursor. J. Biol. Chem. 1998; 273:27765–27767. [DOI] [PubMed] [Google Scholar]
- 45. De Roeck A., Van Broeckhoven C., Sleegers K.. The role of ABCA7 in Alzheimer's disease: evidence from genomics, transcriptomics and methylomics. Acta Neuropathol. (Berl). 2019; doi:10.1007/s00401-019-01994-1. [DOI] [PMC free article] [PubMed] [Google Scholar]
- 46. Figueroa-Romero C., Hur J., Bender D.E., Delaney C.E., Cataldo M.D., Smith A.L., Yung R., Ruden D.M., Callaghan B.C., Feldman E.L.. Identification of epigenetically altered genes in sporadic amyotrophic lateral sclerosis. PLoS One. 2012; 7:e52672. [DOI] [PMC free article] [PubMed] [Google Scholar]
- 47. Larsson M., Duffy D.L., Zhu G., Liu J.Z., Macgregor S., McRae A.F., Wright M.J., Sturm R.A., Mackey D.A., Montgomery G.W. et al.. GWAS findings for human iris patterns: associations with variants in genes that influence normal neuronal pattern development. Am. J. Hum. Genet. 2011; 89:334–343. [DOI] [PMC free article] [PubMed] [Google Scholar]
- 48. Adams H.H., de Bruijn R.F., Hofman A., Uitterlinden A.G., van Duijn C.M., Vernooij M.W., Koudstaal P.J., Ikram M.A.. Genetic risk of neurodegenerative diseases is associated with mild cognitive impairment and conversion to dementia. Alzheimer's Dementia. 2015; 11:1277–1285. [DOI] [PubMed] [Google Scholar]
- 49. Yu L., Chibnik L.B., Srivastava G.P., Pochet N., Yang J., Xu J., Kozubek J., Obholzer N., Leurgans S.E., Schneider J.A. et al.. Association of Brain DNA methylation in SORL1, ABCA7, HLA-DRB5, SLC24A4, and BIN1 with pathological diagnosis of Alzheimer disease. JAMA Neurol. 2015; 72:15–24. [DOI] [PMC free article] [PubMed] [Google Scholar]
- 50. Smith A.R., Mill J., Smith R.G., Lunnon K.. Elucidating novel dysfunctional pathways in Alzheimer's disease by integrating loci identified in genetic and epigenetic studies. Neuroepigenetics. 2016; 6:32–50. [Google Scholar]
- 51. Smith R.G., Hannon E., De Jager P.L., Chibnik L., Lott S.J., Condliffe D., Smith A.R., Haroutunian V., Troakes C., Al-Sarraj S. et al.. Elevated DNA methylation across a 48-kb region spanning the HOXA gene cluster is associated with Alzheimer's disease neuropathology. Alzheimer's Dementia. 2018; 14:1580–1588. [DOI] [PMC free article] [PubMed] [Google Scholar]
- 52. Davis C.A., Hitz B.C., Sloan C.A., Chan E.T., Davidson J.M., Gabdank I., Hilton J.A., Jain K., Baymuradov U.K., Narayanan A.K. et al.. The encyclopedia of DNA elements (ENCODE): data portal update. Nucleic Acids Res. 2018; 46:D794–D801. [DOI] [PMC free article] [PubMed] [Google Scholar]
- 53. Chadwick L.H. The NIH roadmap epigenomics program data resource. Epigenomics. 2012; 4:317–324. [DOI] [PMC free article] [PubMed] [Google Scholar]
Associated Data
This section collects any data citations, data availability statements, or supplementary materials included in this article.
Supplementary Materials
Data Availability Statement
The R package coMethDMR can be accessed at https://github.com/lissettegomez/coMethDMR. A user guide for coMethDMR which provides details of commands and output is included in Section 4 of Supplementary Text. The analysis scripts used in this study can be accessed at github at https://github.com/lissettegomez/coMethDMRPaper.
The Lunnon et al. Alzheimer's Disease dataset are available in the GEO data repository (accession numbers: GSE59685, GSE43414)


