Abstract
Objectives:
Laryngotracheal stenosis and obstruction can be challenging to manage. Traditional assessment tools are limited in clinical correlation. Three-dimensional computational fluid dynamics (CFD) modeling is a novel technique used to analyze airflow dynamics. The objective of this study was to apply CFD to the human upper airway to explore its utility.
Methods:
CFD models were constructed on an adult patient with an obstructive tracheal lesion before and after intervention and on an adult with normal airway anatomy, using computed tomographic imaging obtained retrospectively. Key airflow metrics were calculated.
Results:
CFD provided detailed airway geometry. The normal airway had a peak flow velocity of 3.12 m/s, wall shear stress of 0.30 Pa, and resistance of 0.02 Pa/mL/s. The pathologic patient showed an elevated peak flow velocity of 12.25 m/s, wall shear stress of 3.90 Pa, and resistance of 0.22 Pa/mL/s. This was reflected clinically with dyspnea, stridor, and obstructive impairment via pulmonary function testing. Following treatment, peak flow velocity corrected to 3.95 m/s, wall shear stress to 0.72Pa, and resistance to 0.01 Pa/mL/s. Cross-sectional area improved to 190 mm2 from a minimum of 53 mm2 at the same segment. Stridor and dyspnea resolved.
Conclusions:
CFD metrics were calculated on the normal, diseased, and posttreatment upper airway. Variations were reflected in clinical symptoms. These methods could model surgical outcomes and anticipate disease severity.
Keywords: CFD, computational fluid dynamics, laryngotracheal stenosis, subglottic stenosis, tracheal stenosis, virtual modeling
Introduction
The diagnosis and management of laryngotracheal stenosis (LTS) and obstruction are often complicated. Typically, comprehensive management is best achieved through a multidisciplinary approach involving otolaryngologists, pulmonologists, and thoracic surgeons.1 Current standard tools used to guide management, such as computed tomographic (CT) imaging, airway endoscopy, and Cotton-Myer grading, are inherently limited in quantifying functional compromise. Although useful, these tools are 2-dimensional, often limited in characterization, and unable to fully assess airflow changes through pathologic laryngotracheal segments. As such, disease assessment and decisions on treatment strategy are subjective and often variable among surgeons and institutions. This ambiguity can contribute to treatment failures and poor outcomes.2–6
Three-dimensional computational fluid dynamics (CFD) modeling is a computer engineering technique used to simulate and analyze airflow in specific conditions. By using Navier-Stokes equations (calculations of the physical properties of moving fluids), CFD allows the virtual modeling of airflow in certain situations. Importantly, the user can use CT or magnetic resonance images and model airflow through detailed anatomic boundaries. These calculations are specific and reproducible, and they provide key airflow metrics such as wall shear stress, peak flow velocity, air pressure drop, and airflow resistance.7–9
In recent years, CFD has had important and novel medical applications. Previously, these techniques have been used in cardiovascular medicine to understand blood flow and design devices such as vascular stents and valve pros-theses.10,11 CFD has also been used successfully to study airflow through the nose and sinuses, which has allowed the virtual modeling of airflow in rhinologic surgery. CFD techniques have the potential to improve our understanding of airway stenoses and obstruction and how their alteration in airflow contributes to clinical symptoms. By exploring these techniques, we might be able to virtually model certain surgical treatments to help us understand on whom to operate and how to approach their management. We provide the first case that quantifies the impact of tracheal pathology before and after surgery using CFD and compares alterations in airflow metrics with changes in clinical symptoms. The purpose of this study was to explore the use of CFD in obstructive laryngotracheal pathology by creating models of the normal, pretreatment, and posttreatment airway, comparing their key CFD metrics, and drawing parallels with clinical symptoms.
Methods
Approval was first obtained from the internal review board at The Ohio State University Medical Center in Columbus. For analysis, CFD modeling was performed on 1 adult with normal airway anatomy and on 1 adult with an obstructive tracheal mass both before and after surgical treatment. The normal control chosen for study was a female adult of similar size, weight, and age to our study patient, who had no known respiratory pathology and no clinical symptoms. CT imaging of the neck confirmed normal laryngeal and tracheal anatomy. In addition, we retrospectively reviewed the electronic medical record of The Ohio State University Medical Center and chose 1 patient for study with a known tracheal mass. We chose this pathology because it represented a well-defined, clinically significant lesion. This patient had undergone surgical treatment of her pathology and had documented clinical encounters, including CT scans of the neck both before and after surgical intervention. The CT scans of the normal subject and the pathologic patient before and after treatment were imported into our computer software and modeled using CFD. In addition, clinical markers were documented via chart review and trended with airflow metrics.
CFD Modeling
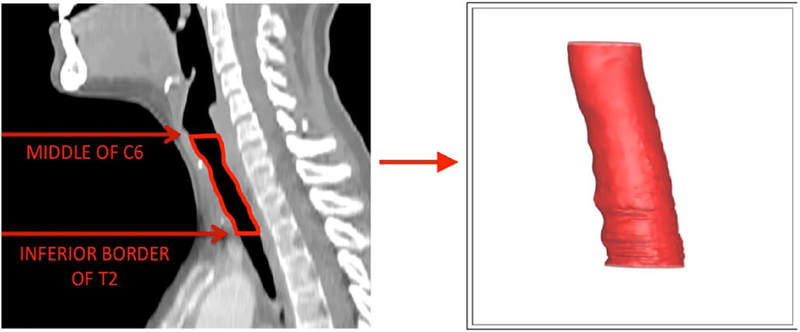
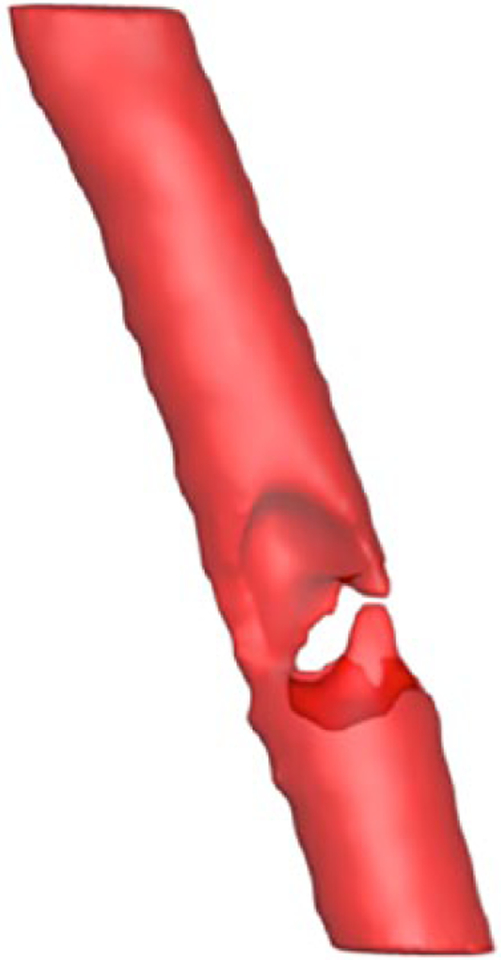
The 3 CFD models were created using the same steps and parameters. First, each CT scan was loaded into the 3-dimensional data visualization software AMIRA (Visualization Sciences Group, Hillsboro, OR, USA), which allowed the construction of 3-dimensional models on the basis of the 2-dimensional images from 3 planes (axial, coronal, and sagittal). The inner geometry of the larynx and trachea from approximately the mid-C6 vertebra to the inferior border of the T2 vertebra was extracted for our models (Figures 1 and 2). This segment was chosen to capture the larynx and upper trachea, including the segment with the mass and surrounding segments of normal trachea.
Figure 1.
Three-dimensional modeled geometry of the laryngotracheal airway extracted from our sample subject with normal airway anatomy. The red line outlines the extracted area of the larynx and trachea used for computational fluid dynamics modeling.
Figure 2.
Three-dimensional modeled geometry of the laryngotracheal airway extracted from our patient with an obstructive tracheal mass before intervention. The constricted airway clearly delineated within the trachea.
Once created, the 3-dimensional models were smoothed to remove rough exterior edges in the software. Then, the models were exported as a stereolithographic file and loaded into ICEM CFD 16.2 (Ansys, Inc., Canonsburg, PA, USA). The geometry was then segmented to separate the inlet, outlet, and body of the tracheal airway to later ascribe separate properties to each section. The geometry was meshed with between 200 000 and 500 000 tetrahedral elements to allow further fluid dynamic testing.
The mesh was then transferred to another software program, ANSYS Fluent 16.2 (Ansys, Inc.). In Fluent, different boundary conditions were applied. The inlet was given a mass flow rate of 0.000245 kg/s normal to the boundary to simulate restful breathing (equivalent to 200 mL/s or 12 L/min). The movement of air through the trachea was modeled using a standard k-omega turbulence model with low-Re corrections. The walls were made stationary and were applied a no-slip boundary condition. Simulations were then run with 2000 iterations under these conditions, calculating both laminar flow and turbulence.
The results of these simulations were then postprocessed and analyzed in Tecplot 360 (Tecplot, Inc., Bellevue, WA, USA). For path-line simulation, approximately 60 seeds were placed at the inlet. The velocity in the geometry was traced throughout the larynx and trachea to determine peak flow velocity (the maximal flow of air past the stenotic site, reported in milliliters per second). Wall shear stress (forces parallel to the airway wall surface, reported in pascals) was calculated and modeled to show the stress distribution throughout the wall of the trachea. Calculations also supplied the airflow resistance (the pressure used by the stenotic site on the incoming airflow, reported in pascals per milliliter per second) and air pressure drop (the difference in total air pressure, reported in pascals) through the laryngeal/tracheal segment. Cross-sectional area (reported in square millimeters) was calculated throughout the airway geometry. Of note, it averaged 10 hours of working time to perform each model.
Results
Patient #1: Study Patient With an Obstructive Tracheal Mass
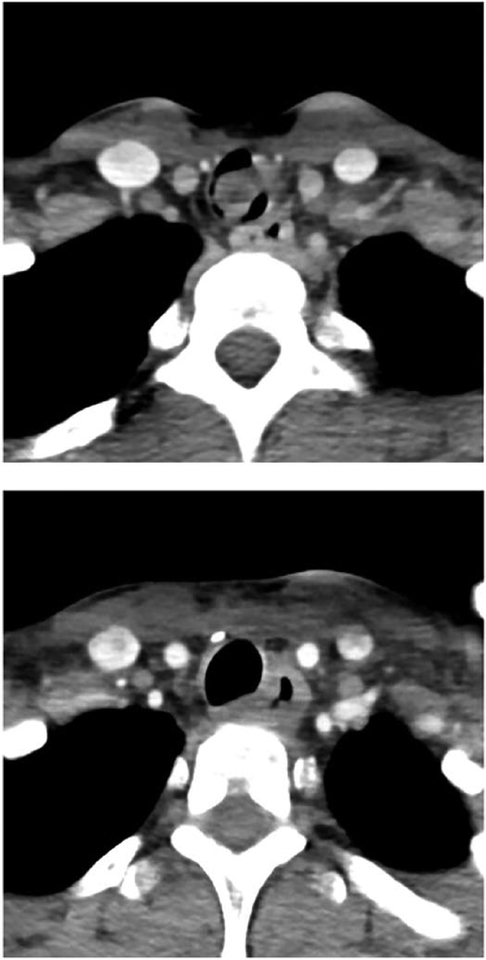
Patient #1 was a 31-year-old woman who originally presented to our institution for new-onset shortness of breath and hemoptysis. She experienced dyspnea with mild exertion and on examination was noted to have intermittent and mild inspiratory stridor. She underwent pulmonary function testing, which showed moderate obstruction (forced expiratory volume in 1 second/forced vital capacity = 64%) and flattening of both her inspiratory and expiratory flow loops. In addition, her expiratory disproportion index, which is the ratio of forced expiratory volume in 1 second to the peak expiratory flow rate, was elevated to 0.84. An expiratory disproportion index > 0.5 has previously been shown to be consistent with LTS versus other respiratory diagnoses.12 Further workup, including flexible fiber-optic tracheobronchoscopy and CT imaging of the neck with contrast revealed approximately 80% obstruction of the trachea by a 1.2 × 2 × 1.4 cm pedunculated, fixed lesion extending from approximately the fourth through the seventh tracheal rings (Figure 3). Four days later, she was taken to the operating room for direct microlaryngoscopy, bronchoscopy, and Nd:YAG laser debulking of the mass. She then underwent tracheal resection and reanastamosis of the area for definitive oncologic treatment. On postoperative follow-up, her shortness of breath and stridor were resolved. Flexible fiber-optic tracheobronchoscopy revealed patency of the trachea. She underwent a CT scan of the neck in the immediate postoperative period. Surgical pathology of the mass ultimately revealed high-grade, solid variant adenoid cystic carcinoma.
Figure 3.
The top figure shows an axial computed tomographic (CT) scan of the neck with contrast performed on patient #1 prior to surgical treatment. The bottom figure is an axial CT scan with contrast of patient #1 showing improved tracheal patency after surgical treatment.
CFD Results and Clinical Correlation
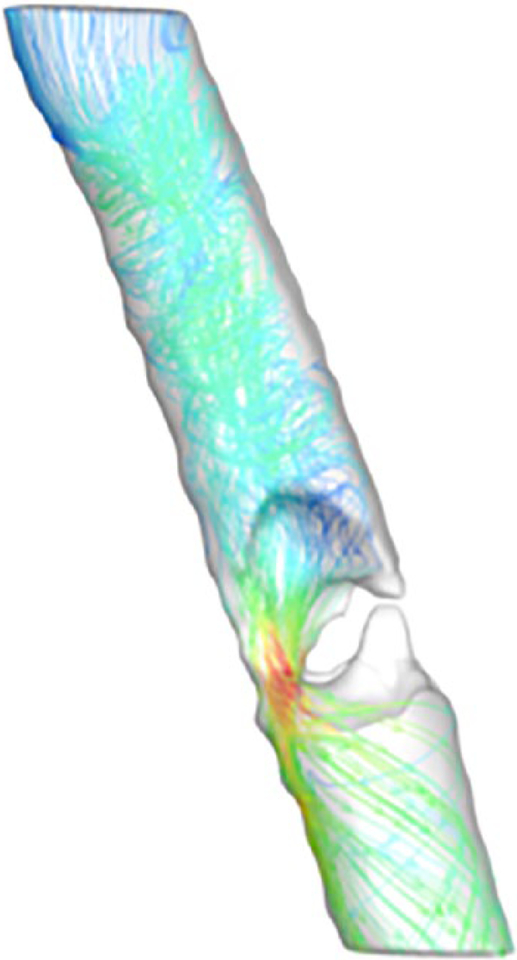
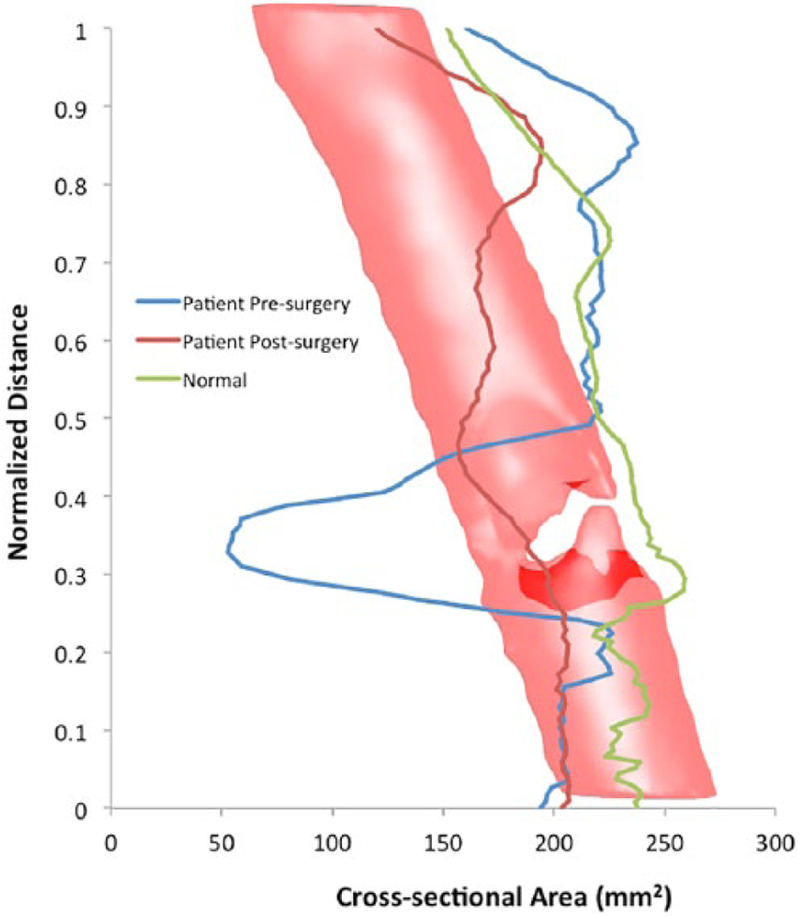
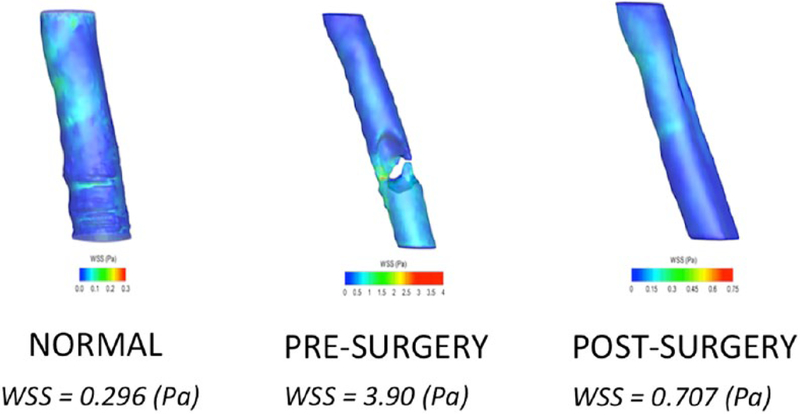
CFD modeling provided detailed airway geometry and individual airflow metrics in our measured segment (mid-C6 to inferior T2 vertebrae). The normal airway had a peak flow velocity of 3.11 m/s, wall shear stress of 0.30 Pa, air pressure drop of 3.83 Pa, and resistance of 0.02 Pa/mL/s. Before surgery, the obstructed airway had a minimal cross-sectional area of approximately 53 mm2 at the stenotic site, compared with about 245 mm2 in the normal airway at the same tracheal segment. Additional calculations revealed an elevated peak flow velocity of 12.25 m/s, wall shear stress of 3.90 Pa, air pressure drop of 43.73 Pa, and resistance of 0.22 Pa/mL/s. As noted previously, this was reflected clinically with stridor and symptoms of exertional dyspnea. Figure 4 demonstrates CFD modeling of peak flow velocity in the pathologic airway, which significantly increases through the narrowed segment (shown in red). Following laser excision, peak flow velocity corrected to 3.95 m/s, wall shear stress to 0.71 Pa, air pressure drop to 2.21 Pa, and resistance to 0.01 Pa/mL/s. Cross-sectional area increased to approximately 190 mm2 at the same tracheal segment (Figure 5). Correspondingly, stridor and dyspnea resolved. Figure 6 shows an example of the calculation of wall shear stress on the normal, presurgery, and postsurgery models.
Figure 4.
Completed peak flow velocity computational fluid dynamics model calculated from our pathologic patient before treatment. Blue signifies low peak flow velocity in the model, which scales to red, signifying high peak flow velocity.
Figure 5.
This chart plots the cross-sectional area throughout the airways of the normal patient (green line), diseased patient presurgical treatment (blue line), and diseased patient postsurgical treatment (red line). The vertical axis represents the normalized airway distance from the distal end of the measured segment. The horizontal axis charts the cross-sectional area in square millimeters. The superimposed tracheal model (with constriction) allows the correlation of the data with airway geometry. At the site of narrowing, there is significant improvement in cross-sectional area after treatment.
Figure 6.
Examples of computational fluid dynamics models of wall shear stress (WSS) created from the computed tomographic scans of our normal airway subject as well as our patient with an obstructive tracheal mass before and after intervention. Blue signifies low wall shear stress in the models, which scales to red, signifying high wall shear stress. As displayed in the figure, the normal airway and the postsurgery airway are similar in pascals. The wall shear stress is significantly elevated in our presurgery patient. Following surgery, the WSS is similar to that of the normal airway.
Discussion
CFD presents a novel method of evaluating airflow with exciting potential applications in medicine and surgery. Recent innovations have used CFD to examine nasal airflow in ways that allow increased symptom correlation, which is often not true of traditional assessment tools such as CT imaging and acoustic rhinometry.13 Studies by Zhao et al8,14 have modeled sinonasal airflow and examined changes and trends in CFD metrics in certain clinical situations, such as following septoplasty, middle turbinate resection, and inferior turbinate reduction. To demonstrate CFD’s potential as a surgical planning tool, they studied a patient before and after middle turbinate resection who had persistent nasal symptoms. Through CFD they found that the overall airflow distribution did not significantly change; thus, CFD provided unique insight into this treatment failure.
The concept of CFD as a preoperative planning tool in the laryngeal/tracheal airway has been explored in recent years. Zdanski et al15 performed CFD on children with subglottic stenosis and correlated airflow metrics with clinical data. One key CFD metric, the percentage relative reduction of the hydraulic diameter of the subglottic airway, was statistically significant in determining which patients underwent surgical intervention. This introduces the possibility of generating objective parameters of CFD metrics to help guide treatment. In another study, Cheng et al16 examined inspiratory airflow and resistance in LTS using CFD. Their modeling demonstrated increases in resistance and decreases in airflow in this disease. They also showed that of the different subtypes of LTS, subglottic stenosis had the greatest variability in resistance, while glottic stenosis had the greatest overall resistance. These studies clearly exemplify the unique potential of CFD as a clinical assessment tool.
Certainly, CFD holds capabilities distinct from traditional airway diagnostic tools such as endotracheal tube approximation and the Cotton-Myer grading system. This is supported by our previous study that applied CFD to tissue-engineered tracheal grafts implanted in sheep with complex stenoses.9 CFD models were constructed from these grafts, and the resulting airflow metrics were linearly correlated with a quantitative respiratory symptom scale. In this study, wall shear stress and peak flow velocity had a strong positive linear correlation with respiratory distress, whereas minimal airway luminal diameter correlated poorly with respiratory distress.
Our study demonstrates the feasibility of using CFD to examine airflow parameters through the laryngotracheal airway with an obstructive lesion before and after surgery. There were significant decreases toward near normal values in each of our calculated CFD metrics (wall shear stress, peak flow velocity, air pressure drop, and resistance) after surgical treatment of the obstruction. The tracheal cross-sectional area was also significantly improved. These metrics correlated with clinical improvement as well, with resolution of the patient’s stridor and dyspnea.
It should be noted that these models are time sensitive and required 6 to 15 hours to create, depending on the quality of the CT scans. Fortunately, modelers with an undergraduate level of experience in computer engineering were able to effectively perform these steps and calculations. Increased experience also results in improved speed and efficiency. Additionally, we acknowledge that the broader clinical utility of CFD modeling lies in management of airway stenosis rather than tracheal malignancy, given both the rarity and more straightforward management of the latter. We chose the tracheal tumor as a starting point because it was a well-defined lesion with clear effects on airflow that allowed us to study alterations in airway architecture similar to those of airway stenoses.
To our knowledge, this is the first study to use CFD modeling to trend the improvement in airflow metrics toward normal values with objective markers of treatment success following surgical intervention (improved patency on postoperative tracheobronchoscopy and CT imaging, along with resolution of stridor and dyspnea). There is potential to find significant relationships among CFD metrics, disease severity, and treatment outcomes that are not afforded by traditional clinical assessment tools. We envision usefulness in patients with symptoms or signs not well explained by their pulmonary function tests or imaging alone, in more complex airway stenoses, and in borderline stenoses in which management decisions are less straightforward. We must emphasize, however, that this was a proof-of-concept study. Currently we lack data on the relationship between functional data and CFD modeling. We also have yet to define parameters to assist with clinical management. These are crucial goals to meet before considering CFD for clinical use. However, despite these limitations, this study lays the foundation for future work to explore a new instrument to objectively quantify the physiology of airway pathology such as stenoses and obstructive lesions.
Future directions will include increases to our sample sizes and attempts to define normative vales in the laryngotracheal airway. We will further work toward matching CFD metrics with clinical markers. Established functional testing such as pulmonary function tests will be correlated with CFD to validate these models. Additionally, we aim to examine CFD before and after certain interventions to note relationships between airflow changes and treatment success. With continued exploration of these innovative concepts, CFD may eventually become a vital tool in the airway surgeon’s repertoire.
Conclusions
CFD is a feasible method of measuring airflow metrics in the normal and narrowed laryngotracheal airway. Significant differences in CFD metrics are observed between the two, and the abnormal values associated with obstructive pathology can correct back to near-normal levels following surgical intervention. Clinical symptoms correlate with alterations in CFD metrics, which could hold important insight into disease severity and treatment response. Medical comorbidities, such as concurrent cardiopulmonary disease and genetic syndromes, often confound the diagnosis and management of laryngotracheal pathology, and CFD could serve as an additional tool for medical decision making. With improved understanding, we could potentially use CFD before treatment to assist with patient selection and work toward optimizing our approach to the pathologic airway.
Funding
The author(s) disclosed receipt of the following financial support for the research, authorship, and/or publication of this article: Part of the funding source for this study was National Institute on Deafness and Other Communication Disorders (Grant R01 DC013626) awarded to Kai Zhao.
Footnotes
Declaration of Conflicting Interests
The author(s) declared no potential conflicts of interest with respect to the research, authorship, and/or publication of this article.
References
- 1.Maresh A, Preciado DA, O’Connell AP, Zalzal GH. A comparative analysis of open surgery vs endoscopic balloon dilation for pediatric subglottic stenosis. JAMA Otolaryngol Head Neck Surg. 2014;140(10):901–905. [DOI] [PubMed] [Google Scholar]
- 2.Rosow DE, Barbarite E. Review of adult laryngotracheal stenosis: pathogenesis, management, and outcomes. Curr Opin Otolaryngol Head Neck Surg. 2016;24(6):489–493. [DOI] [PubMed] [Google Scholar]
- 3.Menapace DC, Modest MC, Ekbom DC, Moore EJ, Edell ES, Kasperbauer JL. Idiopathic subglottic stenosis: long-term outcomes of open surgical techniques. Otolaryngol Head Neck Surg. 2017;156(5):906–911. [DOI] [PubMed] [Google Scholar]
- 4.Nair S, Nilakantan A, Sood A, Gupta A, Gupta A. Challenges in the management of laryngeal stenosis. Indian J Otolaryngol Head Neck Surg. 2016;68(3):294–299. [DOI] [PMC free article] [PubMed] [Google Scholar]
- 5.Swain SK, Sahu MC, Mohanty S, Samal R, Baisakh MR. Management of LTS–Still remains a challenge for successful outcome. Apollo Med. 2016;13(2):102–107. [Google Scholar]
- 6.George M, Jaquet Y, Ikonomidis C, Monnier P. Management of severe pediatric subglottic stenosis with glottic involvement. J Thorac Cardiovasc Surg. 2010;139(2):411–417. [DOI] [PubMed] [Google Scholar]
- 7.Subramaniam RP, Richardson RB, Morgan KT, Kimbell JS, Guilmette RA. CFD simulations of inspiratory airflow in the human nose and nasopharynx. Inhalat Toxicol. 1998;10(2): 91–120. [Google Scholar]
- 8.Zhao K, Malhotra P, Rosen D, Dalton P, Pribitkin EA. CFD as surgical planning tool: a pilot study on middle turbinate resection. Anat Rec (Hoboken). 2014;297(11): 2187–2195. [DOI] [PMC free article] [PubMed] [Google Scholar]
- 9.King N, Pepper V, Best C, et al. A pilot study: using computational fluid dynamics to model physiologic airflow through an ovine tissue engineered tracheal graft. J Clin Transl Sci. 2018;1(S1):65. [Google Scholar]
- 10.Morris PD, Narracott A, von Tengg-Kobligk H, et al. CFD modelling in cardiovascular medicine. Heart. 2016;102(1):18–28. [DOI] [PMC free article] [PubMed] [Google Scholar]
- 11.Matsuura K, Jin WW, Liu H, Matsumiya G. CFD study of the end-side and sequential coronary artery bypass anastomoses in a native coronary occlusion model. Interact Cardiovasc Thorac Surg. 2018;26(4):583–589. [DOI] [PubMed] [Google Scholar]
- 12.Nouraei SA, Nouraei SM, Patel A, et al. Diagnosis of laryngotracheal stenosis from routine pulmonary physiology using the expiratory disproportion index. Laryngoscope. 2013;123(12): 3099–3104. [DOI] [PubMed] [Google Scholar]
- 13.Garcia GJM, Hariri BM, Patel RG, Rhee JS. The relationship between nasal resistance to airflow and the airspace minimal cross-sectional area. J Biomech. 2016;49(9):1670–1678. [DOI] [PMC free article] [PubMed] [Google Scholar]
- 14.Zhao K, Jiang J, Pribitkin EA, et al. Conductive olfactory losses in chronic rhinosinusitis? A CFD study of 29 patients. Int Forum Allergy Rhinol. 2014;4(4):298–308. [DOI] [PMC free article] [PubMed] [Google Scholar]
- 15.Zdanski C, Davis S, Hong Y, et al. Quantitative assessment of the upper airway in infants and children with subglottic stenosis. Laryngoscope. 2016;126(5):1225–1231. [DOI] [PMC free article] [PubMed] [Google Scholar]
- 16.Cheng T, Carpenter D, Cohen S, Witsell D, Frank-Ito DO. Investigating the effects of laryngopharyngeal stenosis on upper airway aerodynamics. Laryngoscope. 2018;128(4):E141–E149. [DOI] [PMC free article] [PubMed] [Google Scholar]


