Abstract
Non-infections uveitis in humans is an autoimmune disease of the retina and uvea that can be blinding if untreated. Its laboratory equivalent is experimental autoimmune uveitis (EAU) induced in susceptible rodents by immunization with retinal antigens and described elsewhere in this series (Agarwal et al., Methods Mol Biol, 900:443–469, 2012). Evaluation and quantitation of the disease is usually performed by fundus examination and/or histopathology, which provide limited information on structural and no information on functional changes as disease progresses. Here, we describe methods for systematic evaluation of disease using noninvasive clinical assessments by fundus examination and photography, optical coherence tomography, and functional evaluation by electroretinography, which are then compared to histopathology. Using these methodologies, we demonstrate that clinical variants of disease can be accurately evaluated both clinically and functionally, facilitating longitudinal follow-up and providing information that cannot be obtained by fundoscopy and histology alone. These methodologies can be useful to obtain additional information and to evaluate effects of therapeutic modalities under investigation.
Keywords: Uveitis, EAU, Autoimmunity, T cells, Tolerance, IRBP, S-Ag, Mouse, Optical coherence tomography, Fundoscopy, Histology, Electroretinography
1. Introduction
The eye is known as an immunologically privileged organ. Immune privilege protects the delicate ocular structures from damage resulting from exposure to environmental inflammatory insults [1]. Research into the nature of immune privilege has revealed its highly complex character, which is still not fully understood and continues to be studied. Multiple mechanisms are involved: (1) physical barriers: an efficient blood-retinal barrier and lack of efferent lymphatics prevent free movement of cells and even larger molecules into and out of the globe [1]; (2) the expression of immunosuppressive factors in ocular fluids and on ocular resident cells can be inhibitory to activation and function of inflammatory leukocytes and can promote induction of T regulatory cells in the ocular microenvironment [2–6]; (3) induction of regulatory immunity to retinal antigens at the systemic levels, including the phenomenon known as anterior chamber immune deviation (ACAID) and post-recover tolerance [3, 7, 8]. However, separation from the immune system also impedes efficient induction of peripheral tolerance to eye-specific antigens. In addition, we recently found that retina-specific cells activated outside the eye are relatively resistant to the inhibitory effects of the ocular microenvironment, which may help to explain why, despite immune privilege, the eye is subject to destructive autoimmunity manifesting as uveitis [5, 6, 9].
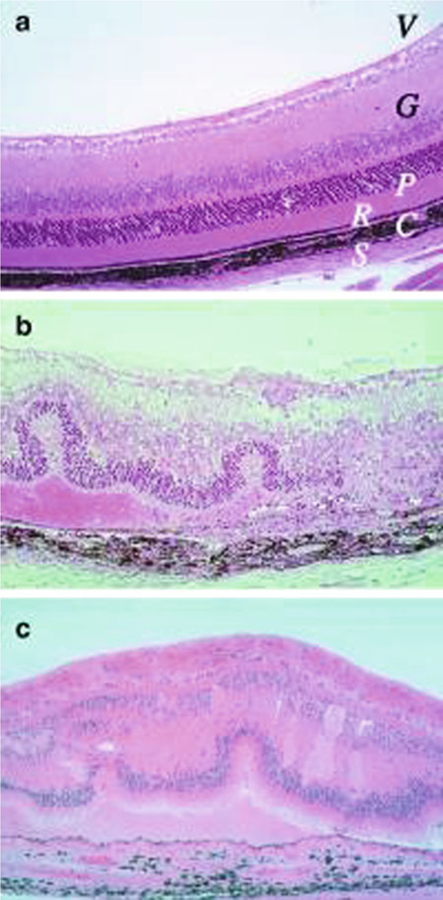
Uveitis is a group of potentially blinding inflammatory diseases that result in the destruction of the light-sensitive photoreceptor cells of the retina [10]. Patients have responses to unique retinal antigens, and these responses are felt to be involved in driving their disease. To better understand disease mechanisms, animal models of uveitis have been developed (reviewed in ref. 11). The model of experimental autoimmune uveitis (EAU) has been described in an earlier issue of this series [12]. The murine model of EAU has been particularly useful, permitting to dissect basic mechanisms as well as serving as a template for translational therapies. The B10.RIII mouse strain is the most susceptible strain known. Briefly, disease is induced in these mice by immunization with IRBP or its peptides in the absence of pertussis toxin, of which the most frequently used is IRBP161–180, sequence SGIPYIISYLHPGNTILHVD [12]. Less than 10 μg of this peptide induces severe uveitis in B10.RIII mice. The typical histological appearance of EAU resembles that of human uveitis, with inflammatory infiltrates in the vitreous, retina, and choroid and damage to the photoreceptor cell layer (Fig. 1).
Fig. 1.
Histopathology of mouse EAU compared with human uveitis. Eyes were collected from B10.RIII mice before (a) and 21 days after uveitogenic immunization with IRBP (b). Note disorganized retinal architecture and damage to ganglion and photoreceptor cell layers, retinal folds, subretinal hemorrhage, vasculitis, focal damage to the retinal pigment epithelium, and choroiditis. Uveitis in the patient with ocular sarcoidosis (c). Note gross similarity in pathological picture between b and c (Photographs provided by Dr. Chi-Chao Chan, Laboratory of Immunology, National Eye Institute) (Reprinted from ref. 9)
To better use the EAU model for clinical studies, an accurate and convenient method of longitudinal evaluation is needed which must, moreover, be noninvasive, so as not to affect disease development and progression. The approaches routinely used in most laboratories consist of clinical scoring by standard fundoscopy and digital fundus imaging, with occasional confirmation by histopathology. Although fundus examination provides an in vivo way to clinically assess the disease severity, the information obtained is incomplete as to cellular infiltrates in the vitreous cavity, retinal thickness, the anatomic location of the lesions in the retina, which are all important quantitative indicators of disease severity, and gives no information on visual function. In addition, comparison of results from different laboratories can be difficult, since clinical grading is subjective and scoring criteria can vary among research groups. To close these gaps, we describe here additional methods that can be used to document and evaluate and quantitate clinical disease using objective measurements.
Optical coherence tomography (OCT) is a relatively new method of biomedical optical imaging. It performs micrometer-resolution, three-dimensional imaging of microstructure in biological systems by measuring backscattered light. Image resolutions of OCT achieve higher magnitude than conventional ultrasound. The use of relatively long wavelength light allows it to penetrate into the scattering medium deeper than confocal microscope [13]. OCT provide images of tissue in situ and in real time, without the need for excision and processing of specimens. The unique features of this technology enable a broad range of research and clinical applications. Up to now, OCT has been useful for serial observation of different retinal diseases in patients, e.g., age-related macular degeneration, glaucoma, posterior uveitis, and birdshot chorioretinopathy [14–21]. Our previous studies in the mouse model of EAU have indicated that OCT has distinct advantages for clinical evaluation of disease in comparison with conventional fundus examination [14] (see Notes 1–6). First, OCT is more sensitive in its ability to detect subtle changes (such as initiation of cellular infiltration from the optic nerve cup) during the onset of disease. Second, it is able to accurately measure retinal thickness, thus adding a valuable dimension to assessments of disease activity and retinal function. Third, it can discern retinal lesions. The cross-sectional images almost resemble histological images and assist in the diagnosis of posterior segment pathology at various time points [22, 23].
Electroretinography (ERG) is a well-accepted technology for measuring the electrical responses of various cell types in the retina. It is composed of electrical potentials contributed by different cell types within the retina according to the stimulus conditions, such as flash or pattern stimulus, the colors of the stimulus and background. During a recording, the eyes are exposed to standardized stimuli and the resulting signal is displayed showing the time course of the signal’s amplitude (voltage). Sufficiently bright flashes will elicit ERGs containing an a-wave (initial negative deflection) followed by a b-wave (subsequent positive deflection). Scotopic (dark-adapted) and photopic (light-adapted) ERGs reflect retinal cell activities of different signal pathways. The dark-adapted response of ERG is primarily from the rod system, and ERGs performed on a light adapted eye reflect the activity of the cone system. Clinically, ERG is widely used by ophthalmologists for the diagnosis of various retinal diseases [24, 25].
2. Materials
2.1. Mice and Immunization for EAU
6–8 weeks old B10.RIII mice (Jackson Laboratories, Bar Harbor, ME).
Emulsion of human IRBP161–180 peptides in complete Freund’s adjuvant (CFA; 1:1 v/v) (Difco, Detroit, MI) by sonication to provide 6–20 μg peptide in 0.2 ml emulsion per mouse.
EAU is induced in B10.RIII mice by subcutaneous injection of IRBP161–180 peptides emulsified in CFA (Sigma, St. Louis, MO) as described in detail in another chapter in this series [12].
2.2. Anesthetics
Ketamine-Xylazine mixture (100 mg/kg body weight ketamine; 10 mg/kg body weight xylazine; i.p.) for systemic anesthesia.
Hypodermic needles (29 G).
1 mL syringes.
0.5% Alcaine drops for local anesthesia.
Ophthalmic dilating solutions: 1% Tropicamide (Alcon Laboratories, Inc., Fort Worth, TX) and 0.5% phenylephrine hydrochloride (Bausch & Lomb).
2.3. Fundoscopy
An optics fundus microscope using epi-illumination (reflective) light sources.
Glass coverslip.
Artificial tears (Systane Ultra, Alcon).
2.4. Fundus Photography
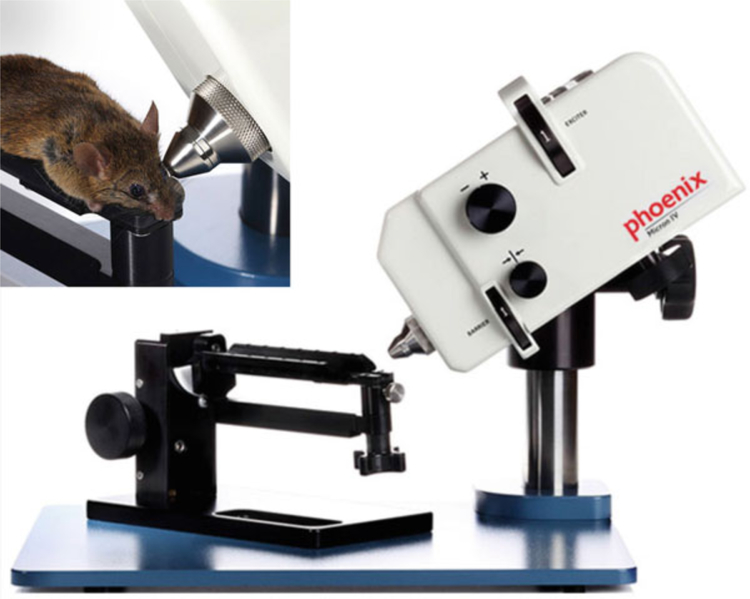
Micron II small animal in vivo retinal imaging system (Phoenix Research Laboratories, INC) (Fig. 2).
Phoenix StreamPix 5-Single Camera.
Phoenix StreamPix imaging program.
A host computer.
Rodent imaging table to adjust mouse posture for scanning.
Foot pad control.
Artificial tears (Systane Ultra, Alcon).
Fig. 2.
Phoenix Micron II small animal retinal imaging system (Phoenix Research Laboratories, Inc). The apparatus is comprised of a base system that incorporates a host computer as well as a Phoenix StreamPix 5-Single camera and rodent imaging holder. Photographs are reproduced from the website of www.kellogg.umich.edu with permission
2.5. Spectral Domain Optical Coherence Tomography (SD-OCT)
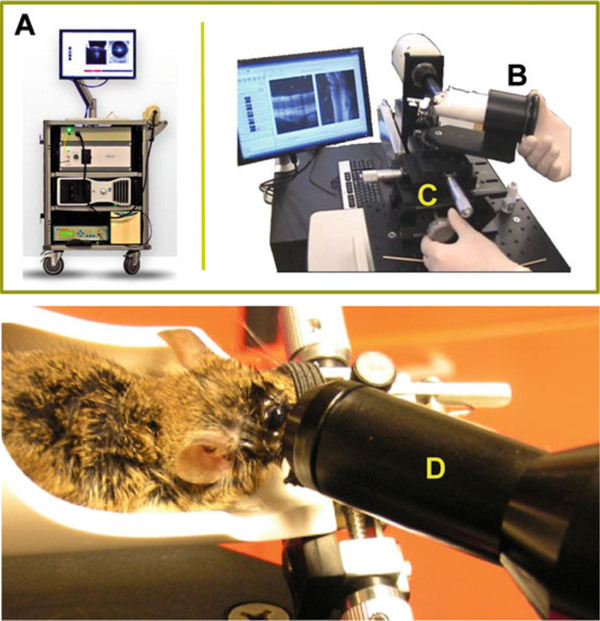
Bioptigen Spectral Domain Ophthalmic Imaging System (Bioptigen Envisu R2200, North Carolina) (Fig. 3).
A host computer system.
840 nm OCT engine with reference arm attachment.
SD-OCT probe (for cornea and retina).
Bioptigen InVivoVue Clinic software.
Bioptigen animal imaging mount.
Rodent alignment stage apparatus.
Aiming tip.
Cotton-tip applicator (Rush Dental & Medical Supply; Santa Monica, CA).
Surgical gauze pad (Allegro Medical).
Artificial tears.
Fig. 3.
Bioptigen Spectral Domain Ophthalmic Imaging System (Bioptigen, Inc., Durham, NC). The apparatus consists of a base system (A), an animal imaging mount (B), and rodent alignment stage (C), which houses a SD-OCT probe (D). The base system incorporates a host computer, 840 nm OCT engine with reference arm attachment, and the probe. The SD-OCT scanner is encased in the animal imaging mount, which allows forward and backward adjustment of the probe. The InVivoVue Clinic software enables the creation, display, loading, and saving of OCT image files. The rodent alignment system contains an X-(micrometer), Y- (scissor jack), and Z-translators along with stereotactic rotational cassette (for holding the mouse) within a bushing and platform base. The entire device is attached to a slit-lamp base. Photographs are reproduced from Bioptigen, Inc., with permission
2.6. Electroretinography (ERG)
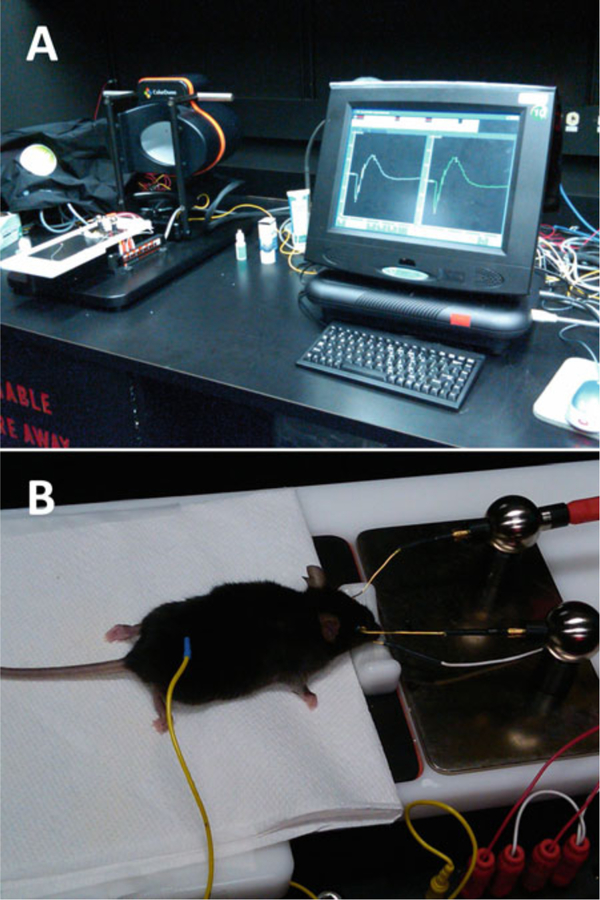
Espion E2 ERG system (Diagnosys LLC) (Fig. 4).
A mouse table with animal temperature control (Diagnosys LLC).
Touchscreen PC configurations.
Espion software for protocol design and data analysis.
ERG dome.
ERG-electrodes.
Cotton-tip applicator (Rush Dental & Medical Supply; Santa Monica, CA).
Surgical gauze pad (AllegroMedical).
Artificial tears.
Fig. 4.
Espion E2 ERG recording system (Diagnosys LLC). The device is composed of a base system that incorporates a touchscreen PC configuration as well as an ERG dome and mouse Table (A). Mouse is placed on an animal table and connected to electrodes for ERG recording (B)
2.7. Histology
4% glutaraldehyde in phosphate-buffered saline (PBS) (Fisher Scientific, Fair Lawn, NJ).
10% neutral-buffered formalin (Sigma-Aldrich).
Methacrylate embedding compound.
Hematoxylin and eosin stain.
3. Methods
3.1. Clinical Manifestation of EAU in Mouse Models of Uveitis as Revealed by Fundus Examination and OCT Imaging
3.1.1. Clinical Evaluation of EAU by Fundoscopy
This method consists of visual inspection of the fundus. The observer assigns disease scores according to the number, size, and type of lesions observed through a binocular microscope.
Anesthetize mouse and dilate the pupils as described in Subheading 2.
Use artificial tears throughout the procedure to maintain corneal moisture and clarity.
Press cornea of the eye gently with a glass coverslip and perform the fundus examination using a fundus microscope. Details of the fundoscopy procedure are described elsewhere in this series [12].
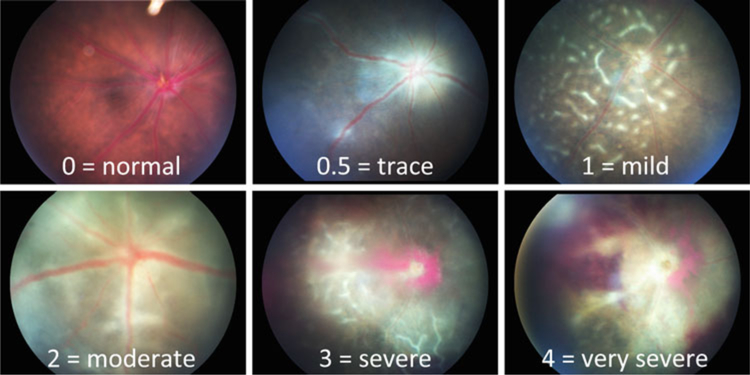
Score disease severity of EAU semi-quantitatively on a scale of 0–4, based on the type, number, and size of retinal lesions using the criteria described in Table 1 and depicted in Fig. 5.
Table 1.
Clinical scoring criteria of EAU
| Grade | Criteria for fundoscopy |
|---|---|
| 0 | Normal retina |
| 0.5/trace | Few (<3), small and focal lesions; minimal vasculitis and vitritis |
| 1 | Mild vasculitis; multiple, peripheral and focal lesions |
| 2 | Retinal edema; severe vasculitis (large size, thick wall, infiltrations); diffuse chorioretinal lesions and/or infiltrations; linear lesions |
| 3 | Retinal edema; pattern of linear lesions; large confluent chorioretinal lesions; subretinal hemorrhages |
| 4 | Large retinal detachment |
Fig. 5.
Fundus images of EAU in B10.RIII mice. Eyes were photographed with a Micron II fundus imaging system during the acute phase of disease (day 13–21), showing a range of disease severity scores that parallel the histology scores in Fig. 7
3.1.2. Clinical Evaluation of EAU by Fundus Photography
This method is a refinement of the visual inspection of the fundus, above. The appearance of the fundus is recorded photographically and serves as permanent experimental record (Fig. 5).
Anesthetize mouse using a ketamine/xylazine cocktail and dilate the pupils as described in Subheading 2.
Use artificial tears throughout the procedure to maintain corneal moisture and clarity.
Set up computer program.
Place mouse on an animal imaging table and position the eye toward camera lens to ensure the imaging is on the retina.
Visualize the retina through a digital camera during alignment, and obtain the image acquisition using the Micron II in vivo retinal imaging microscope (Phoenix Research Laboratories, INC).
3.1.3. SD-OCT Imaging for Evaluation of EAU
OCT provides visualization of lesions in the retina and choroid, as well as measurement of retinal edema (retinal thickness). These are important complements to photographic documentation of the retinal lesions.
Computer programing: set up reference arm as “1180” and SD-OCT probe for mouse retina.
Anesthetize mouse and dilate the pupils as described in Subheading 2.
Use artificial tears throughout the procedure to maintain corneal moisture and clarity.
Place mouse into an animal imaging mount, adjust the probe toward the eye.
Use the aiming tip, with cassette tongue, and aiming target for determining geometrical working distance for the optical lens bore to the mouse eye.
Use the rodent alignment system to position the eye to ensure that the incident OCT beam is perpendicular to the cornea of eye.
During alignment and centering, visualize the retina through a digital camera and obtain the image acquisition in line and rectangular scanning modes using the Bioptigen InVivoVue Clinic software that enables the creation, display, loading, and saving of OCT image files.
Analyze images of the retina using proprietary Bioptigen software.
Fundus examination detects two distinct patterns of EAU: monophasic and chronic (Fig. 6 and Note 7 [27]). Higher intensity immunization typically results in an acute form of disease with early onset post immunization (p.i.) and widespread photoreceptor damage, whereas lower intensity of immunization results in milder disease with prolonged and chronic inflammation [27, 28]. At the peak of disease (14 days p.i.), posterior uveitis (perivascular exudates, subretinal hemorrhage, and retinal folds) was associated with a transient severe anterior uveitis (including signs of an irregular pupil, deposition of fibrin, opacification of the anterior chamber, as well as hemorrhages). The subsequent disease progression pattern of individual animals depended on the severity of the initial acute phase of retinal inflammation, with mice that developed severe disease (scores >2) manifesting a monophasic course followed by a rapid resolution of active inflammation around week 3 and retinal thinning (atrophy) around 4–5 weeks p.i. In contrast, animals that developed milder scores (<2) continued to show low-grade disease lasting for 5–6 months until retinal atrophy set in (Fig. 6). Thus, together with visual fundus examination and fundus photography, OCT provides an additional parameter of clinical course of EAU by measuring retinal thickness from cross-sectional OCT images. Retinal thickness that reflects disease activity correlated well with the course of disease in monophasic and chronic forms of EAU. Direct comparison of retinal and choroidal lesions seen by visual and OCT fundus examination is described ahead and compared to histology.
Fig. 6.
Comparison of the clinical course and disease severity in monophasic vs. chronic EAU by fundus examination and OCT imaging. EAU was induced in B10.RIII mice by active immunization with IRBP161–180 in adjuvant. Left panel, disease scores of EAU at different stages of disease were evaluated using an adapted fundus microscope. Right panel, B-scan OCT of the retina was evaluated at the indicated time points using a Bioptigen SD-OCT imaging system. Retinal thickness was measured and averaged from OCT images of the retina (adapted from ref. 27) (See Note 7)
3.2. Anatomical Evaluation of EAU by Histopathology
Euthanize mice and confirm death by lack of heartbeat and respiration. Immediately enucleate and fix eyes, as post mortem deterioration of retinal tissue occurs rapidly. To enucleate, stretch the skin on the head by holding the ears so that the eyes bulge. Carefully pluck the eye out of its socket with a curved forceps.
Briefly, pre-fix enucleated globes in 4% glutaraldehyde (Fisher Scientific, Fair Lawn, NJ) for 1 h, then transfer to 10% neutral-buffered formalin (Sigma-Aldrich) for at least 12 h. Eyes can be kept in formalin for a long time.
The eyes are then dehydrated, embedded in methacrylate, sectioned through the pupillary-optic nerve axis, and stained with hematoxylin and eosin. Additional details on histology protocol are described elsewhere in this series [12].
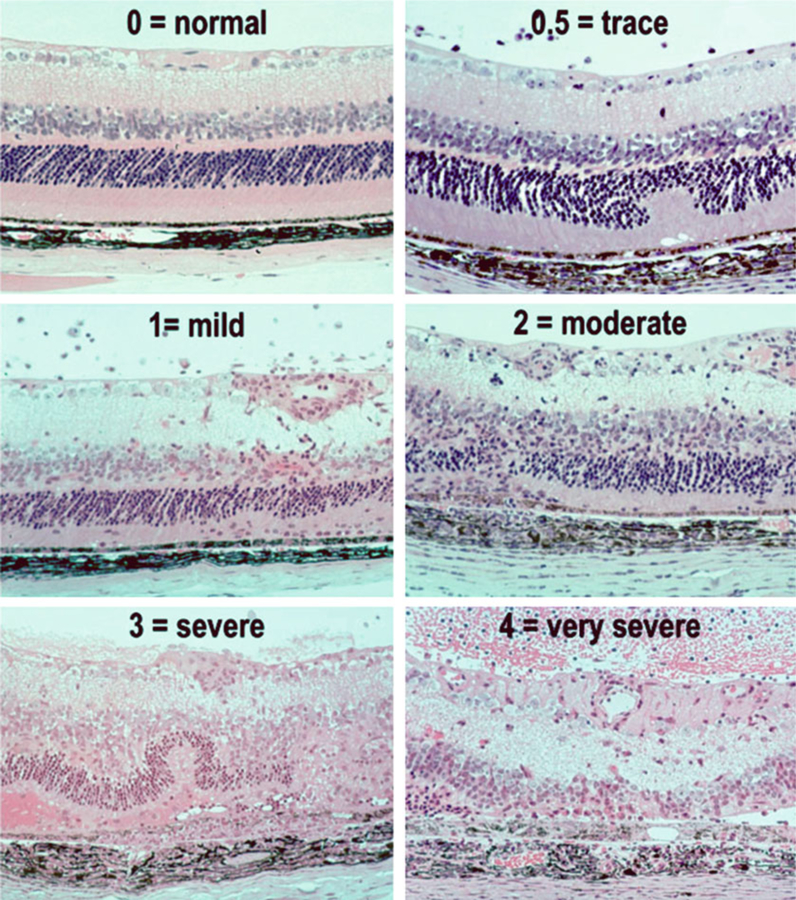
The histology score of EAU is evaluated in a masked fashion on a scale of 0–4 based on the number, type, and size of lesions using the criteria described in Fig. 7 and Table 2 [12].
Fig. 7.
Histopathology of EAU in the B10.RIII mouse. Eyes were collected from B10.RIII mice 21 days after uveitogenic immunization with IRBP, representing a range of disease scores (Figure is reprinted from ref. 26)
Table 2.
Histology scoring of EAU in the mouse
| Grade | Criteria for histopathology |
|---|---|
| 0 | Normal retina structure |
| 0.5/trace | Mild inflammatory cell infiltration. No tissue damage |
| 1 | Infiltration; retinal folds and focal retinal detachments; few small granulomas in choroid and retina, perivasculitis |
| 2 | Moderate infiltration; retinal folds, detachments and focal photoreceptor cell damage; small to medium sized granulomas, perivasculitis and vasculitis |
| 3 | Medium to heavy infiltration; extensive retinal folding with detachments, moderate photoreceptor cell damage; medium sized granulomatous lesions; subretinal neovascularization |
| 4 | Heavy infiltration; diffuse retinal detachment with serous exudate and subretinal bleeding; extensive photoreceptor cell damage; large granulomatous lesions; subretinal neovascularization |
3.3. Side-by-Side Comparison of the Various Methods of Clinical Disease Evaluation and Histological Disease Evaluation in the Same Eye
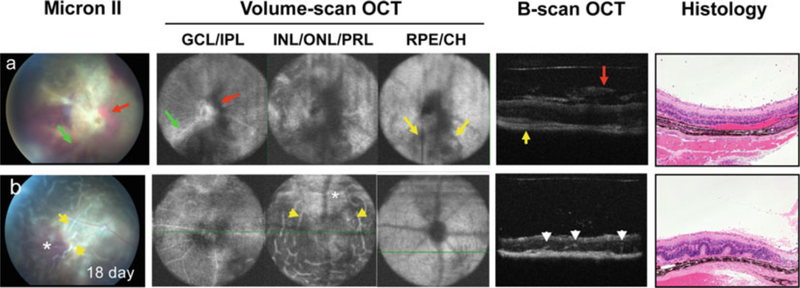
Eye pathology in mouse models of uveitis was evaluated using noninvasive fundus imaging and SD-OCT imaging systems in comparison with histopathology examination (Fig. 8). As we reported previously [14] (see Notes 1–6), OCT imaging is a noninvasive reliable tool to distinguish retinal pathology in 3D view. In keeping with the fundus images of the same eye in mouse developing severe monophasic form of EAU (day 18 p.i.), horizontal-sections of OCT volume scan images captured eye lesions in multiple layers of the retina. Engorged blood vessels and peri-vascular exudates (green arrow) were visualized in ganglion cell and inner plexiform layers. Severe vitreal and subretinal hemorrhages (red arrow, dark area) in ganglion cell/inner plexiform layer as well as in inner/outer nuclear and IS/OS of photoreceptor layer recapitulated the pattern seen in the fundus image. Inflammation (yellow arrow) was also noted in RPE and choroid layers. Cross-sections of OCT B-scan images were parallel to histopathological findings, resolved the vitreal hemorrhage (red arrow) and cellular infiltrates (green arrow) observed by fundus imaging in the retina, and choroiditis (yellow arrow). In mice that developed a chronic form of EAU, OCT visualize focal lesions of the retina. Disease is characterized by multi-focal retinal folding (yellow arrow) in inner/outer nuclear and IS/OS of photoreceptor layer with less damage to PRL as compared to monophasic EAU. Thus, OCT imaging provided additional information that correlated well with the fundus and histological evaluation of EAU.
Fig. 8.
Comparison of fundus photography, OCT, and histology for the evaluation of the acute/monophasic and the chronic forms of EAU. Retinal lesions were visualized using Micron-II fundus imaging and Bioptigen SD-OCT imaging systems, and followed by histological examination of (a) monophasic, and (b) chronic forms of EAU. Note all images are of the same eye. Note engorged blood vessels and peri-vascular exudates (green arrow) in ganglion cell layer (GCL) and inner plexiform layer (IPL), vitreal and subretinal hemorrhages (red arrow, dark area) visible in all retinal layers and corresponding to the same lesions in the fundus image and in OCT B-scan cross-sections and choroidal inflammation (yellow arrow) in retinal pigment epithelium (RPE) and choroid (CH) (Figure is modified from refs. 14, 27) (See Notes 1–7)
3.4. Electroretinography for Evaluation of Retinal Function
Unlike all the procedures described above, which deal with various morphological and anatomical aspects of lesions characteristic of EAU, electroretinography (ERG) provides an evaluation of visual function by quantitating the response of the retina to the light signal.
Keep mouse in a dark room overnight (>12 h) for dark adaptation.
After anesthesia with a ketamine/xylazine cocktail (100/10 mg/kg), place mouse on a mouse table with animal temperature control inside an ERG dome of Espion E2 System (Diagnosys LLC).
Place electrodes on the central cornea, and attach reference and ground electrodes to the mouth and subcutaneously in the posterior neck-back region.
Record the dark-adapted ERG followed by the light-adapted ERG using Espion E2 System (Diagnosys LLC). Measure amplitude of ERG waveforms at a series of flash intensities.
Perform all procedures under dim red light.
Retinal function of mice with the different forms of EAU was evaluated using an ERG recording system in the same mice (depicted in Fig. 9), in which retinal lesions were measured by OCT imaging and fundus examination. We followed both scotopic (dark-adapted) and photopic (light-adapted) ERG responses during the course of disease. Although scotopic and photopic ERGs reflect retinal cell activities of different signal pathways, representing rod- and cone-mediated visual signals, reduction of ERGs in response to either dark or light adaptation exhibited in a similar pattern during inflammation. However, the pattern of ERG reduction differed between the monophasic and chronic forms of EAU.
Fig. 9.
Kinetics of dark- and light-adapted ERG responses in mouse model of EAU. Mice were monitored and followed up at the indicative time points by ERG. Amplitude of dark- and light-adapted ERGs was recorded and analyzed (adapted from ref. 27) (See Note 7)
The a-wave is produced by the photoreceptors, while the b-wave is produced by a mixture of cells including photoreceptors, bipolar, amacrine, and Müller retinal glial cells. During EAU, a sharp decline in both b-wave and a-wave amplitudes is measured in mice in both dark- and light-adapted conditions during the peak of inflammation (14 days p.i.). However, in the chronic form of EAU, disease resolution is followed by partial recovery of retinal function with ERGs that last 5–6 months and followed by a decline when retinal degeneration occurs. The pattern of ERG reduction seen in the chronic forms of uveitis correlates well with the reduction of the retinal thickness obtained by OCT (depicted in Fig. 6). Thus, retinal thickness using noninvasive OCT imaging appears to predict the change of retinal function during the course of EAU.
4. Notes
Good anesthesia, which completely prevents ocular movements and breathing artifacts, is key for performing noninvasive assessment such as fundus imaging and OCT in animals. Systemic as well as local anesthesia must be used.
Systemic anesthesia by injection of a ketamine/xylazine cocktail leads to cataract formation in mice within 20 min. This should be sufficient time to perform imaging, however, Avertin, which does not lead to cataract formation, may be a better substitute if prolonged imaging is required.
Adequate dilation of the pupil is important to obtain good quality imaging (such as fundoscopy, fundus photography, and OCT imaging). Sufficient time should be allowed for dilation to at least 6 mm.
Artificial tears must be applied both to the cornea through the procedure of fundoscopy and fundus imaging. Mice do not close their eyes when anesthetized. Application of artificial tears prevents corneal dehydration and opacification of the cornea due to keratitis, which could compromise subsequent imaging sessions.
It is also important to keep a clear and undisturbed cornea for OCT imaging. Prior to OCT scanning, additional artificial tears should be wrapped off gently from surface of the cornea using cotton-tip applicator.
During the peak of uveitis (around day 14 p.i.), opacification of visual media occurs due to heavy proteinaceous exudation and cellular infiltration in the anterior and posterior segments of the eye. This interferes with the OCT signal and its ability to clearly resolve retinal layers. OCT therefore shares the limitation of fundus imaging during this phase of disease.
For ERG recording, electrodes placed in the center of the cornea are held in place and conductivity ensured by application of artificial gels. Gels should be washed off from electrodes after the imaging session.
References
- 1.Streilein JW (2003) Ocular immune privilege: the eye takes a dim but practical view of immunity and inflammation. J Leukoc Biol 74:179–185 [DOI] [PubMed] [Google Scholar]
- 2.Caspi RR, Roberge FG, Nussenblatt RB (1987) Organ-resident, nonlymphoid cells suppress proliferation of autoimmune T-helper lymphocytes. Science 237:1029–1032 [DOI] [PubMed] [Google Scholar]
- 3.Stein-Streilein J (2008) Immune regulation and the eye. Trends Immunol 29:548–554 [DOI] [PubMed] [Google Scholar]
- 4.Taylor AW (2007) Ocular immunosuppressive microenvironment. Chem Immunol Allergy 92:71–85 [DOI] [PubMed] [Google Scholar]
- 5.Zhou R, Horai R, Silver PB, Mattapallil MJ, Zarate-Blades CR, Chong WP, Chen J, Rigden RC, Villasmil R, Caspi RR (2012) The living eye “disarms” uncommitted autoreactive T cells by converting them to Foxp3(+) regulatory cells following local antigen recognition. J Immunol 188:1742–1750 [DOI] [PMC free article] [PubMed] [Google Scholar]
- 6.Zhou R, Horai R, Mattapallil MJ, Caspi RR (2011) A new look at immune privilege of the eye: dual role for the vision-related molecule retinoic acid. J Immunol 187:4170–4177 [DOI] [PMC free article] [PubMed] [Google Scholar]
- 7.Stein-Streilein J, Streilein JW (2002) Anterior chamber associated immune deviation (ACAID): regulation, biological relevance, and implications for therapy. Int Rev Immunol 21:123–152 [DOI] [PubMed] [Google Scholar]
- 8.Kitaichi N, Namba K, Taylor AW (2005) Inducible immune regulation following auto-immune disease in the immune-privileged eye. J Leukoc Biol 77:496–502 [DOI] [PMC free article] [PubMed] [Google Scholar]
- 9.Caspi RR (2006) Ocular autoimmunity: the price of privilege? Immunol Rev 213:23–35 [DOI] [PubMed] [Google Scholar]
- 10.Nussenblatt Rb WS (2004) Uveitis: fundamentals and clinical practice. Mosby (Elsevier), Philadelphia, PA [Google Scholar]
- 11.Caspi RR (2010) A look at autoimmunity and inflammation in the eye. J Clin Invest 120:3073–3083 [DOI] [PMC free article] [PubMed] [Google Scholar]
- 12.Agarwal RK, Silver PB, Caspi RR (2012) Rodent models of experimental autoimmune uveitis. Methods Mol Biol 900:443–469 [DOI] [PMC free article] [PubMed] [Google Scholar]
- 13.Fujimoto JG (2003) Optical coherence tomography for ultrahigh resolution in vivo imaging. Nat Biotechnol 21:1361–1367 [DOI] [PubMed] [Google Scholar]
- 14.Chen J, Qian H, Horai R, Chan CC, Caspi RR (2013) Use of optical coherence tomography and electroretinography to evaluate retinal pathology in a mouse model of autoimmune uveitis. PLoS One 8:e63904. [DOI] [PMC free article] [PubMed] [Google Scholar]
- 15.Huang D, Swanson EA, Lin CP, Schuman JS, Stinson WG, Chang W, Hee MR, Flotte T, Gregory K, Puliafito CA, Et A (1991) Optical coherence tomography. Science 254:1178–1181 [DOI] [PMC free article] [PubMed] [Google Scholar]
- 16.Toth CA, Narayan DG, Boppart SA, Hee MR, Fujimoto JG, Birngruber R, Cain CP, Dicarlo CD, Roach WP (1997) A comparison of retinal morphology viewed by optical coherence tomography and by light microscopy. Arch Ophthalmol 115:1425–1428 [DOI] [PubMed] [Google Scholar]
- 17.Drexler W, Morgner U, Ghanta RK, Kartner FX, Schuman JS, Fujimoto JG (2001) Ultrahigh-resolution ophthalmic optical coherence tomography. Nat Med 7:502–507 [DOI] [PMC free article] [PubMed] [Google Scholar]
- 18.Gallagher MJ, Yilmaz T, Cervantes-Castaneda RA, Foster CS (2007) The characteristic features of optical coherence tomography in posterior uveitis. Br J Ophthalmol 91:1680–1685 [DOI] [PMC free article] [PubMed] [Google Scholar]
- 19.Markomichelakis NN, Halkiadakis I, Pantelia E, Peponis V, Patelis A, Theodossiadis P, Theodossiadis G (2004) Patterns of macular edema in patients with uveitis: qualitative and quantitative assessment using optical coherence tomography. Ophthalmology 111:946–953 [DOI] [PubMed] [Google Scholar]
- 20.Van Velthoven ME, Ongkosuwito JV, Verbraak FD, Schlingemann RO, De Smet MD (2006) Combined en-face optical coherence tomography and confocal ophthalmoscopy findings in active multifocal and serpiginous chorioretinitis. Am J Ophthalmol 141:972–975 [DOI] [PubMed] [Google Scholar]
- 21.Chong GT, Lee RK (2012) Glaucoma versus red disease: imaging and glaucoma diagnosis. Curr Opin Ophthalmol 23:79–88 [DOI] [PubMed] [Google Scholar]
- 22.Alam S, Zawadzki RJ, Choi S, Gerth C, Park SS, Morse L, Werner JS (2006) Clinical application of rapid serial fourier-domain optical coherence tomography for macular imaging. Ophthalmology 113:1425–1431 [DOI] [PMC free article] [PubMed] [Google Scholar]
- 23.Wojtkowski M, Srinivasan V, Fujimoto JG, Ko T, Schuman JS, Kowalczyk A, Duker JS (2005) Three-dimensional retinal imaging with high-speed ultrahigh-resolution optical coherence tomography. Ophthalmology 112:1734–1746 [DOI] [PMC free article] [PubMed] [Google Scholar]
- 24.Vincent A, Robson AG, Holder GE (2013) Pathognomonic (diagnostic) ERGs. A review and update. Retina 33:5–12 [DOI] [PubMed] [Google Scholar]
- 25.Young B, Eggenberger E, Kaufman D (2012) Current electrophysiology in ophthalmology: a review. Curr Opin Ophthalmol 23:497–505 [DOI] [PubMed] [Google Scholar]
- 26.Cortes LM, Avichezer D, Silver PB, Luger D, Mattapallil MJ, Chan CC, Caspi RR (2008) Inhibitory peptide analogs derived from a major uveitogenic epitope protect from anti-retinal autoimmunity by inducing type 2 and regulatory T cells. J Leukoc Biol 84:577–585 [DOI] [PMC free article] [PubMed] [Google Scholar]
- 27.Chen J, Qian H, Horai R, Chan CC, Falick Y, Caspi RR (2013) Comparative analysis of induced vs. spontaneous models of autoimmune uveitis targeting the interphotoreceptor retinoid binding protein. PLoS One 8:e72161. [DOI] [PMC free article] [PubMed] [Google Scholar]
- 28.Silver PB, Chan CC, Wiggert B, Caspi RR (1999) The requirement for pertussis to induce EAU is strain-dependent: B10.RIII, but not B10.A mice, develop EAU and Th1 responses to IRBP without pertussis treatment. Invest Ophthalmol Vis Sci 40:2898–2905 [PubMed] [Google Scholar]


