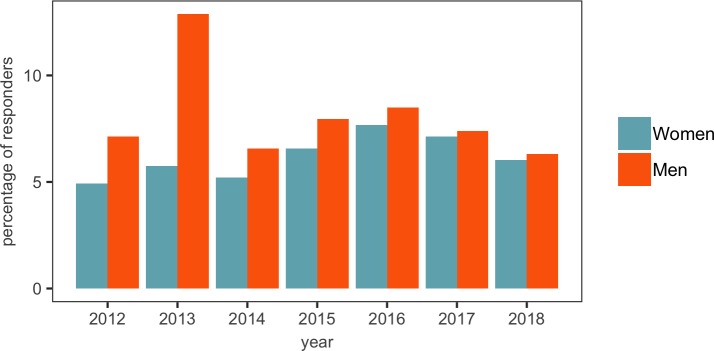
Figure 10. Recruitment of men and women by year.
The gap between the number of men and women appointed as new PIs seems to have narrowed in recent years (with the gap being eight in 2012 and just one in 2017 and 2018), with the very noticeable exception of 2013, when 47 men and 21 women were appointed. A possible explanation for this is discussed in the text.

