Abstract
Background
Albinism patients have poor visual acuity in addition to hypopigmentation. Their foveal anatomy is abnormal, but correlation with function is incompletely understood. This study correlates retinal electrophysiology, visual acuity and optical coherence tomography (OCT) anatomy in albinism patients and compares with age similar controls.
Methods
Institutional Review Board approval was obtained (IRB# 201408782). Patients were recruited from clinical practice. Inclusion criteria were at least three clinical features of albinism including iris transillumination, nystagmus, fundus hypopigmentation, or foveal hypoplasia on OCT and/or molecular genetic confirmation. Diagnosys (Lowell, Mass) full field ERG (ffERG) and VERIS multifocal ERG (mfERG; Electro-Diagnostic Imaging, Milpitas, California) were obtained using standard International Society for Clinical Electrophysiology of Vision (ISCEV) protocols. The mfERG protocol was a 4 minute 103 hexagon protocol covering approximately 40 degrees in diameter of central retina. Control subjects without albinism were recruited by in-hospital notices and invitations in clinic. OCT central thickness was recorded and an OCT foveal score was calculated. Nonparametric permutation testing was utilized to determine the statistical significance.
Results
16 albinism patients and 19 age-similar controls were recruited. 4 of 16 albinism patients had no nystagmus. 17 non-albinism controls had no ocular disorder other than refractive error. Two controls had infantile nystagmus with normal maculas on OCT. There was no statistically significant difference in mfERG amplitude or latency between albinism patients with or without nystagmus (lowest p=0.68; 0.54 respectively).
mfERG:
12 of 16 (75%) albinism patients had average Ring 1 amplitudes within one standard deviation of controls despite having abnormal foveal anatomy on OCT. Patients averaged shorter latencies in Rings 1 and 2 than controls (p = 0.005, p=0.02). Patients averaged higher amplitudes than controls in Rings 4, 5, and 6 (p = 0.03, p = 0.006, p = 0.004). There was no significant correlation between visual acuity (VA) and mfERG amplitudes in any Ring (smallest p = 0.15).
ffERG:
Patients averaged higher amplitudes on 30 Hz flicker (p = 0.008). In all conditions, albinism patients had higher amplitude a-waves (p ≤ 0.03). B-waves were higher amplitude than controls in light adapted 3.0 (p = 0.03). There was no statistical correlation between ffERG amplitudes and visual acuity (smallest p = 0.45).
OCT:
In albinism patients, thicker central macula on OCT correlated with lower mfERG amplitudes in all rings except for ring 1 (p < 0.05) and lower ffERG a-wave amplitudes on dark adapted 0.01 (p = 0.003). Macular thickness on OCT did not correlate with visual acuity (p = 0.51); OCT foveal score did (p=0.0004).
Conclusions
Amplitude of mfERG does not correlate with visual acuity in any ring in patients with albinism. The slope of the change in amplitude from central to peripheral rings on the mferg is significantly different in albinism patients versus controls whether or not nystagmus is present. The decreased slope of change in amplitudes from center to periphery of the macula in albinism patients indicates changes in macular topography that are more important to visual deficits than the foveal depression
INTRODUCTION
Albinism is a congenital condition characterized by complete or partial absence of melanin pigmentation in the skin, hair and eyes. The most common cause is a mutated form of the melanin-producing enzyme, tyrosinase [1,2,3]. This type of albinism is termed Oculocutaneous albinism type 1 (OCA1). There are many other genes in the pigment cascade that can result in albinism if mutated, and to date at least 15 genetic subtypes of albinism have been documented [2,3]. Genetic testing can be done to determine the specific subtype. Mode of inheritance can be autosomal recessive or X-linked recessive (4,5). Aside from the prominent cutaneous findings, this hereditary disorder is also associated with many visual abnormalities including reduced visual acuity, nystagmus, strabismus, photophobia, iris transillumination defects (TIDs), large refractive errors and decreased stereopsis due to anomalous decussation of the optic nerves [6,7].
The fovea is the only part of the retina capable of detailed vision. Foveal anatomy is abnormal in albinism patients as evidenced by lack of a foveal light reflex on fundoscopy and retention of inner retinal layers in the fovea detectable by optical coherence tomography (OCT). This has been termed foveal hypoplasia. One of the first reports of foveal hypoplasia on OCT was an observational study of a 10-year-old female with oculocutaneous albinism. OCT revealed that the foveal pit was non-detectable and foveal thickness was 300 μm as opposed to 150 μm in a normal individual [8]. Subsequent studies revealed varying degree of foveal hypoplasia from a shallow indentation to an increased thickening in the center of the macula [9–13]. Many researchers suggested that this anatomical change may correlate with these patients’ poor visual function, but thus far this relationship is still incompletely understood.
A previous study reported that full-field electroretinogram (ffERG) amplitudes in patients with complete albinism had an increased sensitivity to white and red light in the dark-adapted state [14]. This supernormal response on ffERG was hypothesized to be due to increased light sensitization of the retina in patients with albinism as a result of a greater scatter of light due to lack of pigment [14]. Other studies concluded that hypernormal ffERG was typical in albinism [15]. However, the full field ERG measures the mass electrical activity of the retina with the specific foveal response buried in the larger signal.
The multifocal electroretinogram (mfERG) measures responses from multiple retinal locations individually and simultaneously in a small area of retina [16]. Instead of acquiring a massed electrical response of retinal activity like the ffERG, mfERG is able to detect localized abnormalities if present, usually from the macula and the fovea. This particular quality makes mfERG a suitable candidate for studying the fovea in patients with albinism to look for correlations between electrophysiology amplitudes and visual function as well as morphological defects. In a study of mfERG in two children with albinism obtained under anesthesia, lower central amplitudes were measured on mfERG compared to normal controls [17].
The current study is unique in that it correlates electrophysiology (mfERG and ffERG), visual acuity (VA), and OCT in albinism patients and compares to age-similar controls in order to explore electrophysiology-function correlation. Understanding these relationships may provide insights for possible therapeutic interventions to improve vision in albinism.
METHODS
IRB approval was obtained for a prospective study (IRB# 201408782). Patients were recruited from one clinical practice and controls were recruited by in-hospital notices and invitations to family members and patients without albinism in the clinic. Inclusion criteria for patients were at least three clinical features of albinism such as nystagmus, iris transillumination, fundus hypopigmentation, or documented foveal hypoplasia on optical coherence tomography (OCT), and/or molecular confirmation of disease causing mutations. Controls were patients without albinism. Retrospective chart review and prospective electroretinogram (ERG) studies were performed. Full field ERG (ffERG) (Diagnosys, LLC, Lowell, MA, USA) and VERIS multifocal ERG (mfERG) (VERIS, Electro-Diagnostic Imaging Inc, Milpitas, CA, USA) were obtained using standard ISCEV protocols [18,19]. The mfERG protocol was a 4 minute 103 hexagon protocol covering approximately 40 degrees in diameter of central retina. The luminance of each hexagon was modulated according to a binary m-sequence. The stimulus was displayed on a black-and-white CRT monitor. Each subject’s vision was optimally corrected with a refractor/camera system for the fixed viewing distance of 40 cm. Multifocal ERGs were recorded from both eyes using a fiber electrode. A DTL Plus Electrode (Diagnosys LLC, Lowell, MA) was used and referenced to the ipsilateral ear and grounded to the forehead. Before insertion of the fiber electrode, the cornea was anesthetized with 0.5% proparacaine, and the non-tested eye was occluded. The total recording time was approximately 4 min divided into 8 segments. All subjects were required to maintain fixation during each of the 30 second segments. Segments with large eye movements, losses of fixation, or blinks were discarded and re-recorded. Each local response was isolated by a cross correlation between the m-sequence and response cycle according to the VERIS algorithm (20). OCT was obtained using the Heidelberg OCT (Franklin, MA) or Zeiss Cirrus OCT. Central thickness was recorded from the OCT thickness map and foveal score was calculated based on the scoring algorithm reported by Thomas et al.(21). Genetic testing was performed as part of the clinical evaluation by either the John and Marcia Carver Nonprofit Genetic Testing Laboratory, the Casey Eye Institute Molecular Diagnostics Laboratory (currently the Molecular Vision Lab, Oregon), the, Baylor Genetics Laboratories, or Fairview Diagnostic Laboratories. Visual acuity and nystagmus data were obtained by clinical chart review. Nonparametric permutation testing was utilized to determine the statistical significance of these findings.
RESULTS
Subjects:
There were 8 males and 8 females in the albinism group. The mean age of the albinism patients was 14.3 years (SD = 9.9; range 6–46 years). There were 6 males and 13 females in the control group. The mean age of the control group was 22.2 years (SD = 14.0; range 8–55 years). Albinism patients averaged best corrected visual acuity (BCVA) 20/61.3 (logMAR 0.45) with a range of 20/20 to 20/125 [0 to 0.8 logMAR]) and 12 of the 16 had nystagmus. Controls included 17 patients with no ocular disorders other than refractive error, and 2 patients with infantile motor nystagmus. Seventeen of 19 controls had 20/20 BCVA while 2 did not; one control with infantile nystagmus due to FRMD7 mutation had 20/25 BCVA and another with infantile motor nystagmus had 20/100 BCVA. Both controls with nystagmus had normal macula OCT and no iris transillumination defects. All 16 patients had a clinical diagnosis of albinism and all had at least one plausible mutation in a known albinism gene with the majority having a likely second mutation for autosomal recessive forms. Eight patients had plausible mutations in OCA1, 3 patients had plausible mutations in OCA2, 1 patient had plausible mutations in OCA4, one patient had mutations in HPS3 (confirmed with platelet studies), and 3 patients had plausible mutations in more than one albinism gene. A chart containing patients’ age, visual acuity, nystagmus status, genetic variations, OCT and mfERG Ring 1 waveforms compared to age similar controls is shown in Fig. 1.
Fig.1. Summary of albinism patients’ clinic data.
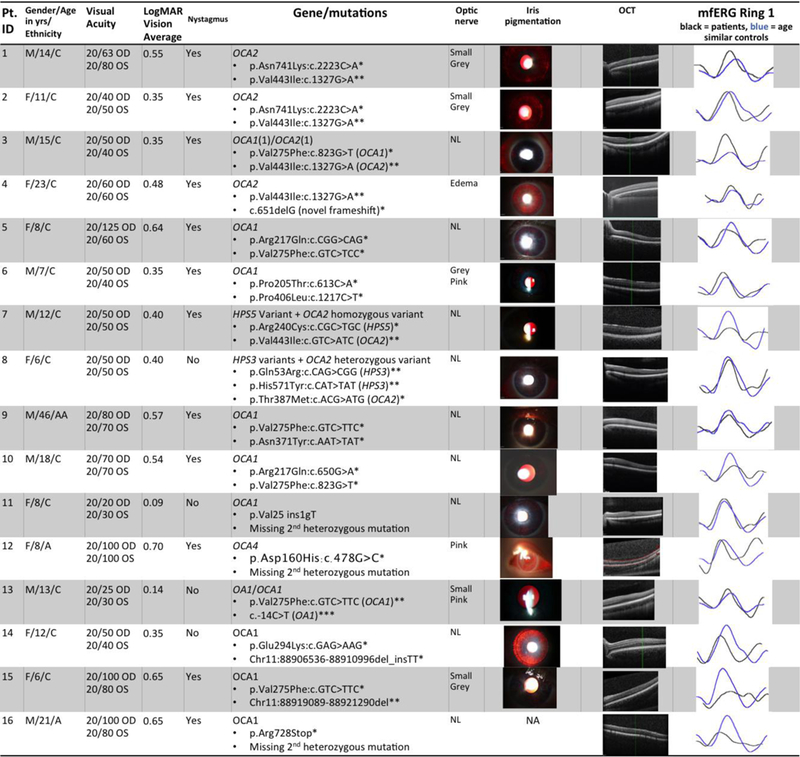
Pt. ID= study identification number for each patient. Yrs = years. M=male, F=female; C=Caucasian, AA=African American, A=Asian. OU=both eyes. Best corrected visual acuity was tested using Snellen letters.
Column “LogMAR Vision (OU)” shows the visual acuity after conversion using the formula LogMAR=- Log(Decimal Acuity)+0.02*X-0.02*Y, where X=number of letters missed on the line, Y=number of letters discerned correctly on the following line
Column “Nystagmus” indicates presence of nystagmus or lack thereof
Column “Gene/mutations” contains albinism genes and mutations
– OCA = Oculocutaneous albinism
– HPS = Hermansky-Pudlak Syndrome
– * = known disease-causing mutation or novel frameshift or stop mutation
– ** = likely disease-causing but also prevalent in general population
– *** = likely a benign sequence variant
– Patient 3 also has a hypomorphic allele in OCA1 (p.Arg402Gln:c. 1205G>A) Column “optic nerve” contains descriptions of optic nerves for albinism patients on fundoscopic exam
– NL= normal
Column “Iris pigmentation” contains images of slit lamp photographs demonstrating iris transillumination
– Patient #6 and Patient #10 iris photographs digitally enhanced in PowerPoint or Zeiss Forum respectively by increasing brightness and contrast levels by 20%; no other photograph was altered from original
Column “OCT” contains optical coherence tomography scans of retinal anatomy demonstrating the range of foveal development in albinism study participants
Column “mfERG Ring 1” shows the mfERG waveform for the centermost ring for patients as compared to age similar controls in this study. Each normal waveform is therefore from a different controls subject, age similar to the patient whose waveform is shown. Black=patient, blue=control
To account for the effect of nystagmus artifact on the mfERG waveforms, mfERG amplitudes were compared, by ring, between albinism patients with (n= 12) and without (n=4) nystagmus. There was no difference in amplitude in any ring (p values from 0.68 to 1.0 going from ring 1 to ring 6). There was no difference in latency (p values from 0.90 to 0.54 going from rings 1 to ring 6). Controls without nystagmus (n=17) were also compared to controls with nystagmus (n=2) and also demonstrated no differences in amplitude (p value from 0.65 to 0.84) or latency (p value from 0.07 to 0.45).
mfERG:
14 of 16 albinism patients had Ring 1 amplitudes within 1 standard deviation (SD) of controls (61.6 +/−20.9 nV/deg2) in at least one eye, even in the absence of a visible fovea on OCT. There was no significant difference in ring 1 amplitudes between patients and controls. Patients (n=16) averaged higher amplitudes than controls (n=19) in Rings 4, 5, and 6 (p = 0.03, p = 0.006, p = 0.004). When the albinism patients without nystagmus (n=4) were compared to the controls without nystagmus (n=17) there was no difference in amplitude in rings 1,2 or 3 (p values 0.90 to 0.10) but there was a difference in rings 4,5,6 (p values 0.04 to 0.031) just as with comparison of the entire groups. The rate of change in amplitude from Ring 1 to Ring 6, was steeper in controls (rate of decline −0.322) than in albinism patients (rate of decline −0.228) (p = 3.16×l0−12) as shown in Fig. 2. Patients averaged shorter latencies in Rings 1 and 2 than controls (p = 0.005, p = 0.02) for comparisons of both the entire groups (n=16 albinism, n=19 controls) and the albinism patients without nystagmus (n=4) and controls without nystagmus (n=17). There was no correlation between visual acuity and mfERG amplitudes in any Ring (lowest p=0.149, Ring 1). Mean and standard deviation of amplitudes for all rings in subsets of patients and controls can be found in Table 1.
Fig.2. Multifocal ERG change in amplitude from Ring 1 through 6 in patients and controls.
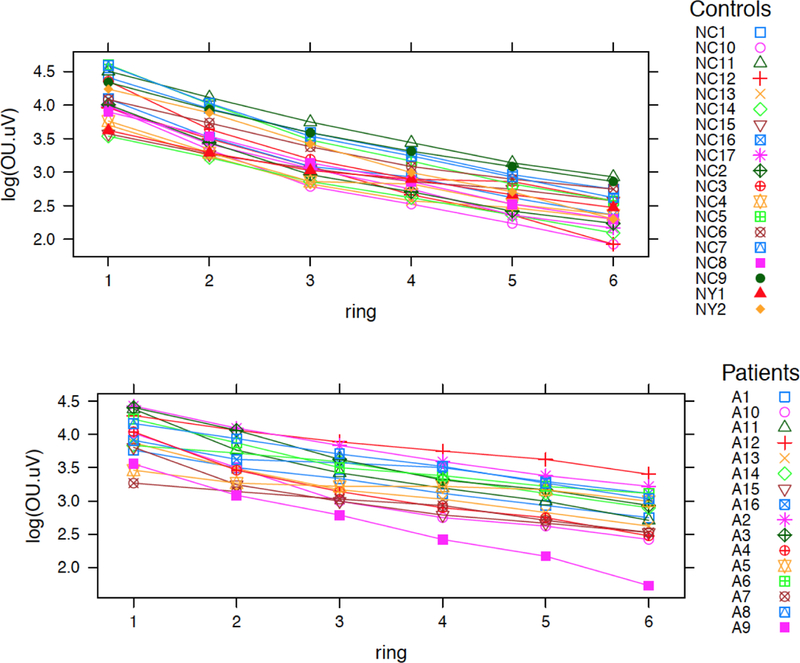
This figure was produced in R. It juxtaposes decrease in amplitudes from the centermost ring (Ring 1) to the most peripheral ring (Ring 6) in albinism patients compared to controls. X-axis shows the Rings in ascending order. Y-axis is the amplitude for each ring on the logarithmic scale. Difference between rate of decrease for patients (lower) and controls (upper) was statistically significant with the controls having a steeper decrease towards the periphery (p = 3.2 × 10⁻¹²). Color coded symbols correspond to individual patients and controls as listed.
Table 1.
Mean amplitudes and standard deviations for mfERG, ffERG, OCT and VA between groups mfERG=Multifocal electroretinogram; ffERG=Full field ERG; OCT=optical coherence tomography; VA=Visual acuity. SD=standard deviation.
| Test | Test Category |
Albinism Patients |
Albinism Patients |
Albinism w/o nystagmus |
Albinism w/o nystagmus |
Controls w/o nystagmus |
Controls w/o nystagmus |
Controls with nystagmus |
Controls with nystagmus |
|---|---|---|---|---|---|---|---|---|---|
| mean | SD | mean | SD | mean | SD | mean | SD | ||
| mfERG | Ring 1 | 55.96 | 18.66 | 59.69 | 15.79 | 61.61 | 20.94 | 53.44 | 22.54 |
| Ring 2 | 39.17 | 13.3 | 42.03 | 7.69 | 38.26 | 12.11 | 37.81 | 15.47 | |
| Ring 3 | 30 | 10.09 | 32.81 | 7.3 | 25.46 | 7.84 | 25.63 | 7.07 | |
| Ring 4 | 24.67 | 8.49 | 26.72 | 5.6 | 19.38 | 5.38 | 19.06 | 1.33 | |
| Ring 5 | 20.75 | 7.25 | 21.41 | 3.97 | 14.93 | 4.04 | 14.69 | 0.44 | |
| Ring 6 | 16.88 | 6.19 | 16.89 | 3.13 | 11.78 | 3.41 | 10.94 | 1.32 | |
| ffE RG |
Photopic 3.0 (b wave) |
176.16 | 58.27 | 170.31 | 47.87 | 132.24 | 34.33 | 169.75 | N/A |
| photopic 3.0 (a wave) | 39.99 | 14.31 | 40.08 | 7.14 | 29.08 | 8.13 | 31.6 | N/A | |
| 30 Hz Flicker | 143.76 | 50.98 | 133.2 | 18.62 | 99.54 | 26.32 | 91.54 | N/A | |
| Scotopic 0.01 (b wave) | 260.92 | 90.5 | 314.6 | 82.8 | 217.49 | 80.07 | 144.6 | N/A | |
| Scotopic 0.01 (a wave) | 14.3 | 5.28 | 13.6 | 5.4 | 7.52 | 4.02 | 9.1 | N/A | |
| Scotopic 3.0 (b wave) | 319.96 | 84.69 | 321.35 | 56.38 | 294.81 | 45.94 | 265.95 | N/A | |
| Scotopic 3.0 (a wave) | 195.24 | 26.11 | 207.27 | 34.73 | 146.9 | 35.12 | 168.9 | N/A | |
| 0 CT |
Macular thickness |
311.67 | 19.82 | 318.63 | 11.91 | 278. 89 |
17.51 | 282.25 | 26.32 |
| VA | LogMAR | 0.45 | 0.17 | 0.24 | 0.15 | 0 | 0 | 0.35 | 0.18 |
ffERG:
B-wave amplitudes were higher in light adapted 3.0 in albinism patients than controls (p = 0.03) (see Fig. 3). Albinism patients also averaged higher amplitudes than controls on 30 Hz flicker (p = 0.008) and in a-waves in all conditions (p ≤ 0.03). For albinism patients, average light adapted a-wave amplitude was 40.0 μV (SD = 14.3). Average light adapted a-wave amplitude for controls was 29.1 μV (SD = 8.1). For albinism patients, average light adapted b-wave amplitude was 176.1 μV (SD = 58.3); for controls it was 132.2 μV (SD = 34.3). 12 of 16 albinism patients had nystagmus; there was little qualitative difference noted in tracings in most cases (see Fig. 4). The differences between b-wave amplitudes were not statistically significant for dark adapted 0.01 and dark adapted 3.0 conditions (p = 0. 13, p = 0.50). There was no correlation between ffERG amplitudes and visual acuity (lowest p = 0.44, dark adapted .01 a-wave). ). Mean and standard deviation of amplitudes for all rings in subsets of patients and controls can be found in Table 1.
Fig.3. Full field and Multifocal ERG amplitudes for Ring 1 and Ring 6 in albinism patients vs controls.
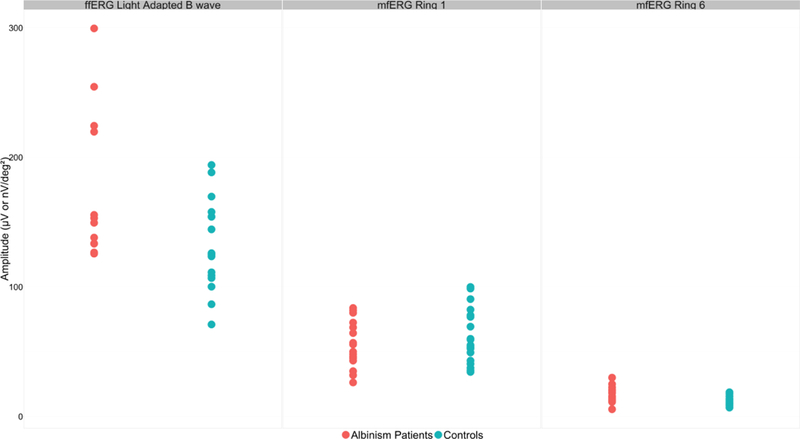
This scatterplot depicts the amplitudes for patients (n=16) and controls (n=17 for ffERG, n=19 for mfERG) on ffERG light adapted b-wave in μV (left), mfERG Ring 1 (middle) and mfERG Ring 6 (right) in nV/deg2. Albinism patients averaged higher ffERG b-wave amplitudes than the controls (p<0.01), however there was considerable overlap between the groups. Albinism patients averaged lower mfERG amplitudes than controls in Ring 1, however it was not statistically significant. Albinism patients averaged higher mfERG amplitudes than the controls in Ring 6, and while there was overlap of values, the difference is statistically significant (p<0.01).
Fig.4. mfERG density plot comparison in a control and an albinism patient.
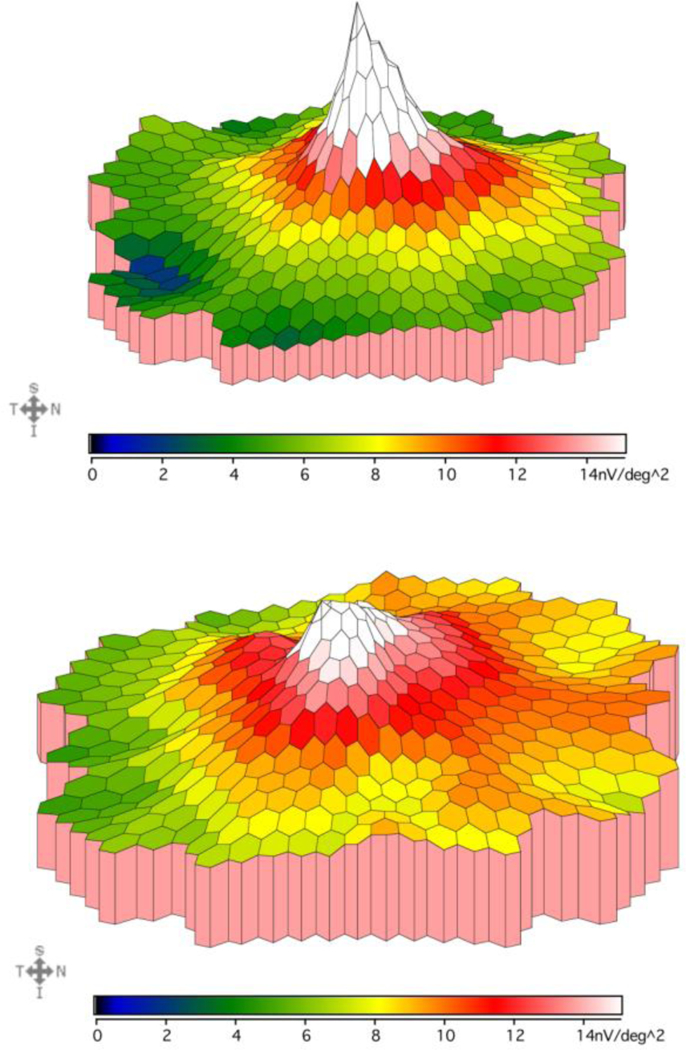
This figure compares the mfERG responses recorded from the macula in a control subject (top, age 12 years) vs an albinism patient (bottom, age 12 years). Color gradient corresponds to different mfERG amplitudes as shown below each density plot. This albinism patient demonstrates a slower drop off of amplitude from center to periphery and higher amplitudes than controls in the outermost rings, which is representative of the patient group.
OCT:
In albinism patients, thicker central macula on OCT correlated with lower mfERG amplitudes in Rings 2, 3, 4, 5, and 6 (p = 0.04, p = 0.04, p = 0.05, p = 0.02, p = 0.04) and lower a-wave amplitudes on dark adapted 0.01 ffERG (p = 0.003). There was no correlation between OCT macular thickness and visual acuity (p = 0.51). Fovea hypoplasia score did correlate with visual acuity (p < 0.001), but did not correlate with amplitude in any ring of the mfERG (lowest p=0.06). Mean and standard deviation of OCT thickness and visual acuity in subsets of patients and controls can be found in Table 1.
DISCUSSION
This is the first study to our knowledge of a cohort of genetically diverse albinism patients correlating mfERG, ffERG, visual acuity and OCT thickness values. 12 of 16 albinism patients in this study had average Ring 1 amplitudes within one SD of controls and there was no significant difference in ring 1 amplitude between albinism patients and controls (p=0.466). There was no correlation between visual acuity and amplitude in any multifocal ERG ring, which is surprising given the obvious anatomic abnormality of the fovea, the very region examined by mfERG, in albinism patients. Absence of the thinned foveal pit has been hypothesized to be the cause of reduced vision in albinism with the supposition that persistent inner retinal layers preclude optimal focus on the photoreceptors below. If this were the case, mfERG amplitudes should be lower than in normals. Our data suggests that lack of a foveal pit is not the cause of poor vision in albinism.
The most striking difference between albinism patients and controls is a significant difference between amplitudes in macular periphery rings 4,5 and 6, with albinism patients having significantly higher amplitudes. When only albinism patients without nystagmus were compared to only controls without nystagmus, this relationship persisted. This supports a different electrical topography in the macula of patients with albinism compared to controls. Importantly, a similar flattened slope of amplitudes from central ring to peripheral on mfERG has been reported previously in patients with X-linked ocular albinism (OA1) (22). Our cohort includes one patient with OA1 in addition to 5 other genetic types, confirming this electrical topography phenotype in multiple genotypes.
Neither multifocal nor full-field ERG amplitudes correlated with BCVA in albinism patients, nor did central macular thickness. Foveal score on OCT did correlate with visual acuity; this score takes into account whether there is lengthening of the outer segments in the fovea, while the central thickness is primarily determined by the amount of foveal pit formation and extent to which inner retina is extruded in the fovea. Other authors have found variable associations with outer segment lengthening, foveal pit formation and visual acuity in albinism patients (7,10,11,12,13). Our results demonstrate that lack of foveal pit formation in albinism is not associated with electrical dysfunction of the photoreceptors in the foveola, and while dramatic and useful for diagnosis, it is likely not the the main cause for decreased vision in albinism. Fovea plana may be a better descriptor than fovea hypoplasia when describing the foveal pit, as suggested by Marmor et al. (10).
Albinism patients demonstrated a normal gradient of electrical activity in the macula, with highest mfERG amplitude in the center and a pattern of decline toward the periphery as is seen in controls; in both groups the amplitudes in Ring 1 were statistically significantly higher than in Ring 6. However, the gradual decline from Ring 1 to 6 in albinism patients was different than the steep drop-off in amplitudes outside of Ring 1 in controls. The difference in rate of decline between the two groups was statistically significant (p = 3.16 ×l0−12). Ring 1 amplitude in albinism patients is not significantly lower amplitude than controls (though latency was shorter) however Rings 4,5 and 6 are higher amplitude in albinism patients than controls. This suggests a different topographic maturation of the entire macula in albinism patients as demonstrated by the density plot in Fig. 4. This may be secondary to aberrant photoreceptor packing in the macula, or an anatomic abnormality of the central cones. In the most severe cases with the worst vision, lengthening of the central cone outer segments is not apparent. As yet poorly understood factors in other layers of the neural retina may determine macular development during embryogenesis. Abnormal decussation of the optic nerves and small optic nerve heads are known to be part of the albinism syndrome. The neural anomalies in the albinotic eye may lead to altered development of the macular cones, with lack of extrusion of the inner retinal layers a secondary effect which is visible on OCT but not vital to normal visual acuity.
With hypopigmentation of the eye being an important part of the clinical diagnosis of albinism, one might hypothesize that more TIDs would lead to more debilitating symptoms, i.e., worse nystagmus and worse vision, however in Figure 1, Patient #14 has more TIDs than patient #6, yet has no nystagmus and equal vision. Iris TID severity suggests more retinal hypopigmentation which has been hypothesized to cause higher amplitude ERG.. Light scatter within the blond fundus has been thought to contribute to elevated amplitudes. Figure 5 demonstrate that this is not always the case. Patient #14, a patient with OCA1 without nystagmus, has massive iris TIDs but a lower ffERG waveform than Patient #6 with significantly fewer TIDs and high frequency nystagmus. Neither has a waveform distinguishable from a similar age control with normal pigmentation solely on the basis of ffERG waveform.. Inter-individual variability in both albinism patients and controls makes electrophysiology inaccurate as a diagnostic or prognostic tool. There was significant overlap between the amplitudes for individual patients and controls despite the statistically significant differences on their mean amplitudes.
Fig.5. Light Adapted 3.0 ffERG waveform and mfERG First Order Traces in controls and albinism patients with and without nystagmus.
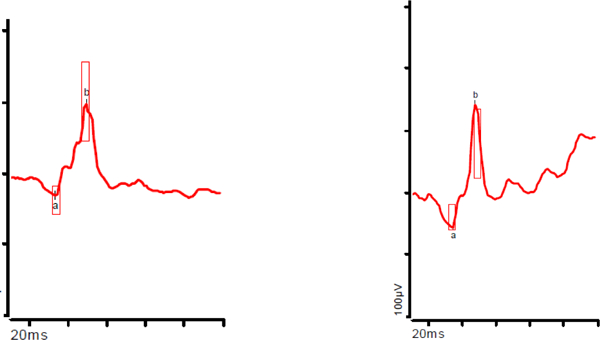
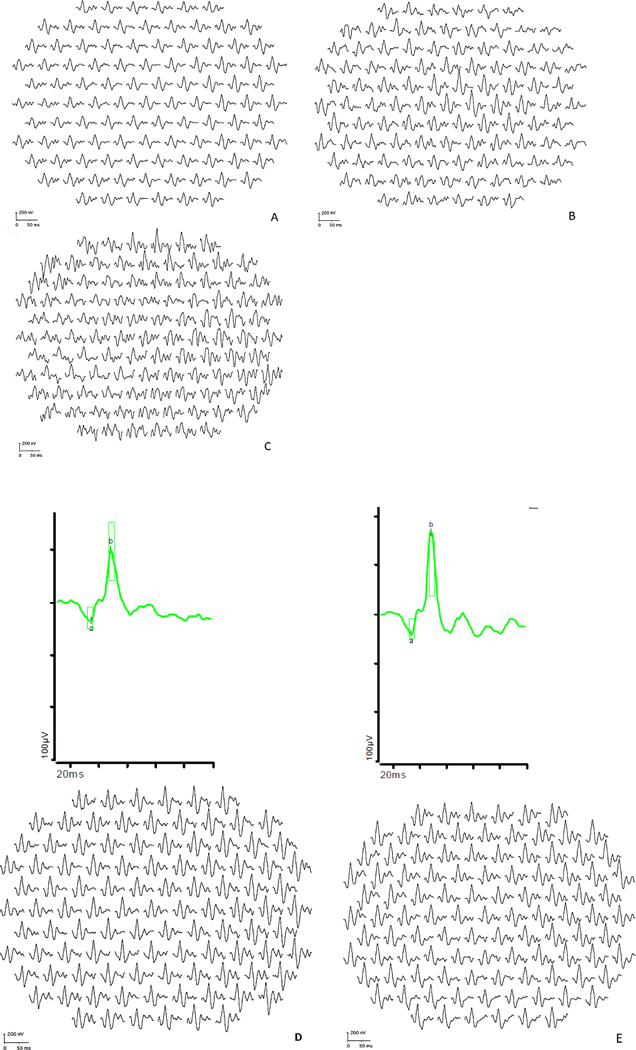
A. Control without nystagmus, B. Control with infantile nystagmus, C. Control with FRMD7 nystagmus (no ffERG available), D. Albinism without nystagmus (Patient 14), E. Albinism with nystagmus (Patient 6)
One control patient with FRMD7-related nystagmus without foveal hypoplasia had a low normal Ring 1 peak, lower than some patients with albinism, despite having normal visual acuity. However, because of the small number of control subjects with nystagmus in the study, this could not be explored further.
In conclusion, this study demonstrates that retinal cone function in patients with albinism as measured by full field or multifocal ERG does not correlate with visual acuity. Nystagmus did not significantly affect measured mfERG amplitudes or latency in most patients. Multifocal amplitudes were inversely correlated with central macular thickness on OCT., The topography of mfERG responses in the macula was aberrant compared to controls with a slower drop off of amplitude from center to periphery and higher amplitudes than controls in the outermost rings. Further studies of foveal cone morphology, the inner retinal neural layers, and the posterior neural pathways are needed to better understand the cause of vision loss in albinism.
Acknowledgement:
Portions of this study were presented at ISCEV 2017, AAPOS 2017, and ARVO 2016
Frank Bertsch kindly supplied the graphic for Figure 3.
Funding
Vision for Tomorrow foundation funded this research (Drack). Additional support came from the NIH (T35 HL007485) training grant, the Ronald Keech Professorship, Foundation Fighting Blindness, and Research to Prevent Blindness grant funding. The sponsors had no role in the design or conduct of this research.
Glossary
- ISCEV
International Society for Clinic Electrophysiology of Vision
- AAPOS
American Association for Pediatric Ophthalmology and Strabismus
- ARVO
The Association for Research in Vision and Ophthalmology
Footnotes
Conflict of Interest
All authors certify that they have no affiliations with or involvement in any organization or entity with any financial interest (such as honoraria; educational grants; participation in speakers’ bureaus; membership, employment, consultancies, stock ownership, or other equity interest; and expert testimony or patent-licensing arrangements), or non-financial interest (such as personal or professional relationships, affiliations, knowledge or beliefs) in the subject matter or materials discussed in this manuscript.
Ethical Approval
All procedures performed in studies involving human participants were in accordance with the ethical standards of the institutional and/or national research committee and with the 1964 Helsinki declaration and its later amendments or comparable ethical standards.
Informed consent
Informed consent was obtained from all individual participants included in the study.
References
- 1.Kamaraj B, Purohit R (2014) Mutational analysis of oculocutaneous albinism: a compact review. Biomed Res Int. 2014;2014:905472. doi: 10.1155/2014/905472. Epub 2014 Jun 29. Review. PMID: [DOI] [PMC free article] [PubMed] [Google Scholar]
- 2.Lewis RA (2013) Oculocutaneous Albinism Type 1 In: Adam MP, Ardinger HH, Pagon RA, Wallace SE, Bean LJH, Stephens K, Amemiya A, editors. GeneReviews®[Internet]. Seattle (WA): University of Washington, Seattle; 1993–2018. 2000 January 19 [updated 2013 May 16].PMID:. [Google Scholar]
- 3.Park SH, Chae H, Kim Y, Kim M (2012) Molecular Analysis Of Korean Patients With Oculocutaneous Albinism. Jpn J Ophthalmol 56: 98–103. 10.1007/sl0384-011-0098-z [DOI] [PubMed] [Google Scholar]
- 4.Lewis RA Ocular Albinism, X-Linked (2004) In: Adam MP, Ardinger HH, Pagon RA, Wallace SE, Bean LJH, Stephens K, Amemiya A, editors. GeneReviews®[Internet]. Seattle (WA): University of Washington, Seattle; 1993–2018. 2004 March 12 [updated 2015 Nov 19], [Google Scholar]
- 5.Shen B, Samaraweera P, Rosenberg B, Orlow SJ (2001) Ocular albinism type 1: more than meets the eye. Pigment Cell Res. 14(4):243–8. [DOI] [PubMed] [Google Scholar]
- 6.King RA, Hearing VJ, Creel DJ, Oetting WS (1995) Albinism In: Scriver CR, Beaudet AL, Sly WS, Valle D (ed) The Metabolic And Molecular Bases Of Inherited Disease. McGraw-Hill, New York, 3:4353–4392 [Google Scholar]
- 7.McCafferty BK, Wilk MA, McAllister JT, Stepien KE, Dubis AM, Brilliant MH, Anderson JL, Carroll J, Summers CG (2015) Clinical Insights Into Foveal Morphology in Albinism. J Pediatr Ophthalmol Strabismus. 2015 May-June;52(3): 167–72. doi: 10.3928/01913913-20150427-06. [DOI] [PMC free article] [PubMed] [Google Scholar]
- 8.Meyer CH, Lapolice DJ, Freedman SF (2002) Foveal hypoplasia in oculocutaneous albinism demonstrated by optical coherence tomography. Am J Opthalmol. 133(3):409–10. [DOI] [PubMed] [Google Scholar]
- 9.McAllister JT, Dubis AM, Tait DM et al. (2010) Arrested development: high-resolution imaging of foveal morphology in albinism. Vision Res. 50:810–817 [DOI] [PMC free article] [PubMed] [Google Scholar]
- 10.Marmor MF, Choi SS, Zawadzki RJ, Werner JS (2008) Visual insignificance of the foveal pit: reassessment of foveal hypoplasia as fovea plana. Arch Ophthalmol. 126:907–913 [DOI] [PMC free article] [PubMed] [Google Scholar]
- 11.Thomas MG, Kumar A, Mohammad S et al. (2011) Structural grading of foveal hypoplasia using spectral-domain optical coherence tomography a predictor of visual acuity? Ophthalmology. 118:1653–1660 [DOI] [PMC free article] [PubMed] [Google Scholar]
- 12.Seo JH, Yu YS, Kim JH, Choung HK, Heo JW, Kim SJ (2007) Correlation of visual acuity with foveal hypoplasia grading by optical coherence tomography in albinism. Ophthalmology. 114:1547–1551 [DOI] [PubMed] [Google Scholar]
- 13.Wilk MA, McAllister JT, Cooper RF et al. (2014) Relationship between foveal cone specialization and pit morphology in albinism. Invest Ophthalmol Vis Sei. 55(7):4186–4198. [DOI] [PMC free article] [PubMed] [Google Scholar]
- 14.Krill AE, Lee GB (1963) The electroretinogram in albinos and carriers of the ocular albino trait. Arch Ophthalmol. 69(l):32–38 [DOI] [PubMed] [Google Scholar]
- 15.Wack MA, Peachey NS, Fishman GA (1989) Electroretinographic findings in human oculocutaneous albinism. Ophthalmology. 96(12): 1778–85 [DOI] [PubMed] [Google Scholar]
- 16.Azarmina M (2013) Full-Field versus Multifocal Electroretinography. J Ophthalmic Vis Res. 8(3): 191–192 [PMC free article] [PubMed] [Google Scholar]
- 17.Kelly JP, Weiss AH (2006) Topographical retinal function in oculocutaneous albinism. Am J Ophthalmol. 14(6): 1156–8 [DOI] [PubMed] [Google Scholar]
- 18.McCulloch DL, Marmor MF, Brigell MG, Hamilton R, Holder GE, Tzekov R, Bach M (2015) ISCEV Standard for full-field clinical electroretinography (2015 update). Doc Ophthalmol 130:1–12 [DOI] [PubMed] [Google Scholar]
- 19.Hood DC, Bach M, Brigell M, Keating D, Kondo M, Lyons JS, Marmor MF, McCulloch DL, Palmowski-Wolfe AM (2012) ISCEV Standard for clinical multifocal electroretinography (2011 edition). Doc Ophthalmol 124:1–13 [DOI] [PMC free article] [PubMed] [Google Scholar]
- 20.Sutter EE, Tran D (1992) The field topography of the ERG components in man –I. The photopic luminance response. Vis Res 32:433–466 [DOI] [PubMed] [Google Scholar]
- 21.Thomas MG, Kumar A, Mohammad S, Proudlock FA, Engle EC, Andrews C, Chan W, Thomas S, Gottlob I (2011) Structural grading of foveal hypoplasia using spectral-domain optical coherence tomography a predictor of visual acuity? Ophthalmology. 118(8): 1653–60. [DOI] [PMC free article] [PubMed] [Google Scholar]
- 22.Nusinowitz S and Sarraf D Retinal function in X-linked ocular albinism (OA1).Current Eye Research 2008;33:789–803. [DOI] [PubMed] [Google Scholar]


