

SUMMARY
Plasmodium parasites undergo an obligatory and asymptomatic developmental stage within the liver before infecting red blood cells to cause malaria. The hijacked host pathways critical to parasite infection during this hepatic phase remain poorly understood. Here, we implemented a forward genetic screen to identify over 100 host factors within the human druggable genome that are critical to P. berghei infection in hepatoma cells. Notably, we found knockdown of genes involved in protein trafficking pathways to be detrimental to parasite infection. The disruption of protein trafficking modulators, including COPB2 and GGA1 decreases P. berghei parasite size and an immunofluorescence study indicates that these proteins are recruited to the Plasmodium parasitophorous vacuole in infected hepatocytes. These findings reveal that various host intracellular protein trafficking pathways are subverted by Plasmodium parasites during the liver stage and provide new insights into their manipulation for growth and development.
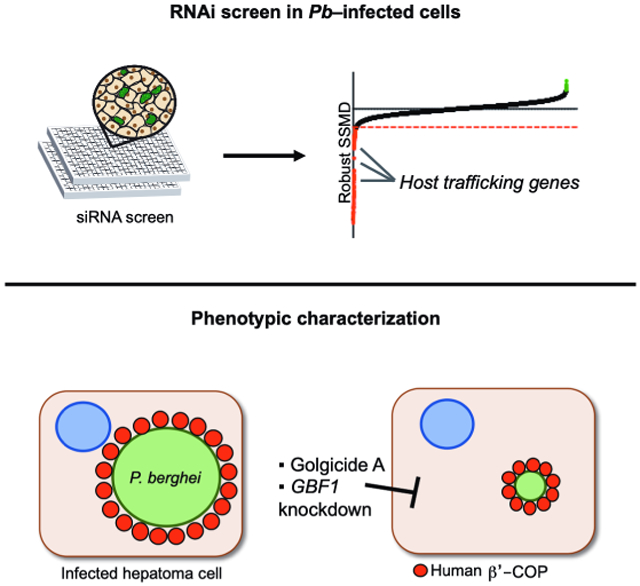
Graphical Abstract
eTOC Blurb
Raphemot et al. use a genomic screen to provide insights into host-pathogen interactions during Plasmodium development within hepatocytes. Molecular and chemical approaches highlight that the host vesicular trafficking pathway is subverted by Plasmodium for growth in liver cells.
INTRODUCTION
Plasmodium spp. are obligate intracellular parasites that begin their infection in the human host by invading hepatocytes. In these host cells, a single parasite termed a sporozoite will transform and then replicate asexually to form thousands of merozoites, a blood-infective parasite form. This transformation and subsequent replication in liver cells all occurs within a parasitophorous vacuole (PV), a structure derived from the host cell membrane during invasion. After parasite maturation and release from the liver, they replicate within erythrocytes causing the clinical manifestation of malaria (Raphemot et al., 2016). Although Plasmodium infects both human liver and red blood cells, distinct host-pathogen interactions enable the successful invasion, replication, and development of the parasites within these disparate host cells. These interactions, including those that are critical to Plasmodium pathogenesis, remain largely unknown.
There are several studies that suggest Plasmodium parasites interact with host hepatocytes while secured within the PV. Transcriptional studies demonstrate the coordinated expression of various human genes throughout Plasmodium infection (Albuquerque et al., 2009; Tarun et al., 2008) and a handful of host factors are known to be essential to the parasite (Posfai et al., 2018; Prudencio and Mota, 2013). Most of these essential host factors were identified with two pivotal small-interfering RNA (siRNA) studies that collectively examined 780 genes. Through evaluation of genes involved in the lipoprotein pathway and those encoding kinases, the host scavenger receptor BI (SCARB1) was identified as an important factor for P. berghei invasion and development within hepatocytes (Rodrigues et al., 2008) and multiple host kinases were implicated in liver-stage development (Prudencio et al., 2008). However, our understanding of the biological processes employed by Plasmodium to evade the immune system and exploit hepatocyte resources for development remains limited. Identifying these critical host factors will not only provide novel insights into host-parasite interactions but may also produce starting points for host-based therapeutic interventions. Targeting non-essential host factors in hepatocytes presents a promising opportunity to circumvent the emergence of drug-resistant parasites (Douglass et al., 2015; Glennon et al., 2018), and thus facilitate disease eradication (Derbyshire et al., 2012; Rodrigues et al., 2012).
In this study, we sought to investigate host factors that are required by Plasmodium parasites in hepatocytes. RNA interference (RNAi) studies have proven to be powerful strategies for dissecting the interactions between host factors and various pathogens, such as viruses, bacteria and parasites (Kuhbacher et al., 2015; Moser et al., 2013; Watanabe et al., 2014). Here, we implemented an siRNA screen to test 6,951 druggable human genes for their involvement in P. berghei infection of HepG2 cells. Our results suggest that several human genes ranging from modulators of transcription/translation to those involved in cell metabolism are critical to liver-stage Plasmodium development. Using small molecule probes and reverse-genetic strategies, we demonstrate that host vesicle-mediated trafficking involving COPB2, COPG1 and GGA1 is critical to liver-stage parasite development. In addition to uncovering the role of the host trafficking pathway in malaria parasite survival, our results provide a broader understanding of human molecular processes used by Plasmodium during its liver-stage development.
RESULTS
1. RNAi Screen Identifies Host Factors Essential to Liver-Stage Plasmodium Parasite Infection.
A druggable genome RNAi screen in liver cells was conducted as an unbiased approach to identify host factors critical to liver-stage Plasmodium. The human druggable RNAi library is commercially available through Qiagen and includes diverse targets with potential therapeutic value such as G-protein coupled receptors, kinases, phosphatases, transcription factors, nucleic acid binding molecules, among others. This screen was completed using rodent P. berghei parasites stably expressing a luciferase reporter (P. berghei-Luc) (Franke-Fayard et al., 2005) to infect human hepatoma HepG2 cells. As shown in Figure 1A, pools of 4 unique short-interfering RNA (siRNA) duplexes grouped in a 2 × 2 pool format were used in 384-well plates. Each siRNA targeted one of the 6,951 genes of the druggable genome library. Non-targeting scrambled (NT) siRNAs and siRNAs targeting the host SCARB1 (siSCARB1), a known host factor critical for liver-stage Plasmodium (Rodrigues et al., 2008; Yalaoui et al., 2008), were used as negative and positive controls, respectively. At 48 hours post-siRNA transfection, cells were infected with P. berghei-Luc at a multiplicity of infection (MOI) of 0.3. Following infection, parasite load in hepatocytes was assessed by monitoring the relative luciferase signal at 48 h post-infection (hpi). Liver cell viability at 48 hpi was assessed concurrently by monitoring intracellular protease activity. The positive control, siSCARB1, consistently reduced parasite load by approximately 65% with no significant effect on liver cell viability (Figure 1B).
Figure 1. A Druggable-Genome RNAi Screen Identifies Host Factors of P. berghei Liver-Stage.

(A) Schematic representation of the siRNA screen. HepG2 cells were reverse-transfected with pooled siRNAs in a 384-well plate. After 48 h post siRNA transfection (30 nM), P. berghei sporozoites expressing luciferase (Pb-Luc) were added to the cells (MOI, 0.3) and relative liver cell viability and parasite load were measured at 48 h post-infection.
(B) In this screen, the positive control of pooled siRNAs targeting SCARB1 (siSCARB1) led to a decrease in parasite load (grey bars) of approximately 60% as compared to the negative controls of mock and non-targeting scrambled siRNA (NT siRNA). No significant effects on HepG2 cell viability (>50%) were observed (red circles). Data are mean ± SEM; n = 46 technical replicates.
(C) Distribution of the robust SSMD scores of Plasmodium liver-stage infection for roughly 7,000 targeted genes in the druggable genome library. Anti-infection hits exhibit an increase in parasite load upon gene suppression and are defined by a robust SSMD score ≥ 2 (green). Pro-infection hits exhibit a decrease in parasite load upon gene suppression and are defined by a robust SSMD score ≤ −2 (red). The number of genes implicated as pro-infection or anti-infection is shown.
(D) Functional group network view for Reactome pathway (circles) and GO terms (hexagons) generated with ClueGO. Terms are functionally grouped based on shared genes (kappa score) and are shown with different colors.
(E) Heat map of percent P. berghei parasite load inhibition for fifty-eight selected pro-infection genes tested in HepG2 and Huh7 cell lines. Two different siRNAs per gene (gene_1 and gene_2) were tested.
(F) Venn diagram of unique and shared targeted genes that significantly decreased (≥ 50%) liver-stage parasite load within the two hepatoma cell lines.
For hit selection, the robust standardized mean difference (robust SSMD) (Birmingham et al., 2009; Zhang, 2007; Zhang et al., 2010) as implemented in GUItars (Goktug et al., 2012) was employed. The SSMD method was chosen over other hit selection methods, such as the z-score, to minimize the false positive and false negative discovery rates. Additionally, the SSMD method enables the strength of siRNA effects to be classified providing a meaningful interpretation of their magnitude. Using this approach, we set the ranking selection criteria such that siRNAs exhibiting SSMD scores of ≤ −2 (decrease of parasite load) or ≥ 2 (increase of parasite load) were considered hits. We found several targeted genes leading either to a decrease (pro-infection, 181 genes) or increase (anti-infection, 13 genes) of parasite load (Figure 1C, Table S1A). Importantly, we were able to identify the positive control SCARB1 as a pro-infection gene within the screening library based on our hit selection criteria. Among our screening hits, we focused on the analysis and validation of pro-infective host genes. To gain insights into the biological significance of our pro-infection hits, we employed ClueGO, a Cytoscape plugin that allows visualization of functionally grouped networks based on Gene Ontology (GO) enrichment analysis (Table S1B). As shown in Figure 1D, genes whose depletion led to a reduction in hepatic parasite load were functionally enriched in RNA replication and regulation, protein trafficking, cytokine signaling, immune response and cellular development processes.
Next, we set to confirm the pro-infection genes identified in our primary screen. We selected 58 genes for confirmation analyses based on their robust observed phenotypic effect (SSMD < −4), and our GO and Reactome analysis. To verify that the pro-infection gene phenotype was not the result of sequence-specific off-target effects by the pooled siRNAs (Sigoillot and King, 2011), we tested individual siRNAs that were distinct from the primary screen to identify candidates where two targeting siRNAs were active in our assay (Table S1C). Additionally, deconvoluted siRNAs (individual siRNAs from a pooled set) were screened against two different hepatoma cell lines, HepG2 and Huh7, using a similar assay format as the primary screen (Figure 1E, Table S2). Of the retested hit candidates, the suppression of 14 genes led to a greater than 50% decrease in parasite load in hepatoma cells with knockdown using two distinct siRNAs. Notably, the knockdown of six genes decreased parasite load in both cell lines (Figure 1F, S1A-B). From these data, we chose three genes involved in host protein trafficking for further investigation: COPB2, COPG1 and GGA1.
2. COPB2, COPG1 and GGA1 are Critical Host Factors for Plasmodium Liver-Stage Development.
While members of protein trafficking have been implicated in viral replication (Watanabe et al., 2014), little is known about their contribution during Plasmodiumliver-stage infection. The COPB2 and COPG1 proteins are vesicular coat subunits (β’-COP and γ-COP) of the coatomer protein complex I (COPI), which mediates retrograde vesicular trafficking from the Golgi to ER; whereas GGA1 is an adapter protein involved in clathrin recruitment and vesicular trafficking from the trans-Golgi network to endosomes (Paczkowski et al., 2015). To validate our screen and demonstrate that reduction in parasite load is mediated by specific knockdown of COPB2, COPG1 or GGA1, we completed rescue experiments using siRNA-resistant gene constructs. HepG2 cells were co-transfected with targeting siRNAs and a plasmid encoding the target gene bearing silent mutations in the siRNA-targeted sequence. Consistent with on-target siRNA effects, P. berghei parasite load was restored to levels similar to control conditions upon gene rescue of COPB2, COPG1 and GGA1 (Figure 2A, S1C). Importantly, host cell viability was not significantly affected under any of these experimental conditions relative to the NT siRNAs control, thus excluding confounding results due to liver cell toxicity (Figure 2B).
Figure 2. Evaluation of the Pro-Infection Hits, COPB2, COPG1 and GGA1.

(A and B) Rescue of P. berghei parasite load in HepG2 cells after COPB2, COPG1 and GGA1 gene knockdown. HepG2 were co-transfected with siRNA and a siRNA-resistant plasmid specific to each candidate gene (i.e. COPB2, COPG1 and GGA1). After incubation for 48 h, cells were infected with P. berghei-Luc (MOI, 0.3). Parasite load (A) and liver cell viability (B) were assessed at 48 h post-infection, respectively. Liver cell viability was not inhibited under the experimental conditions. P-values display one-way ANOVA with Dunnett’s multiple comparison test for each condition compared to control siRNA (Ctrl siRNA). *P < 0.05; ***P < 0.001; ****P < 0.0001. Data are mean ± SEM; n = 2-5 biological replicates.
(C) Huh7 cells were reverse-transfected with siRNAs targeting COPB2, COPG1 and GGA1 (30 nM). After 48 h, cells were infected with P. berghei-Luc (MOI, 0.3) and fixed at 48 h post-infection. Cells were stained with anti-PbUIS4 (red), a PVM resident protein. Nuclei were stained with DAPI (blue). A non-targeting scrambled siRNA was used as a control. Scale bars, 30 μm.
(D) P. berghei parasite size in Huh7 cells transfected with siRNAs targeting COPB2 (n = 20), COPG1 (n = 48) and GGA1 (n = 48) as measured by immunofluorescence microscopy. Cells were fixed at 48 h post-infection and treated as described in (C). PbUIS4 size was measured by microscopy to quantify parasite size. Non-targeting scrambled siRNAs were used as negative controls (n = 101). Three independent experiments were performed, and data are shown as mean ± SEM (red line). Each symbol represents one parasite. *P < 0.05; ***P < 0.001; ****P < 0.0001 (one-way ANOVA, Dunnett’s multiple comparison test).
(E) Rate of P. berghei infection of Huh7 cells transfected with siRNAs targeting COPB2, COPG1 and GGA1. Cells were fixed at 48 h post-infection and treated as described in C. The total number of P. berghei schizonts with PbUIS4 staining in each treatment condition was determined by microscopy. One-way ANOVA P = 0.2696. Data are shown as mean ± SEM; n = 2-3 biological replicates.
We then conducted gene expression analyses to determine whether COPB2, COPG1 or GGA1 were differentially expressed in infected cells. Given the low infection rate of the liver-stage Plasmodium model system (<1%), Plasmodium-infected Huh7 cells were isolated by FACS after infection with GFP-expressing P. berghei sporozoites. Real-time quantitative PCR analyses of P.berghei-infected Huh7 cells at 4, 24 and 48 hpi showed no statistically significant changes in COPB2 and COPG1 expression levels, while GGA1 expression was subtly upregulated only at 4 hpi during liver-stage infection (Figure S1D-E). The phenotype associated with exo-erythrocytic forms (EEFs) upon gene depletion was also analyzed to probe the function of host vesicle transport during liver-stage Plasmodium infection. Immunofluorescence microscopy was used to measure parasite size and numbers in P. berghei-infected Huh7 cells at 48 hpi. We observed that knockdown of COPB2, COPG1 and GGA1 with 10 nM siRNAs led to a significant reduction in EEF size when compared to control NT siRNAs (Figure 2C-D) but had no effect on the parasite infection rate (Figure 2E). Taken together, these results suggest that COPB2, COPG1 and GGA1 are critical host factors for Plasmodium liver-stage development.
3. Inhibitors of the Host Vesicular Transport Impair Plasmodium Development.
A pharmacological approach was also used to study the importance of host vesicular trafficking for liver-stage Plasmodium infection. To date, selective inhibitors of GGA1 or COPI, including β’-COP and γ-COP, have not been developed. However, there are small molecules that inhibit other components of the human vesicle transport pathway. Brefeldin A (BFA) blocks COPI coat assembly by indiscriminately inhibiting guanine nucleotide exchange factors (GEF) (Cherfils and Melancon, 2005; Donaldson et al., 1992; Lippincott-Schwartz et al., 1989), while golgicide A (GCA) targets a specific GEF protein, GBF1 (Saenz et al., 2009). Importantly, no GBF1 Plasmodium homolog can be identified after BLASTP protein sequence searches using PlasmoDB or PubMed. In our assays, we observed that both BFA and GCA reduce P. berghei parasite load in HepG2 and Huh7 cells in a dose-dependent manner. Specifically, BFA and GCA inhibit parasite load in HepG2 cells with IC50 values of 0.97 ± 0.48 μM and 3.3 ± 1.1 μM, respectively (Figure 3A). No significant effect on HepG2 cell viability was observed with either BFA or GCA treatment, but both inhibitors induced cytotoxicity (cell viability < 50%) in Huh7 cells at 10 μM (Figure S2A-B).
Figure 3. Pharmacological Evaluation of Protein Trafficking Inhibition on Liver-Stage Parasite Load.

(A) Dose-response curves for brefeldin A and golgicide A in P. berghei- infected HepG2 (red) and Huh7 (black) cells. Data are mean ± SEM; n = 3-4 biological replicates.
(B) Schematic illustration of the experimental setup (top panel). P. berghei-Luc sporozoites were pretreated with DMSO (vehicle control), 0.5 μM of brefeldin A (BFA) or 3.5 μM of golgicide A (GCA) for 20 minutes at room temperature. Following pretreatment, sporozoites were used to infect HepG2 cells (pretreated SPZ, bottom panel). In parallel, BFA and GCA were added to cells immediately prior to infection (liver-stage, bottom panel). Parasite load was measured at 48 hpi. Data were normalized to the DMSO control and shown as mean ± SEM; n = 4 biological replicates. *P < 0.05, **P < 0.01; ns, non-significant (Student’s t-test).
(C) Effects of golgicide A and brefeldin A on PbUIS4 trafficking to the PVM during early liver-stage schizogony. Representative confocal images of DMSO- (vehicle control), golgicide A-,and brefeldin A-treated Huh7 cells infected with P. berghei sporozoites and fixed at 48 h post-infection. Cells were stained with anti-PbUIS4 (red), anti-PbHSP70 (green), and DAPI (blue) (left). Schematic illustrating the experimental setup (top right). Quantification of the proportion of PbUIS4 positive pixels not overlapping with PbHSP70 pixels in each condition (n = 11-12) (bottom right). ****P < 0.0001 (one-way ANOVA, Dunnett’s multiple comparison test). Scale bars, 10 μm.
(D) Schematic illustration of the experimental setup (top panel). Time-course analysis of golgicide A treatment (3.5 μM) on liver-stage Plasmodium. GCA was added to HepG2 cells infected with P. berghei-Luc sporozoites at 0, 4, 8, 24 or 36 h post-infection. Parasite load was measured at 48 h post-infection. Data are mean ± SEM normalized to corresponding control condition (DMSO, vehicle) for each time point; n=3 biological replicates. **P < 0.01; ns, non-significant (Student’s t-test).
(E) P. berghei-infected HepG2 cells were treated with DMSO (vehicle control) or 3.5 μM golgicide A from 0-48 hpi (DMSO, n = 176; GCA, n = 82) or 8-24 hpi (DMSO, n = 119; GCA, n = 49) and fixed at 48 h post-infection. Cells were stained with anti-PbUIS4, a PVM resident protein, to enable quantification of parasite size by microscopy. Data are mean ± SEM (red line). ****P < 0.0001; ns, non-significant (Kruskal-Wallis test).
Previous reports have shown that BFA can act directly on the parasite by blocking the export of several Plasmodium proteins during the intraerythrocytic parasite stage (Crary and Haldar, 1992; Hanson et al., 2013; Wickham et al., 2001), suggesting BFA-mediated inhibition may arise from modulation of Plasmodium and/or host proteins. To further evaluate this possibility, BFA and GCA1 were tested for the ability to inhibit the parasite’s intraerythrocytic stage. BFA inhibits blood stage parasite growth with an IC50 of 2.1 μM (Figure S2C) while GCA exhibited a weaker activity (IC50 = 19 μM). GCA has a 5.8-fold decrease in potency in the blood stage in comparison to the liver stage. Compounds are predicted to have similar IC50 values when they have the same target in both stages. To further test the GCA molecular target, a phenotypic study was completed. We observed that knockdown of HsGBF1 using siRNAs led to both a decrease in parasite load and smaller EEFs without deleterious effects on cell viability (Figure S3). These observations are consistent with the phenotype after GCA-mediated inhibition of liver-stage P. berghei.
Preincubation studies were completed where P. berghei sporozoites were treated with DMSO, BFA (0.5 μM) or GCA (3.5 μM) for 20 minutes prior to infection, or at the time of infection. BFA pre-treatment of parasites led to a 44% reduction of parasite load in liver cells while GCA pre-treatment did not influence parasite load at 48 hpi. However, when GCA was added at the time of infection the parasite load was significantly reduced with no deleterious effects on infection rate (Figure 3B and Figure S2D-E). To further evaluate the species selectivity of these compounds, we monitored PbUIS4 trafficking to the parasitophorous vacuole membrane (PVM) in P. berghei-infected liver cells following compound treatments from 2 to 8 hpi (Hanson et al., 2013). UIS4 is PVM-resident protein required for parasite survival after invasion. Consistent with the hypothesis that BFA, but not GCA, targets parasite trafficking, we observed that BFA (5 μM) treatment caused accumulation of UIS4 within the parasite soma, while this pathway was unaffected by GCA (10 μM) treatment (Figure 3C). Overall, these results suggest inhibition of host GBF1 with GCA impairs Plasmodium development.
Lastly, we investigated Plasmodium developmental stages sensitive to inhibition of host trafficking. Following GCA treatments at various times post-infection, we observed P. berghei parasite load inhibition at early time points (before mid-to-late schizogony), but not during late stages (Figure 3D). These results suggest a critical role for host trafficking proteins after hepatic invasion and during early schizogony. Indeed, GCA treatment from 8 to 24 hpi is sufficient to recapitulate the phenotypic effects of a 48 hr treatment (Figure 3E).
4. β’-COP and GGA1 are Recruited to Exo-Erythrocytic Forms during Liver-Stage Infection.
With the discovery that COPI- and GGA1-mediated protein trafficking support Plasmodium liver-stage development, we decided to investigate their localization in infected cells. Immunofluorescence microscopy was used to visualize COPI and GGA1 localization throughout P. berghei-infection of Huh7 cells using host-specific antibodies. To visualize the parasite cytoplasm and PVM, antibodies against P. berghei heat shock protein 70 (PbHSP70) and UIS4 were used, respectively. As shown in Figure 4A-B, we observed the accumulation of β-COP and GGA1 around EEFs such that they exhibited colocalization with UIS4 by 48 hpi (Figure 4C). Interestingly, anti-GGA1 staining exhibited a speckled pattern around the EEF at 48 hpi in contrast to the uniform staining with anti-COPB2 at that time point (Figure 4A, Figure S4A). This accumulation of β’-COP and GGA1 around the EEF was also observed in mouse Hepa1-6 cells infected with P. yoelii, suggesting a conserved host-parasite interaction across species in vitro (Figure 4D).
Figure 4. Localization of β’-COP and GGA1 with Exo-Erythrocytic Forms During Liver-Stage Plasmodium Infection.

(A and B) Huh7 cells were infected with P. berghei-Luc sporozoites and fixed at 3, 24 and 48 h post-infection. Cell were stained with anti-β’ COP (A, red) or anti-GGA1 (B, red), and anti-PbHSP70 (green) to visualize Plasmodium. Nuclei were stained with DAPI (blue). Scale bars, 10 μm. See Figure S4A for GGA1-stained uninfected cells at 24 and 48 hpi.
(C) Representative confocal images of P. berghei-infected Huh7 cells at 48 hpi. β’-COP (red, top panel) and GGA1 (red, bottom panel) colocalize with PbUIS4 (green, both panels), a PVM-resident protein. Nuclei were stained with DAPI. Scale bars, 10 μm.
(D) Hepa1-6 cells were infected with P. yoelii sporozoites and fixed at 48 hpi. Cells were stained with anti-β’ COP (red, top panel) or anti-GGA1 (red, bottom panel), and anti-PbHSP70 (green, both panels). Nuclei were stained with DAPI (blue). Scale bars, 20 μm.
Our discovery that vesicular trafficking proteins are recruited to EEFs prompted us to question if their recruitment occurred via a canonical or non-canonical pathway. Because of the more robust immunofluorescence staining obtained with β’-COP during infection, we investigated its distribution upon depletion of GBF1, the upstream effector necessary for membrane recruitment. Surprisingly, β’-COP recruitment to EEFs in P. berghei-infected liver cells at 48 hpi occurs despite GBF1 depletion by siRNA knockdown (Figure S3D). Furthermore, chemical inhibition of GBF1 by GCA, which has been shown to result in dissociation of COPI from membranes (Saenz et al., 2009), did not affect β’-COP recruitment to the PVM at 24 or 48 hpi (Figure S4B). These results suggest that β’-COP recruitment to the PVM may be independent of host GBF1 function.
DISCUSSION
The discovery of host molecular components that are co-opted by liver-stage Plasmodium parasites can provide insights into host-pathogen interactions and potential host-directed targets for drug development. The reported study used a systematic RNA interference screen of the druggable genome to investigate possible roles of host processes in Plasmodium liver-stage development. The druggable genome was selected to capitalize on the wealth of small molecules available that target library members. Importantly, as potential host targets were identified they could be readily subjected to small molecule inhibition to probe protein function throughout parasite development and to assess druggability.
In our screen, we identified host factors critical to liver-stage Plasmodium infection that are implicated in various biological processes such as protein trafficking, immune response, and cellular development. Our stringent hit selection criteria, which favors candidates with strong RNAi effect, might exclude some previously identified gene candidates (Table S3). For example, while our screen identified SCARB1 as a hit (average SSMD score −3.6), the PRKCZ gene, which was characterized by Prudencio, M. and coworkers (2008), did not meet our primary hit selection criteria (average SSMD score −0.8). This highlights the value of our primary dataset for future studies, as it contains data for other many other host genes likely involved in Plasmodium infection. Thus, our findings contribute a diversity of host processes that are potentially important to Plasmodium’s liver stage, expanding previous RNAi studies that focused on the role of the host lipoprotein pathway and kinases in infection (Prudencio et al., 2008; Rodrigues et al., 2008).
Among our top screening hits were genes involved in retrograde transport from the Golgi (COPB2 and COPG1) and clathrin-mediated trafficking (GGA1), which have not been previously linked to Plasmodium development. We found that these proteins are essential for proper parasite development within hepatocytes, but not necessary for invasion. Additionally, their recruitment to the PVM was observed in both P. berghei and P. yoelii-infected hepatocytes, suggesting that the co-opting of host vesicle transport pathways may be a conserved feature of Plasmodium species. β’-COP and γ-COP are subunits of the heptameric protein COPI that coats vesicles transporting proteins from the Golgi to the endoplasmic reticulum. GGA1 is one of three monomeric clathrin adaptor proteins (GGA1, 2, 3) involved in vesicle transport between the trans-Golgi network and the endosomal system. Although we did not investigate all COPI and GGA protein family members, our study demonstrates that COPB2, COPG1 and GGA1 act as pro-infection genes, where both genetic depletion of these genes and pharmacological inhibition of their respective trafficking pathways reduce liver-stage P. berghei parasite load and EEF size. These results likely reflect an intricate subversion of the host vesicular sorting machinery by P. berghei during liver infection. Unlike in hepatocytes, coat proteins are not required for cellular trafficking in erythrocytes (Frankland et al., 2006). Thus, this host-parasite interaction is likely specific to liver-stage Plasmodium, where the rapid replication and the large number of parasites requires a greater demand of host resources when compared to the blood-stage.
Although the best described function of COPI vesicles is to mediate vesicle transport from the Golgi to the ER, previous studies have shown an emerging role of COPI in lipid trafficking and homeostasis (Beller et al., 2008; Guo et al., 2008). Indeed, Salmonella depends on COPI-mediated control of host membrane lipid composition for cell invasion, while dengue viruses exploit the COPI system for capsid accumulation in lipid droplets (Iglesias et al., 2015). Unlike other pathogens, Plasmodium does not rely on lipid droplets for its development; yet, it significantly relies on host phosphatidylcholine for PVM integrity and remodeling, as well as growth (Itoe et al., 2014). Because vesicle-mediated trafficking is a proposed mechanism for intracellular lipid trafficking (reviewed in (Vance, 2015)), it is possible that the cellular secretory machinery mediated by anterograde and retrograde transports is responsible for acquisition of these lipids during liver-stage Plasmodium infection. The localization of β’-COP and GGA1 to the PVM at the later stages of infection, at a time when lipid requirements are elevated, hints at a critical role for lipid trafficking in parasite development (reviewed in (Nyboer et al., 2017)). In support of this proposal, our primary screen identified four host genes (Table S1) that are involved in lipid metabolism and trafficking: AP1S1, FDPS, KIF4A and PIK3C2A. Future studies may resolve if the products of these genes interact with COPI or GGA1-mediated trafficking for parasite development.
In our study we utilize GCA as a probe to inhibit host GBF1 function. We observed that 1) knockdown of GBF1 phenocopies GCA-mediated inhibition of liver-stage parasite growth, 2) GCA has a reduced potency in the blood stage when compared to the liver stage, and 3) GCA does not impair UIS4 export during the liver stage. While this data supports a host-mediated mode of action for GCA during Plasmodium’s liver stage, we were unable to use genetic approaches to validate this proposal. We were not successful in generating a stably overexpressing GBF1 liver cell line due to the resulting cell toxicity (Kawamoto et al., 2002). Additionally, experiments with liver cells transiently overexpressing GBF1 were inconclusive due to a low transfection efficiency coupled with the low parasite infection rate (<0.5%) of our in vitro model system. To reduce confounding data interpretations, we completed all our mechanistic studies at concentrations below the blood stage IC50. Thus, we suspect GCA has parasite targets at high μM concentrations but attribute its sub-μM liver-stage activity predominantly to host GBF1 inhibition. Species selectivity is often a hurdle for drug development, but off-target parasite inhibition would be a fortuitous occurrence with host-directed antimalarial therapies as it presents a poly-pharmacological approach for multi-stage parasite inhibition.
During the blood-stage infection, Plasmodium parasites actively remodel the host cytosol for nutrient acquisition and immune system evasion through the establishment of complex protein transport mechanisms such as Maurer’s clefts by exporting Plasmodium proteins into the red blood cell cytosol (reviewed in Mundwiler-Pachlatko and Beck, 2013). To our knowledge, mechanisms of parasite protein trafficking beyond the PVM remain poorly studied in infected hepatocytes. Our finding that the localization of β’-COP to the PVM is unaltered despite knockdown of GBF1 and GCA treatment in liver cells suggests a non-canonical pathway for its recruitment to the PVM during infection, perhaps by a parasite effector. Within hepatocytes Plasmodium is known to generate and release proteins into the host cytosol to ensure survival. For example, recent studies have shown that UIS4 (Petersen et al., 2017) and exported protein 1 (Sa et al., 2017) localize the PVM where they may interact with host components. Plasmodium liver-specific protein 2, which is exported in the host cytosol (Orito et al., 2013), not only interacts with host proteins but also plays a critical role in parasite development during the liver stage. Therefore, a rich network of host-parasite interactions likely drives liver-stage Plasmodium development.
In conclusion, we have identified host factors that play a critical role in Plasmodium liver-stage infection using a forward genetic screen. We validated the relevance of our screening hits with a mechanistic study of one pathway identified from our screen – the host protein trafficking pathway. Significantly, our data reveal that the host vesicle-mediated trafficking pathway, which is subverted by various intracellular pathogens, also has an important function in the development of Plasmodium parasites during their exo-erythrocytic stage in liver cells. This important finding stemmed from investigating only a small subset of the human genes identified from our RNAi screen. Other host pathways highlighted by our screen await further investigation to reveal their role during Plasmodium parasite infection. The discovery of diverse host factors that are essential for liver-stage Plasmodium provides novel insights into the intricate biology of the parasite. The rich dataset provided here sets the foundation for future studies to elucidate host-parasite interactions during this stage and supports new research paradigms in drug discovery to modulate host factors for malaria control.
STAR METHODS
CONTACT FOR REAGENT AND RESOURCE SHARING
Further information and requests for resources and reagents should be directed to and will be fulfilled by the Lead Contact, Emily Derbyshire (emily.derbyshire@duke.edu).
EXPERIMENTAL MODEL AND SUBJECT DETAILS
Parasite strains
Plasmodium berghei ANKA strains (i.e. P. berghei-GFP, P. berghei-Luc) and Plasmodium yoelii 17NXL strain (i.e. P. yoelii-GFP) stably expressing a green fluorescent protein (GFP) or luciferase enzyme (Luc) were freshly harvested from dissected salivary glands prior to experiments from infected Anopheles stephensi mosquitoes purchased from the New York University Langone Medical Center Insectary.
Cell lines
Hepa1-6, HepG2 and Huh7 cells were cultured in DMEM (Gibco) supplemented with 10% heat-inactivated FBS (Gibco), 1% antibiotic-antimycotic (Gibco) (i.e. culture medium) and maintained in a standard tissue culture incubator at 37 °C in 5% CO2.
METHOD DETAILS
Druggable-genome RNAi screen
The primary screen was performed in-house using the Qiagen genomic siRNA library v1.0 consisting of four individual siRNAs targeting 6951 known and putative human druggable genes accessible at the Duke Functional Genomics Facility. siRNAs targeting the same gene were pooled in sets of two siRNAs per well in a 384-well plate (i.e. set AB and set CD).
Corning 384-well white wall plates (Cat# 3570) were pre-arrayed with 5 μl of pooled siRNAs per well using a Velocity Bravo liquid handling system (Agilent Technologies) and stored at −80°C until further use. On the day of the experiment, screening plates were seeded with pooled non-targeting scrambled (NT) siRNAs as negative controls and pooled siRNAs targeting SCARB1 (siSCARB1) as positive control. The NT siRNAs and siSCARB1 were obtained from Dharmacon and their sequences are as follows. NT: 5’-AUGUAUUGGCCUGUAUUAG-3’ and 5’-AUGAACGUGAAUUGCUCAA-3’; siSCARB1: 5’-UGACUGGCCUGCACCCUAA-3’ and 5’-GGACAAACUGGGAAGAUUG-3’.
Lipofectamine RNAiMAX (Invitrogen) was added to each well in the amount of 0.15 μL per well in 10 μL of Opti-MEM (ThermoFisher). HepG2 cells (2,000 cells/well) were reverse transfected with 0.6 pmol of siRNAs in 40 μL of total assay volume per well. To reduce potential cytotoxicity associated with reverse transfection, HepG2 cells were resuspended in DMEM supplemented only with 10% heat-inactivated FBS (i.e. platting medium). Microplates were incubated at 37 °C in 5% CO2 for 48 h. Following incubation, media was replaced with fresh culture medium (25 μL/ well) using a multichannel pipettor (Rainin). Cells were infected with freshly harvested P. berghei-Luc sporozoites (3,000 sporozoites/well) 48 hr post-transfection and then centrifuged (500 × g) for 10 min at room temperature. The microplates were incubated at 37 °C in 5% CO2 for 48 h.
After incubation, liver cell viability and P. berghei parasite load were assessed from microplates as follows. First, HepG2 cell viability was determined using CellTiter-Fluor™ (Promega). The relative fluorescence signal intensity was evaluated with an EnVision plate reader (PerkinElmer) and data were normalized to the negative controls. Next, parasite load from the same microplate was assessed using Bright-Glo™ (Promega). Immediately after reagent addition, the relative bioluminescence signal intensity was evaluated with an EnVision plate reader and data were normalized to the negative controls.
Confirmation screen
The secondary or confirmation screen was conducted as described above. siRNAs were purchased from Qiagen, two per gene, and tested as one siRNA per well instead of pooled.
Gene ontology analysis and network pathway visualization
Identified hit genes whose knockdown decreases liver-stage parasite load were uploaded in the ClueGO plug-in (version 2.3.3), implemented in Cytoscape v3.4.0 (http://cytoscape.org/) to generate gene ontology (GO) and pathway enrichment networks. Enriched functionally annotated groups were obtained with the following setting parameters: organism was set to Homo sapiens; the druggable genome was used as reference; the gene ontology terms were accessed from the following ontologies/pathways: Biological Process, Cellular Component (ontology updated 23/02/2017) and Reactome Pathway database (updated 01/03/2017); evidence code was restricted to ‘All_without_IEA’. The GO fusion option was also selected. The significance of each term was calculated with a right-sided hypergeometric test corrected with Benjamini-Hochberg for multiple testing. The kappa score was set to 0.5 and the GO tree levels were restricted at 6-13 (medium-detailed specificity). For GO term selection, a minimum of 3 genes and 8% coverage of the gene population was set. GO terms were grouped with an initial group size of 2 and 50% for group merge. The remaining parameters were set to default. The network was automatically laid out using the organic layout algorithm in Cytoscape.
Evaluation of gene knockdown on liver-stage Plasmodium
To evaluate the effect of gene knockdown on liver-stage P. berghei size, Huh7 cells were reverse-transfected with Lipofectamine RNAiMax (Invitrogen) on coverslips in a 24-well plate with 10 nM final assay concentration of COPB2 siRNA, COPG1 siRNA, GGA1 siRNA, and GBF1 siRNA (pooled, Qiagen siRNA IDs Hs_GBF1_3, Hs_GBF1_4, Hs_GBF1_5). Cells were incubated for 48 h at 37 °C in 5% CO 2, and subsequently infected with freshly harvested P. berghei-Luc sporozoites. Following incubation for 48 h, cells were fixed and stained as described below.
Anti-Plasmodium blood-stage assay
P. falciparum 3D7 parasites were cultured in complete medium (10.44 g/L RPMI 1640 (ThermoFisher Scientific), 25 mM HEPES, pH 7.2, (ThermoFisher Scientific), 0.37 mM hypoxanthine (Sigma), 24 mM sodium bicarbonate (Sigma), 0.5% (wt/vol) AlbuMAX II (ThermoFisher Scientific), 25 μg/ml gentamicin (Sigma)) supplemented with freshly washed human red blood cells. The parasites were maintained at 37 °C under low oxygen tension (3% O2, 5% CO2, 92% N2). Synchronization was performed with 10 ml of 5% D-sorbitol (Sigma) at 37 °C for 10 min during the early ring stage. 200 μl of the ring-stage parasite culture at 2% parasitemia and 1% hematocrit was added into each well of 96-well black plates (Corning) in the presence or absence of brefeldin A or golgicide A (0-75 μM) in triplicate. The plates were incubated at 37 °C for 72 h, followed by adding 40 μl lysis solution (20 mM Tris-HCl, pH 7.5, 5 mM EDTA dipotassium salt dihydrate, 0.16% saponin, 1.6% Triton X-100) containing fresh 10X SYBR Green I (ThermoFisher Scientific) into each well (Kato et al., 2016). The plates were incubated for 24 h, and the fluorescent signals were measured at 535 nm with excitation at 485 nm using an EnVision 2105 plate reader to quantify the relative parasite loads. The EC50 curves were generated using GraphPad Prism from two independent experiments.
Evaluation of protein trafficking inhibitors on liver-stage Plasmodium
To evaluate the effects of brefeldin A and golgicide A on P. berghei parasite load, HepG2 (15,000 cells/well) or Huh7 (7,000 cells/well) were seeded in 384-well white microplates (Corning# 3570, bioluminescence assay) or 384-well black wall microplates with a clear bottom (Corning #3712, microscopy assay). Next, brefeldin A and/or golgicide A (0.3 μL/well) were added just before infection or at various time points post-infection using a multichannel pipettor (Rainin). A final concentration of DMSO (vehicle) was 1% in all wells. Liver cells were infected with either P. berghei-Luc or P. berghei-GFP (3,000 sporozoites/well) and incubated at 37 °C in 5% CO2 for 48 h. Following incubation, the liver cell viability and parasite load in white microplates was evaluated as previously described. In the black wall microplates cells were fixed and stained for microscopy analysis as described below.
Evaluation of protein trafficking inhibitors on P. berghei sporozoites
To evaluate the effects of brefeldin A and golgicide A on P. berghei sporozoite protein trafficking, freshly harvested P. berghei-Luc sporozoites were incubated with either compounds (IC50 concentration) for 20 min at room temperature. Subsequently, the pre-treated sporozoite suspensions (5 μL/well, 6x dilution) were added to HepG2 cells (15,000 cells/well) seeded in a microplate and incubated at 37 microplate and incubated at 37°C in 5% CO2 for 48 h. Following incubation, the liver cell viability and parasite load in white microplates was evaluated as previously described.
Evaluation of protein trafficking inhibitors on PbUIS4 trafficking
To evaluate the effects of brefeldin A and golgicide A on PbUIS4 protein trafficking, Huh7 cells seeded on coverslips were infected with freshly harvested P. berghei-Luc sporozoites. After 2 h at 37 °C in 5% CO2, brefeldin A (5 μM) and golgicide A (10 μM) were added to cells and incubated for 6 h. After incubation, cells were fixed and stained as described below.
Plasmids construction
COPB2, COPG1 and GGA1 were amplified from Huh7 cDNA with Phusion Hot Start II High-Fidelity DNA Polymerase (ThermoFisher) using PCR. ORFs were sequenced (Eton) and subcloned into the XhoI and BamHI sites of pHAHA vector (Addgene).
To generate siRNA-resistant constructs, three silent mutations were introduced in the siRNA_1 target sequence of COPB2 and COPG1 cDNA, and four silent mutations were introduced in the siRNA_1 target sequence of GGA1 cDNA using a QuikChange II Site-Directed Mutagenesis Kit (Agilent Technologies). Silent mutations introduced in siRNA target sequences are underlined as follows. mutCOPB2: ACAGTACGAATATGGCACTCAAGC; mutCOPG1: GACCGAGCAACATTCTATCTAAAT; mutGGA1: AAGGTCGTCTCACCGAAATAT.
Rescue experiments
HepG2 cells (4,000 cells/well) were reverse-transfected with mixtures of siRNA and siRNA-resistant plasmid diluted in transfection buffer and jetPRIME® transfection reagent (Polyplus Transfection) per the manufacturer’s instructions. The mixture (5 μL/well) was added to a 50 nM final assay concentration of siRNA with 60 ng of siRNA-resistant plasmid and 0.22 μl of jetPRIME® transfection reagent. Cells were incubated at 37 °C in 5% CO2 for 48 h. Subsequently, cells were either infected with freshly harvested P. berghei-Luc sporozoites (3,000 sporozoites/well) for bioluminescence evaluation at 48 h post-infection or harvested to extract total RNA for evaluation of mRNA expression levels.
Flow cytometry
To determine the mRNA expression of candidate genes in infected cells, 3 × 10⁶ Huh7 cells were infected with 1 × 10⁶ P. berghei-GFP at various time points. P. berghei-GFP infected cells were isolated by fluorescence activated cell sorting (FACS) using the BD FACSAriaII (BD Biosciences). Infected and uninfected Huh7 cells were sorted at various time points post-infection into lysis buffer (0.2% Triton X-100 + RNAse inhibitor). Sorted cells in lysis buffer were then stored at −80 °C until RNA isolation as descri bed below.
RNA isolation and qRT-PCR
Quantitative reverse transcriptase PCR (qRT-PCR) was used to measure mRNA levels of genes of interest upon siRNA knockdown and after P. berghei parasite infection. Total RNA was extracted from liver cells using Quick-RNA™ MicroPrep per the manufacturer’s instructions (Zymo Research). The first-strand of cDNA was synthesized from ~100 ng of total RNA using random hexamers (Invitrogen) and the GoScript™ reverse transcriptase per the manufacturer’s instructions (Promega). qRT-PCR analysis was performed with the oligonucleotide primers listed in Table S4 and SYBR Green I Master reagents with a LightCycler® 480 Instrument II (Roche Diagnostics). The final volume was 10 μL in a 96-well plate. Cycle threshold (CT) values for analyzed genes were normalized to CT values of the human housekeeping gene 18S rRNA (CT Target − CT18S rRNA = ΔCT). Data were subsequently normalized to baseline control values from NT siRNA treated or uninfected cells (ΔCTexperimental − ΔCTcontrol = ΔΔCT).
Immunofluorescence microscopy
Coverslips:
For immunofluorescence analysis, Hepa1-6 or Huh7 cells were seeded onto coverslips (40,000-50,000 cells/coverslips) and infected with 0.8 - 1 multiplicity of infection (MOI) of Plasmodium (P. berghei or P. yoelii) sporozoites. Cells were fixed at various time points post-infection with 4% paraformaldehyde (PFA) in PBS for 15 mins at room temperature (RT). Cells were then washed 3× (5 min each) in PBS, permeabilized with 0.1% Triton-100X for 10 min at RT, washed 3× (5 min each) in PBS and subsequently blocked with 3% BSA, 0.05% Tween-20 and 0.3 M glycine in PBS (blocking buffer) for 30 min at RT. Cells were stained with 1° antibodies diluted in blocking buffer for 1 h at RT: goat polyclonal anti-COPB2 (Santa Cruz Cat# sc-13332, 1:500), goat polyclonal anti-GGA1 (Santa Cruz Cat# sc-23261, 1:300), goat anti-PbUIS4 (LifeSpan BioScience Cat# LS-C204260, 1:500), mouse anti-PbHSP70 (2E6, 1:1000), mouse monoclonal anti-GGA1 (Santa Cruz Cat# sc-271927, 1:100), mouse monoclonal GBF1 (Santa Cruz Cat# sc-136240, 1:300), Rabbit polyclonal anti-COPB2 (Novus Biologicals Cat# NBP1-88651, 1:100). Following 3× washes with 0.05% Tween-20 in PBS (T-PBS), cells were incubated with 2° antibodies (1:40 0) for 45 mins at RT, washed 3× in T-PBS and incubated with DAPI (1:10,000 dilution in PBS) for 10 min at RT. For all colocalization studies, sequential immunostaining was performed. After 3× washes in PBS, coverslips were mounted with Prolong Gold Antifade (ThermoFisher). Images were acquired on a Zeiss Axio Observer widefield fluorescence microscope or a Zeiss LSM 510 inverted confocal microscope.
384-well plates:
HepG2 cells (10,000 cells/well) were seeded and infected with 0.3 MOI P. berghei sporozoites. Cells were fixed, permeabilized and blocked as described above. Cells were stained with 1° antibodies diluted in blocking buffer for 1 h at RT. Goat anti-PbUIS4 was used at 1:500 (LifeSpan BioScience, Cat# LS-C204260). Following 3× washes with T-PBS, cells were incubated with donkey anti-goat AlexaFluor 568 antibodies (Invitrogen Cat# A-11057, 1:400) for 45 min at RT, washed 3× in T-PBS and incubated with DAPI (1:10,000 dilution in PBS) for 10 min at RT. Stained cells were imaged with a Zeiss Axio Observer widefield fluorescence microscope.
QUANTIFICATION AND STATISTICAL ANALYSIS
The selection of candidate genes from the primary screen was conducted using the robust strictly standardized mean difference (robust SSMD) as implemented in GUItars (Goktug et al.,2012) with the following parameter settings: hit selection method, robust SSMD; hit selection cut-off, 2; outlier threshold, ±2 stdev; maximum percent of points to knockout, 30%. In addition, only genes whose knockdown did not decrease liver cell viability by greater than 50% as compared to control conditions (cell treated with non-targeting siRNAs) where selected as ‘hits.’ For liver cell viability and P. berghei parasite load assays, fluorescence or luminescence values, respectively, were averaged from at least 3 technical replicates and then normalized to values obtained from negative controls to determine percent viability. Analyses of fluorescent microscopy images were conducted with FIJI (Schindelin et al. 2012) to quantify (1) parasite size as determined by the area delimited by PbUIS4 staining, (2) the percent of PbUIS4 present outside of parasite soma as determined by PbUIS4 and PbHSP70 staining and (3) colocalization of COPB2, GGA1 and GBF1 with exo-erythrocytic parasites. For determination of the parasite size, the cut-off of measured particles was set at 10 μm2. Statistical analyses were performed using one-way ANOVA followed by Dunnett’s post-test or unpaired Student t-test. Data are represented as mean ± standard error of mean (SEM). Differences were considered to be significant when P < 0.05. Statistical analyses were done using GraphPad Prism 7.
DATA AND SOFTWARE AVAILABILITY
Raw data from the primary siRNA screen are available upon request to the Lead Contact (emily.derbyshire@duke.edu). Analyzed data can be found in Table S1B. GUItars analysis software (Goktug et al., 2012) can be freely downloaded from http://sourceforge.net/projects/guitar
Supplementary Material
Table S1. Related to Figure 1.
A) 177 genes out of 6951 targeted genes were selected as “hits” following the primary screen using pooled siRNAs (2 per well) in 2×2 format. Rows highlighted in gray indicate genes leading to P. berghei load increase upon knockdown.
B) ClueGO analysis of hits involved in decrease of P. berghei load in HepG2 cells.
C) Fifty-eight hits were selected following the primary screen for validation in a secondary screen using individual siRNAs (1 per well; 2 per gene). Bold selections indicate siRNAs selected for rescue and knockdown experiments.
Table S2. Related to Figure 1: Heat map values following secondary screen.
KEY RESOURCES TABLE
| REAGENT or RESOURCE | SOURCE | IDENTIFIER |
|---|---|---|
| Antibodies | ||
| Goat polyclonal anti-COPB2 | Santa Cruz Biotechnology | Cat# sc-13332; RRID: AB_2081314 |
| Goat polyclonal anti-GGA1 | Santa Cruz Biotechnology | Cat# sc-23261; RRID: AB_2110731 |
| Goat polyclonal anti-PbUIS4 | LifeSpan BioScience, Inc. | Cat# LS-C204260 |
| Mouse monoclonal anti-PbHSP70 (2E6) | Laboratory of Maria M. Mota | N/A |
| Mouse monoclonal anti-GGA1 | Santa Cruz Biotechnology | Cat# sc-271927; RRID: AB_10650276 |
| Mouse monoclonal GBF1 | Santa Cruz Biotechnology | Cat# sc-136240; RRID: AB_2109201 |
| Rabbit polyclonal anti-COPB2 | Novus Biologicals | Cat# NBP1-88651; RRID: AB_11043200 |
| Donkey anti-goat AlexaFluor 568 secondary | Invitrogen | Cat# A-11057 |
| Goat anti-mouse AlexaFluor 488 secondary | Invitrogen | Cat# A-10680 |
| Goat anti-rabbit AlexaFluor 488 secondary | Invitrogen | Cat# A-11008 |
| Goat anti-rabbit AlexaFluor 594 secondary | Invitrogen | Cat# A-31632 |
| Bacterial and Virus Strains | ||
| Biological Samples | ||
| Human Blood | Gulf Coast Regional Blood Center | N/A |
| P. falciparum 3D7 | BEI Resources Repository | NIAID, NIH, MRA-102 |
| P. berghei ANKA infected Anopheles stephensi mosquitoes | NYU Langone Medical Center Insectary | N/A |
| Chemicals, Peptides, and Recombinant Proteins | ||
| Brefeldin A | APExBIO | CAS: 20350-15-6; Cat# B1400 |
| Golgicide A | APExBIO | CAS: 1139889-93-2; Cat# B1385 |
| Qiagen Human Genome siRNA Library v1.0 | Duke Functional Genomics Facility | N/A |
| Dimethyl sulfoxide (DMSO, vehicle) | Sigma-Aldrich | CAS: 67-68-5; Cat# D8418 |
| Critical Commercial Assays | ||
| Bright-Glo™ Luciferase Assay System | Promega | Cat# G6081 |
| CellTiter-Fluor™ Cell Viability Assay | Promega | Cat# E2620 |
| LightCycler® 480 SYBR Green I Master | Roche Diagnostics | Cat# 04707516001 |
| Quick-RNA™ MicroPrep | Zymo Research | Cat# R1050 |
| GoScript™ Reverse Transcriptase | Promega | Cat# A5003 |
| Deposited Data | ||
| Raw and analyzed data | This paper | N/A |
| Experimental Models: Cell Lines | ||
| Human: HepG2 cells | ATCC | HB-8065 |
| Human:Huh7 cells | Laboratory of Peter Sorger | N/A |
| Mouse:Hepa1-6 cells | ATCC | CRL-1830 |
| Experimental Models: Organisms/Strains | ||
| P. berghei-GFP; Strain background: ANKA | NYU Insectary | N/A |
| P. berghei-Luc; Strain background: ANKA | NYU Insectary | N/A |
| P. yoelii-GFP; Strain background: 17XNL | NYU Insectary | N/A |
| Oligonucleotides | ||
| siRNA targeting sequences for hit confirmation, see Table S1C | Qiagen | N/A |
| Primers for siRNA-resistant constructs, see Table S4 | This paper | N/A |
| Primers for qRT-PCR, see Table S4 | This paper | N/A |
| Non-targeting siRNA_1 | Dharmacon | Cat# D-001210-03-05 |
| Non-targeting siRNA_2 | Dharmacon | Cat# D-001210-04-05 |
| SCARB1 siRNA_1 (siSCARB1_1) | Dharmacon | Cat# D-010592-03 |
| SCARB1 siRNA_2 (siSCARB1_2) | Dharmacon | Cat# D-010592-04 |
| Recombinant DNA | ||
| Plasmid: pHAHA | Luu et al., 2005 | Addgene Plasmid #12517 |
| Software and Algorithms | ||
| GUItars | Goktug et al., 2012 | http://sourceforge.net/projects/guitars/ |
| Prism version 7 | GraphPad Software | graphpad.com |
| FIJI | Schindelin et al. 2012 | http://imagej.net/Fiji/Downloads |
| ClueGO | Bindea et al. 2009 | http://apps.cytoscape.org/apps/cluego |
| Other | ||
SIGNIFICANCE.
Malaria, caused by parasites of the genus Plasmodium, continues to burden countries across the globe. Efforts to pharmacologically target malaria parasites have focused on intrinsic parasite pathways; nonetheless, the widespread emergence of drug-resistant parasites underscores the urgent need for novel therapeutic strategies. Here, we investigated the first stage of Plasmodium parasite infection in the human host, the liver stage, to discover host factors essential for pathogen survival. The liver stage remains largely unexplored, but host-parasite interactions likely enable infection. We used a high-throughput RNAi screen to identify hundreds of host liver factors that influence Plasmodium viability. We further validated genes involved in vesicular trafficking, COPG1, COPB2 and GGA1, as critical to Plasmodium development in hepatocytes. Host vesicular trafficking proteins are recruited to the parasite during infection, and small molecules targeting pathway members reduce parasite size. Our work implicates diverse host processes in liver-stage Plasmodium, which may be leveraged to enhance our understanding of this elusive parasite stage as well as develop prophylactic agents for malaria control.
Highlights.
Discovery of diverse host factors involved in Plasmodium liver stage with RNAi HTS
Host vesicular trafficking genes modulate parasite size
Inhibitors of the host trafficking pathway impair Plasmodium infection
COPB2 is recruited to the host-pathogen interface (PVM) during liver infection
ACKNOWLEDGMENTS
We thank Ana Rodriguez and Sandra Gonzalez from the New York University Insectary for providing Plasmodium-infected mosquitoes, So Young Kim and Sufeng Li from the Duke RNAi Screening Facility, the Duke Microscopy Core Facility, and the DHVI Flow Cytometry Core Facility for technical assistance. We thank members of the Derbyshire laboratory for critical reading of this manuscript.
This work was supported by the NIH (DP2AI138239, E.R.D) and the Duke Translational Research Institute Pilot Program (E.R.D) for research support, and the NIH for fellowship support (F32AI118294, R.R.). The content of this study is solely the responsibility of the authors and does not necessarily represent the official views of the NIH.
Footnotes
Publisher's Disclaimer: This is a PDF file of an unedited manuscript that has been accepted for publication. As a service to our customers we are providing this early version of the manuscript. The manuscript will undergo copyediting, typesetting, and review of the resulting proof before it is published in its final citable form. Please note that during the production process errors may be discovered which could affect the content, and all legal disclaimers that apply to the journal pertain.
DECLARATION OF INTERESTS
The authors declare no competing interests.
REFERENCES
- Albuquerque SS, Carret C, Grosso AR, Tarun AS, Peng X, Kappe SH, Prudencio M, and Mota MM (2009). Host cell transcriptional profiling during malaria liver stage infection reveals a coordinated and sequential set of biological events. BMC genomics 10, 270. [DOI] [PMC free article] [PubMed] [Google Scholar]
- Beller M, Sztalryd C, Southall N, Bell M, Jackle H, Auld DS, and Oliver B (2008). COPI complex is a regulator of lipid homeostasis. PLoS biology 6, e292. [DOI] [PMC free article] [PubMed] [Google Scholar]
- Birmingham A, Selfors LM, Forster T, Wrobel D, Kennedy CJ, Shanks E, Santoyo-Lopez J, Dunican DJ, Long A, Kelleher D, et al. (2009). Statistical methods for analysis of high-throughput RNA interference screens. Nature methods 6, 569–575. [DOI] [PMC free article] [PubMed] [Google Scholar]
- Cherfils J, and Melancon P (2005). On the action of Brefeldin A on Sec7-stimulated membrane-recruitment and GDP/GTP exchange of Arf proteins. Biochem Soc Trans 33, 635–638. [DOI] [PubMed] [Google Scholar]
- Crary JL, and Haldar K (1992). Brefeldin A inhibits protein secretion and parasite maturation in the ring stage of Plasmodium falciparum. Mol Biochem Parasitol 53, 185–192. [DOI] [PubMed] [Google Scholar]
- Derbyshire ER, Prudencio M, Mota MM, and Clardy J (2012). Liver-stage malaria parasites vulnerable to diverse chemical scaffolds. Proceedings of the National Academy of Sciences of the United States of America 109, 8511–8516. [DOI] [PMC free article] [PubMed] [Google Scholar]
- Donaldson JG, Finazzi D, and Klausner RD (1992). Brefeldin A inhibits Golgi membrane-catalysed exchange of guanine nucleotide onto ARF protein. Nature 360, 350–352. [DOI] [PubMed] [Google Scholar]
- Douglass AN, Kain HS, Abdullahi M, Arang N, Austin LS, Mikolajczak SA, Billman ZP, Hume JC, Murphy SC, Kappe SH, et al. (2015). Host-based Prophylaxis Successfully Targets Liver Stage Malaria Parasites. Molecular therapy : the journal of the American Society of Gene Therapy 23, 857–865. [DOI] [PMC free article] [PubMed] [Google Scholar]
- Franke-Fayard B, Janse CJ, Cunha-Rodrigues M, Ramesar J, Buscher P, Que I, Lowik C, Voshol PJ, den Boer MA, van Duinen SG, et al. (2005). Murine malaria parasite sequestration: CD36 is the major receptor, but cerebral pathology is unlinked to sequestration. Proceedings of the National Academy of Sciences of the United States of America 102, 11468–11473. [DOI] [PMC free article] [PubMed] [Google Scholar]
- Frankland S, Adisa A, Horrocks P, Taraschi TF, Schneider T, Elliott SR, Rogerson SJ, Knuepfer E, Cowman AF, Newbold CI, et al. (2006). Delivery of the malaria virulence protein PfEMP1 to the erythrocyte surface requires cholesterol-rich domains. Eukaryotic cell 5, 849–860. [DOI] [PMC free article] [PubMed] [Google Scholar]
- Glennon EKK, Dankwa S, Smith JD, and Kaushansky A (2018). Opportunities for Host-targeted Therapies for Malaria. Trends in parasitology. [DOI] [PMC free article] [PubMed] [Google Scholar]
- Goktug AN, Ong SS, and Chen T (2012). GUItars: a GUI tool for analysis of high-throughput RNA interference screening data. PLoS One 7, e49386. [DOI] [PMC free article] [PubMed] [Google Scholar]
- Guo Y, Walther TC, Rao M, Stuurman N, Goshima G, Terayama K, Wong JS, Vale RD, Walter P, and Farese RV (2008). Functional genomic screen reveals genes involved in lipid-droplet formation and utilization. Nature 453, 657–661. [DOI] [PMC free article] [PubMed] [Google Scholar]
- Hanson KK, Ressurreicao AS, Buchholz K, Prudencio M, Herman-Ornelas JD, Rebelo M, Beatty WL, Wirth DF, Hanscheid T, Moreira R, et al. (2013). Torins are potent antimalarials that block replenishment of Plasmodium liver stage parasitophorous vacuole membrane proteins. Proceedings of the National Academy of Sciences of the United States of America 110, E2838–2847. [DOI] [PMC free article] [PubMed] [Google Scholar]
- Iglesias NG, Mondotte JA, Byk LA, De Maio FA, Samsa MM, Alvarez C, and Gamarnik AV (2015). Dengue Virus Uses a Non-Canonical Function of the Host GBF1-Arf-COPI System for Capsid Protein Accumulation on Lipid Droplets. Traffic 16, 962–977. [DOI] [PMC free article] [PubMed] [Google Scholar]
- Itoe MA, Sampaio JL, Cabal GG, Real E, Zuzarte-Luis V, March S, Bhatia SN, Frischknecht F, Thiele C, Shevchenko A, et al. (2014). Host cell phosphatidylcholine is a key mediator of malaria parasite survival during liver stage infection. Cell host & microbe 16, 778–786. [DOI] [PMC free article] [PubMed] [Google Scholar]
- Kawamoto K, Yoshida Y, Tamaki H, Torii S, Shinotsuka C, Yamashina S, and Nakayama K (2002). GBF1, a guanine nucleotide exchange factor for ADP-ribosylation factors, is localized to the cis-Golgi and involved in membrane association of the COPI coat. Traffic 3, 483–495. [DOI] [PubMed] [Google Scholar]
- Kuhbacher A, Emmenlauer M, Ramo P, Kafai N, Dehio C, Cossart P, and Pizarro-Cerda J (2015). Genome-Wide siRNA Screen Identifies Complementary Signaling Pathways Involved in Listeria Infection and Reveals Different Actin Nucleation Mechanisms during Listeria Cell Invasion and Actin Comet Tail Formation. mBio 6, e00598–00515. [DOI] [PMC free article] [PubMed] [Google Scholar]
- Lippincott-Schwartz J, Yuan LC, Bonifacino JS, and Klausner RD (1989). Rapid redistribution of Golgi proteins into the ER in cells treated with brefeldin A: evidence for membrane cycling from Golgi to ER. Cell 56, 801–813. [DOI] [PMC free article] [PubMed] [Google Scholar]
- Moser LA, Pollard AM, and Knoll LJ (2013). A genome-wide siRNA screen to identify host factors necessary for growth of the parasite Toxoplasma gondii. PLoS One 8, e68129. [DOI] [PMC free article] [PubMed] [Google Scholar]
- Mundwiler-Pachlatko E, and Beck H-P (2013). Maurer’s clefts, the enigma of Plasmodium falciparum. Proc. Natl. Acad. Sci. U. S. A. 110, 19987–19994. [DOI] [PMC free article] [PubMed] [Google Scholar]
- Nyboer B, Heiss K, Mueller AK, and Ingmundson A (2017). The Plasmodium liver-stage parasitophorous vacuole: A front-line of communication between parasite and host. International journal of medical microbiology : IJMM. [DOI] [PubMed] [Google Scholar]
- Paczkowski JE, Richardson BC, and Fromme JC (2015). Cargo adaptors: structures illuminate mechanisms regulating vesicle biogenesis. Trends Cell Biol 25, 408–416. [DOI] [PMC free article] [PubMed] [Google Scholar]
- Posfai D, Sylvester K, Reddy A, Ganley JG, Wirth J, Cullen QE, Dave T, Kato N, Dave SS, and Derbyshire ER (2018). Plasmodium parasite exploits host aquaporin-3 during liver stage malaria infection. PLoS pathogens 14, e1007057. [DOI] [PMC free article] [PubMed] [Google Scholar]
- Prudencio M, and Mota MM (2013). Targeting host factors to circumvent anti-malarial drug resistance. Current pharmaceutical design 19, 290–299. [DOI] [PubMed] [Google Scholar]
- Prudencio M, Rodrigues CD, Hannus M, Martin C, Real E, Goncalves LA, Carret C, Dorkin R, Rohl I, Jahn-Hoffmann K, et al. (2008). Kinome-wide RNAi screen implicates at least 5 host hepatocyte kinases in Plasmodium sporozoite infection. PLoS pathogens 4, e1000201. [DOI] [PMC free article] [PubMed] [Google Scholar]
- Raphemot R, Posfai D, and Derbyshire ER (2016). Current therapies and future possibilities for drug development against liver-stage malaria. The Journal of clinical investigation 126, 2013–2020. [DOI] [PMC free article] [PubMed] [Google Scholar]
- Rodrigues CD, Hannus M, Prudencio M, Martin C, Goncalves LA, Portugal S, Epiphanio S, Akinc A, Hadwiger P, Jahn-Hofmann K, et al. (2008). Host scavenger receptor SR-BI plays a dual role in the establishment of malaria parasite liver infection. Cell host & microbe 4, 271–282. [DOI] [PubMed] [Google Scholar]
- Rodrigues T, Prudencio M, Moreira R, Mota MM, and Lopes F (2012). Targeting the liver stage of malaria parasites: a yet unmet goal. Journal of medicinal chemistry 55, 995–1012. [DOI] [PubMed] [Google Scholar]
- Saenz JB, Sun WJ, Chang JW, Li J, Bursulaya B, Gray NS, and Haslam DB (2009). Golgicide A reveals essential roles for GBF1 in Golgi assembly and function. Nature chemical biology 5, 157–165. [DOI] [PMC free article] [PubMed] [Google Scholar]
- Sigoillot FD, and King RW (2011). Vigilance and validation: Keys to success in RNAi screening. ACS chemical biology 6, 47–60. [DOI] [PMC free article] [PubMed] [Google Scholar]
- Tarun AS, Peng X, Dumpit RF, Ogata Y, Silva-Rivera H, Camargo N, Daly TM, Bergman LW, and Kappe SH (2008). A combined transcriptome and proteome survey of malaria parasite liver stages. Proceedings of the National Academy of Sciences of the United States of America 105, 305–310. [DOI] [PMC free article] [PubMed] [Google Scholar]
- Vance JE (2015). Phospholipid synthesis and transport in mammalian cells. Traffic 16, 1–18. [DOI] [PubMed] [Google Scholar]
- Watanabe T, Kawakami E, Shoemaker JE, Lopes TJ, Matsuoka Y, Tomita Y, Kozuka-Hata H, Gorai T, Kuwahara T, Takeda E, et al. (2014). Influenza virus-host interactome screen as a platform for antiviral drug development. Cell host & microbe 16, 795–805. [DOI] [PMC free article] [PubMed] [Google Scholar]
- Wickham ME, Rug M, Ralph SA, Klonis N, McFadden GI, Tilley L, and Cowman AF (2001). Trafficking and assembly of the cytoadherence complex in Plasmodium falciparum-infected human erythrocytes. EmBo J 20, 5636–5649. [DOI] [PMC free article] [PubMed] [Google Scholar]
- Yalaoui S, Huby T, Franetich JF, Gego A, Rametti A, Moreau M, Collet X, Siau A, van Gemert GJ, Sauerwein RW, et al. (2008). Scavenger receptor BI boosts hepatocyte permissiveness to Plasmodium infection. Cell host & microbe 4, 283–292. [DOI] [PubMed] [Google Scholar]
- Zhang XD (2007). A pair of new statistical parameters for quality control in RNA interference high-throughput screening assays. Genomics 89, 552–561. [DOI] [PubMed] [Google Scholar]
- Zhang XD, Lacson R, Yang R, Marine SD, McCampbell A, Toolan DM, Hare TR, Kajdas J, Berger JP, Holder DJ, et al. (2010). The use of SSMD-based false discovery and false nondiscovery rates in genome-scale RNAi screens. Journal of biomolecular screening 15, 1123–1131. [DOI] [PubMed] [Google Scholar]
Associated Data
This section collects any data citations, data availability statements, or supplementary materials included in this article.
Supplementary Materials
Table S1. Related to Figure 1.
A) 177 genes out of 6951 targeted genes were selected as “hits” following the primary screen using pooled siRNAs (2 per well) in 2×2 format. Rows highlighted in gray indicate genes leading to P. berghei load increase upon knockdown.
B) ClueGO analysis of hits involved in decrease of P. berghei load in HepG2 cells.
C) Fifty-eight hits were selected following the primary screen for validation in a secondary screen using individual siRNAs (1 per well; 2 per gene). Bold selections indicate siRNAs selected for rescue and knockdown experiments.
Table S2. Related to Figure 1: Heat map values following secondary screen.
Data Availability Statement
Raw data from the primary siRNA screen are available upon request to the Lead Contact (emily.derbyshire@duke.edu). Analyzed data can be found in Table S1B. GUItars analysis software (Goktug et al., 2012) can be freely downloaded from http://sourceforge.net/projects/guitar