

SUMMARY
IFN-γ, critical for host defense and tumor surveillance, requires tight control of its expression. Multiple cis-regulatory elements exist around Ifng along with a non-coding transcript, Ifng-as1 (also termed NeST). Here, we describe two genetic models generated to dissect the molecular functions of this locus and its RNA product. DNA deletion within the Ifng-as1 locus disrupted chromatin organization of the extended Ifng locus, impaired Ifng response and compromised host defense. Insertion of a polyA signal ablated the Ifng-as1 full-length transcript and impaired host defense, while allowing proper chromatin structure. Transient knockdown of Ifng-as1 also reduced IFN-γ production. In humans, discordant expression of IFNG and IFNG-AS1 was evident in memory T cells, with high expression of this lncRNA and low expression of the cytokine. These results establish Ifng-as1 as an important regulator of Ifng expression, as a DNA element and transcribed RNA, involved in dynamic and cell state-specific responses to infection.
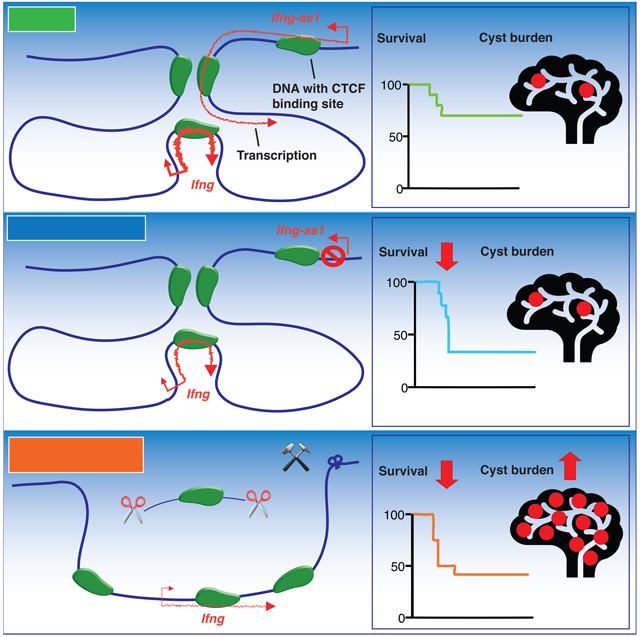
Graphical Abstract
eTOC
Petermann et al. report that the long non-coding RNA locus Ifng-as1 is an important regulator of Ifng. It does so through its role as a modifier of DNA structure, but also through transcription of the IncRNA itself, which is involved in dynamic and cell state-specific regulation of IFN-g-mediated host defense.
INTRODUCTION
Gene expression in vertebrates is controlled in a complex, dynamic, and temporally-regulated manner to affect development and maintain homeostasis. This is especially the case in immune responses, which require exquisite coordination of cell-specific regulatory circuits that drive rapid expression of a vast array of genes to eliminate microbial pathogens, while simultaneously limiting host damage (Smale et al., 2013). Cytokines are key secreted regulators of immunity, whose genes exemplify this complex, cell-specific regulation of expression. Interferon gamma (IFN-γ) is a major immunoregulatory cytokine predominantly produced by T cells and innate lymphoid cells. IFN- γ has both, pro- and anti-inflammatory functions, uniquely regulating pathways involved in host defense and tumor surveillance (Schroder et al., 2004). Patients with impaired production of IFN-γ or mutations of the IFN-γ receptor are more susceptible to mycobacterial and viral infections (Bustamante et al., 2014; Huang et al., 2007; Jouanguy et al., 1996; Newport et al., 1996). However, IFN- γ can either exacerbate or ameliorate autoimmune pathology, depending on disease or biological context (Lees, 2015). Therefore, the expression of Ifng needs to be tightly regulated to ensure proper pathogen clearance, while not contributing to immunopathogenesis.
Gene expression is controlled by transcription factors binding to promoters as well as to proximal regulatory elements. However, we now appreciate the functions of distal regulatory elements that contribute to the dynamic and cell-specific control of key genes. Distal elements, such as enhancers, silencers and insulators co-operate with promoters and proximal elements to ensure a coordinated expression of their target genes, thereby controlling cell fate and phenotype. In addition, a large proportion of the human and mouse genome is transcribed as noncoding RNAs (ncRNAs) (Derrien et al., 2012; Djebali et al., 2012). These ncRNAs include microRNAs, which are critical elements in regulating immune responses (O’Connell et al., 2010) and long noncoding RNAs (lncRNAs), which comprise long intergenic noncoding RNA (lincRNA), intronic, natural antisense transcripts, or transcribed products from divergent enhancers and promoters. Estimates for the number of lncRNA loci in the human genome range from 10,000 to over 100,000 (Consortium et al.; Zhao et al., 2016).
Although lncRNAs have been identified in virtually all immune cells, their functions in these cells are only beginning to emerge (Atianand et al., 2017; Guttman et al., 2009). In establishing the function of a lncRNA, one of the first critical questions is whether the lncRNA regulates the expression of adjacent (cis) or distal (trans) protein coding genes. Evidence suggests that antisense lncRNA loci are typically co-expressed with and regulate their neighboring genes in cis, thus creating a linked transcriptional unit (Katayama et al., 2005). Within a transcriptional unit, however, it remains challenging to establish whether transcription at the non-coding locus reflects enhancer activity of the underlying genomic sequence with the generated transcript being a dispensable by-product or whether the transcript itself functions to regulate target gene expression. For some lncRNA loci the RNA product has little or no sequence-specific function (Engreitz et al., 2016), whereas knockdown of other ncRNAs by siRNA or antisense oligonucleotides results in decreased target gene expression (Cheng et al., 2019). Knockdown studies further show that some ncRNAs enhance the expression of neighboring genes by recruiting RNA polymerase II to the gene promoter (Ivaldi et al., 2018), by inducing or strengthening enhancer-promoter looping (Li et al., 2013) or by recruiting histone modifying enzymes (Wang et al., 2011). It has also been observed that some ncRNAs regulate the genes adjacent to their endogenous locus even when overexpressed from a distal site, thus acting in cis by a trans mechanisms (Gomez et al., 2013).
Generation of congenic mice produced by backcrossing of B10.S versus SJL mice led to the identification of a locus, termed Tmevp3, that influenced susceptibility to Theiler’s virus (Bihl et al., 1999; Bureau et al., 1993). Tmevp3 includes 3 protein coding genes (Ifng, Il22 and Mdm1) and the lncRNA locus Tmevpg1. It was proposed that Tmevpg1 was a potential candidate gene for the Tmevp3 ‘virus susceptibility’ locus (Vigneau et al., 2003). However, there are nearly 100 polymorphisms within the 550 kb spanning Tmevp3 locus that differ between B10.S and SJL, with nearly two dozen residing within in the Tmevgp1 locus (54 kb), providing uncertainty as to the genetic nature of the susceptibility. Transgenic overexpression of Tmevpg1 (also termed NeST, now officially designated as Ifng-as1)in mice was associated with resistance to bacterial infection, and overexpression in 293T cells showed that Ifng-as1 complexes with the chromatin modifying enzyme WDR5 (Gomez et al., 2013). The human IFNG locus also encompasses a lncRNA termed IFNG-AS1, and siRNA targeting of IFNG-AS1 reduced IFNG transcription (Collier et al., 2012). Based on the nature of the approaches, the findings suggest that the Ifng-as1/IFNG-AS1 RNAs act as a sequence-specific trans-acting factors that regulate Ifng transcription possibly by recruiting chromatin modifiers. However, aside from transgenic overexpression approaches, the in vivo functions of Ifng-asl have not been determined by genetically targeting this lncRNA gene in mice. Such loss-of-function approaches are necessary to evaluate the requirements of the endogenous Ifng-as1 in the regulation of IFN-γ production during various immune responses.
Given the centrality of IFN-γ in host defense and cancer immunotherapy, we generated two genetic models to better understand requisite in vivo functions of Ifng-as1: one model disrupts the Ifng-as1 locus, and hence both DNA structure and RNA production, and a second that only interferes with Ifng-as1 RNA transcription. By comparing Ifng-as1 knock-out (KO) (DNA + RNA product deletion) and Ifng-as1-PolyA knock-in (KI) (RNA deletion) mice, we sought to determine whether Ifng-as1’s functions are primarily mediated by its transcript or whether the Ifng-as1 DNA locus is relevant in providing regulatory elements that impact Ifng. In related experiments, we also analyzed the impact of knocking down (KD) the lncRNA transcript in vitro. We show that proper formation of the local chromatin organization is a critical part of Ifng-as1’s function with respect to the regulation of Ifng expression. However, optimal control of Ifng expression requires the Ifng-as1 transcription as well. We show that these two components of Ifng-as1 are required for mounting effective host defense in vivo. Furthermore, we show discordant expression of low Ifng and high Ifng-as1 transcripts in antigen-experienced memory T cells in human. Therefore, the Ifng-as1 locus is an important regulator of proper Ifng gene organization and expression through its role as a DNA structure, but also through transcription of the lncRNA itself, which is involved in dynamic and cell state-specific regulation of IFN-γ- mediated host defense.
RESULTS
Reduced Ifng production in Ifng-as1 KO mice
Previous data have shown that Ifng-as1/IFNG-AS1 is expressed in mouse and human Th1 cells and positively regulate Ifng expression (Collier et al., 2012; Gomez et al., 2013; Vigneau et al., 2003). In agreement with these previous findings, RNA sequencing of fully in vitro differentiated Th1 and Th2 cells revealed co-expression of Ifng and Ifng-as1 in Th1 cells (Figure 1A). Analyzing the epigenetic landscape of the Ifng and Ifng-as1 loci we also detected the presence of histone marks indicative of activated or poised chromatin states (Histone 3 K36me3, K4m1, K27Ac), the absence of repressive marks (H3K27me3), and binding of the Th1-associated transcription factor T-bet at both loci in Th1 cells but not Th2 cells (Figure 1A). In addition, we found that Ifng-as1 expression was decreased by IFN-γ-neutralizing antibodies but enhanced by exogenous IFN-γ (Figure S1A), indicating a positive feedback mechanism.
Figure 1: Reduced Ifng expression in Ifng-as1 KO Th1 cells and Ifng-as1 KO NK cells.

(A) Genome track view of the Ifng locus showing RNA sequencing, H3K36 trimethylation, H3K4 monomethylation, H3K27 trimethylation, H3K27 acetylation for WT Th1 and Th2 cells and Tbet binding for Th1 cells. (B)-(D) Naïve T cells from WT mice or Ifng-as1 KO mice were isolated by FACS and cultured under Th1 (B)(C) or Th2 (D) polarization conditions for up to 8 days. (B) IFN-γ expression was analyzed by flow cytometry on day 6 of Th1 culture. Shown are representative flow cytometry plots and cumulative data from n=12 independent experiments. (C) Ifng expression on day 6 of Th1 culture was analyzed by RT-qPCR and normalized to the expression of β-actin. (D) IL-13 expression was analyzed by flow cytometry at day 6 of Th2 culture. Shown are representative flow cytometry plots and cumulative data from n=12 independent experiments. (E) Splenocytes from WT mice or Ifng-as1 KO mice were isolated and cultured in the presence of IL-12 and IL-2 for 6 hours. IFN- γ expression in NKp46+ NK cells was measured by flow cytometry. Shown are representative flow cytometry plots and cumulative data from n=4 independent experiments. (F) Volcano plot showing log2 fold changes in RNA expression between WT and Ifng-as1 KO Th1 cells (d6 of culture) and their associated p-values. A gene was identified as significantly changed (green dots) if the log2 fold change was greater than 2 and the p-value less than 0.01. Box plots in (B), (D), and (E) show minimum, median and maximum. Graph in (C) shows mean ± sem. *p<0.05 **p<0.01 ***p<0.001. See also Figure S1 and S2.
To better understand the in vivo requirements for Ifng-as1, we first generated Ifng-as1 KO mice, in which we deleted a 30 kb DNA fragment containing the first exon and the first intron of Ifng-as1 (Figure S1B). Ifng-as1 KO mice were born at the expected Mendelian frequency and developed normally. Analysis of T cell populations in the thymus and lymph node and innate lymphoid cells (ILC) in the small intestinal lamina propria also revealed no differences between WT and Ifng-as1 KO mice (Figure S2A-C). We performed RNA sequencing of WT and Ifng-as1 KO Th1 cells (day 6 of culture) and found only two differentially expressed genes; Ifng and Ifng-asl itself, arguing strongly that Ifng-asl acts predominantly if not solely on Ifng (Figure 1F).
Next, we differentiated naïve T cells from WT and Ifng-as1 KO mice in vitro into Th1, Th2, Th9 and Th17 effector cells. While we could not detect any differences in cell proliferation (Figure S2F, G) or production of Th2, Th9, or Th17-associated cytokines (Figure 1D and S2D), we noted significant reduction in IFN-γ in Ifng-as1 KO Th1 cells compared to WT Th1 cells (Figure 1B, 1C, S1C). We also observed reduced Ifng expression in CD8+ T cells, γδ T cells and NK cells, which suggests that the Ifng-as1 locus is a common regulator in innate and adaptive immune cells (Figure 1E and S2E).
Ifng-as1 is essential for normal type 1-mediated host defense
We next sought to explore the in vivo function of Ifng-as1. Originally, Ifng-as1 (Tmevpgl) was identified as a susceptibility locus for Theiler’s virus-induced demyelinating disease, a murine model used to mimic some features of multiple sclerosis (Lipton, 1975). Another mouse model for multiple sclerosis is experimental autoimmune encephalomyelitis in which IFN-γ has been reported to be protective in acute disease. We found that Ifng-as1 KO mice had comparable levels of pathology as WT mice (Figure S3A). Adoptive transfer colitis is a model of cell-mediated autoimmunity in which both IFN-γ and IL-17 contribute to pathology. However, we found that pathology was similarly inducible by cells from either WT or Ifng-as1 KO mice (Figure S3B).
Since we saw no significant impact of Ifng-as1 deletion in autoimmunity models, we next tested an infection model, as transgenic overexpression of Ifng-as1 was reported to be associated with reduced susceptibility to Salmonella enterica via effects on IFN-γ production (Gomez et al., 2013). Toxoplasma gondii, is a parasite whose elimination is highly dependent upon IFN-γ and has been widely used to identify factors that influence IFN-γ and its actions (Yap and Sher, 1999). Ifng-as1 KO mice exhibited decreased survival compared to WT mice following infection (Figure 2A). The decreased survival rate was accompanied by reduced serum IFN-γ levels in the Ifng-as1 KO mice in the presence of equivalent levels of IL-12 (Figure 2B, C). Moreover, those Ifng-as1 KO mice that survived had a higher parasitic cyst burden in the brains compared to WT mice indicating that Ifng-as1 is important to control Ifng expression during both the acute and the chronic phases of T. gondii infection (Figure 2D). Thus, these data indicate process-specific functions of Ifng-as1 during strictly IFN-γ-dependent inflammatory states in vivo such as Toxoplasma gondii infection. Taken together, our in vitro data show that the Ifng-as1 locus is an important regulator for IFN-γ, although not obligatory for Ifng transcription per se. However, in terms of host defense against a model pathogen whose elimination is mainly mediated by IFN-γ, Ifng-as1 is clearly required for efficient protection.
Figure 2: Reduced survival and higher parasitic cyst burden in Ifng-as1 KO mice upon Toxoplasma gondii infection.

WT or Ifng-as1 KO mice were infected with 25 cysts of T. gondii (ME49 strain). Shown are pooled data from n=3 independent experiments. (A) Mice were monitored for survival. (B) Serum IL-12 levels were measured on day 8 after infection. (C) Serum IFN-γ levels were measured on day 8 after infection. (D) On day 60 of infection the number of parasitic cysts in the brain of each mouse was counted. Graphs in (B)-(D) show mean ± sem. *p<0.05 ***p<0.001. See also Figure S3.
Locally restricted and context-dependent effects of the Ifng-as1 RNA on Ifng transcription
By deleting 30 kb of the Ifng-as1 gene, we not only deleted a DNA fragment that possibly contained relevant cis-regulatory elements, but we also perturbed the transcriptional activity at this locus and abolished the full-length Ifng-as1 transcript itself. To assess the relative contributions of Ifng-as1 RNA versus the Ifng-as1 locus per se, we generated a second Ifng-as1 deficient mouse, in which we incorporated a BGH (bovine growth hormone) poly A terminator sequence 70 base pairs after the transcription start site, resulting in premature termination of Ifng-as1 transcription without disrupting the local chromatin architecture (Figure S4A). The insertion site was chosen to avoid disruption of potentially important regulatory elements including CTCF, T-bet and STAT binding while terminating Ifng-as1 transcription after a very short stretch (Figure S4B). We confirmed that full- length Ifng-as1 transcript was undetectable in T cells from Ifng-as1-PolyA KI mice. Using primer pairs targeting multiple exon/exon boundaries, we detected Ifng-as1 transcripts from the KI locus as well as from the KO locus, indicating the presence of multiple transcription initiation sites throughout the locus and thus, shorter products in both models (Figure S4C).
Ifng-as1-PolyA KI mice, were born at the expected Mendelian ratio and exhibited no overt phenotype (Figure S4). Analysis of T cell populations in the thymus and lymph node revealed no differences between WT and Ifng-as1-PolyA KI mice (Figure S4A, B). Also, we were unable to detect any differences in cell proliferation or the production of Th2, Th9, or Th17-associated cytokines (Figure S4C-E, G, H). Differentiating naive CD4+ T cells from WT, Ifng-as1 KO and Ifng-as1-PolyA KI mice under Th1 conditions, we observed that IFN-γ protein expression measured by flow cytometry was not significantly different in Ifng-as1-PolyA KI Th1 cells compared to WT cells (Figure 3A, B). However, Ifng-as1-PolyA KI cells expressed Ifng RNA at significantly lower levels than WT mice but at higher levels than Ifng-as1 KO Th1 cells (Figure 3C). The IFN-γ production in NK cells was similar in WT and Ifng-as1-PolyA KI mice (Figure S4F).
Figure 3: Absence of Ifng-as1 RNA leads to small reduction in Ifng expression and impaired survival during Toxoplasma gondii infection.

(A-C) Naïve T cells from WT mice, Ifng-as1 KO, and Ifng-as1-PolyA KI mice were isolated by FACS and cultured under Th1 or Th2 polarization conditions for 6 days. (A)(B) IFN-γ was analyzed by flow cytometry. Shown are representative flow cytometry plots and cumulative data from n=8 independent experiments. (C) Ifng expression was analyzed by RT-qPCR and normalized to the expression of β-actin. (D) WT mice, Ifng-as1 KO mice, and Ifng-as1-PolyA KI mice were infected with 25 cysts of T. gondii (ME49 strain) and monitored for survival. (E) On day 60 of T. gondii infection the number of cysts per brain was counted. Shown are pooled data from n=2 independent experiments. Box plots in (B) show minimum, median and maximum. Graphs in (C) and (E) show mean ± sem. *p<0.05 **p<0.01 ***p<0.001. See also Figure S4 and S5.
While insertion of the polyA sequence after the TSS minimally modified the DNA sequence, unintended outcomes cannot be excluded. Also, the polyA insertion does not allow to distinguish between effects caused by loss of the transcript itself versus effects caused by halting transcription at this locus. Therefore, as a third approach, complementing the findings from KO and KI mice, we knocked down Ifng-as1 RNA levels in T cells using LNA/Gapmers, but allow unperturbed transcription at the locus. Here, we observed reduced Ifng expression (Figure S5I, J). These data collectively indicate that the findings from the Ifng-as1-PolyA KI model can be interpreted as evidence for the functional relevance of the Ifng-as1 transcript; although, these data do not exclude the possibility that the act of transcription through Ifng-asl can also contribute.
To determine in vivo consequences of the polyA sequence insertion into the Ifng-as1 locus, we infected WT, Ifng-as1 KO and Ifng-as1-PolyA KI mice with T. gondii. Ifng-as1-PolyA KI mice showed a lower survival rate compared to WT mice in the acute phase of infection, whereas cyst burden in the chronic phase was comparable between Ifng-as1-PolyA KI and WT mice. The results indicate that the Ifng-as1 transcript is necessary for proper expression of Ifng, especially in acute, in vivo situations in which high levels of IFN-γ are required (Figure 3D, E). Deficits in host defense responses seen in Ifng-as1-PolyA KI and Ifng-as1 KO mice, albeit to different degrees, suggested that both, transcription through the Ifng-as1 locus, including the resultant transcript, and the Ifng-as1 DNA sequence contribute in shaping a maximal IFN-γ response during infection.
Disturbed chromatin architecture at the extended Ifng/Ifng-as1 loci in Ifng-as1 KO cells
Our data indicated that the Ifng-as1 locus contains multiple potential DNA regulatory elements that impact Ifng expression. Previous work has suggested that the Ifng locus may be insulated from neighboring genes by CTCF binding boundary elements −70 kb upstream and +66 kb downstream of the Ifng TSS (Sekimata et al., 2009). In Th1 cells, both of the CTCF sites (−70 kb and +66 kb) interact with a CTCF site within the Ifng gene body (intron 1, +1 kb). The Ifng-as1 locus spans from +111 kb to + 56 kb downstream of Ifng, thus encompasses the +66 kb CTCF site. In addition to this CTCF site, we found another prominent CTCF site within the first intron of Ifng-as1 (+95 kb).
To better define the chromatin topology of the Ifng/Ifng-as1 loci, we used local in situ Hi-C assays (Sanborn et al., 2015) and found that the Ifng locus resides within a chromatin interaction domain larger than previously recognized (Figure 4A). On the 5’ end, this domain is bounded by CTCF sites within the Mdml gene (−287 kb downstream of Ifng). Visual inspection of the Hi-C matrices and quantitative assessment of the strength of boundary formation (directionality index) revealed that the 3’ end of the Ifng domain is defined by both CTCF sites located within the Ifng-as1 locus (the +66 kb and +95 kb sites, Figure 4A, yellow and purple bar).
Figure 4: Disturbed chromatin architecture at the extended Ifng/Ifng-as1 loci in Ifng-as1 KO Th1 cells.

In vitro polarized Th1 cells (day 6 of culture) from WT mice and Ifng-as1 KO mice were subjected to local Hi-C targeting an approximately 1 Mb large sequence containing the Ifng and Ifng-as1 loci. Shown are pooled data from n=4 independent experiments. (A)(B) Shown are contact matrices, CTCF ChIP-seq profiles and average directionality index values for the extended Ifng/Ifng-as1 loci in WT (A) and Ifng-as1 KO (B) Th1 cells. Blue and red arrows indicate orientation of CTCF sites. Blue and red numbers indicate distance of CTCF sites to Ifng TSS. (C) Shown are contact matrices (ratio KO versus WT) and CTCF ChIP-seq profiles. Arrows indicate CTCF binding site orientation. (D)(E) The interactions in the domain surrounding Ifng (“I”) and in the one situated upstream (telomeric) of Ifng-as1 (“II”) were quantified by local Hi-C. For both regions, the per-bin log2 ratios were computed. The significance of the deviation of the above derived ratios from 0 was evaluated with a two-sided t-test. See also Figure S6
We next assessed chromatin conformation in Ifng-as1 KO cells, in which the 5’ end of Ifng-as1 (+111 kb to +81 kb relative to Ifng TSS, purple bar), including the +95 kb CTCF site, is absent (Figure 4B, purple bar). Importantly, the overall formation of chromatin domains was largely preserved throughout the genome segment examined, encompassing the Mdm1, Il22, Iltifb, Ifng, Ifng-as1 and Dyrk2 genes. The perturbation did not abolish formation of the chromatin boundary at the 3’ end of the Ifng/Ifng-as1 loci either (yellow boxes, Figure 4A, B), but resulted in a truncation of the boundary region. The fact that the 3’ boundary at the IfngHfng-as1 loci in the KO cells consists of a single CTCF binding site as opposed to two CTCF sites in WT cells that participate in the insulation, led us to hypothesize that the separation between adjacent chromatin domains at the extended Ifng/Ifng-as1 loci is likely impaired in the KO condition. We speculate that weakening of this boundary disrupts organization of normal chromatin interactions that orchestrate Ifng expression. And indeed, we observed significantly more interactions crossing the 3’ boundary at the extended Ifng/Ifng-as1 loci (Figure 4C, D (region II)) consistent with the reduced contact insulation observed in KO cells. Furthermore, we observed fewer contacts in a domain surrounding Ifng (−70 kb to +66 kb, region I) in KO cells compared to WT cells (Figure 4C, D (region I)). Therefore, we conclude that deletion of the DNA segment containing the +95 CTCF site weakened total insulation strength at this chromatin boundary, leading to aberrant chromatin interactions and impaired Ifng expression in Ifng-as1 KO cells. Interestingly, aberrant enhancement of interactions in region II was not associated with higher expression of genes located upstream of Ifng-as1, indicating that the formation of ectopic chromatin loops by itself is not sufficient to induce aberrant gene expression (Figure S6A).
To explore whether the Ifng-as1 transcript participates in shaping the local chromatin architecture, we also analyzed the chromatin architecture in Ifng-as1-PolyA KI cells. Here, we found equivalent chromatin interactions within the extended Ifng/Ifng-as1 loci in WT and Ifng- as1-PolyA KI cells, despite the absence of the Ifng-as1 transcript and transcription in the latter (Figure S6B-D). Taken together, these results demonstrate that the Ifng-as1 locus is critical for ensuring proper local chromatin architecture that is requisite but not by itself sufficient for maximal IFN-γ production. The Ifng-as1 transcript further contributes to the regulation of Ifng expression on top of the properly formed local chromatin architecture.
Deletion within Ifng-as1 disrupts chromatin interactions in the extended Ifng/Ifng-as1 loci despite preservation of chromatin accessibility and CTCF binding
The more dramatic in vitro and in vivo phenotypes of Ifng-as1 KO mice versus Ifng-as1-PolyA KI mice suggested that the Ifng-as1 locus not only transcribes an RNA that influences Ifng expression but is also important as a cis-regulatory element for Ifng. This conclusion is supported by our Hi-C data; however, chromatin conformation capture assay (3C) can provide better resolution than Hi-C. In 3C assays, we confirmed a strong, Th1-specific interaction between the +66 site and the Ifng locus (+1 kb) in WT Th1 cells but not Th2 cells (Figure 5A, B). This loop was absent in Ifng-as1 KO Th1 cells, establishing that deletion of the 5’ end of the Ifng-as1 gene resulted in disturbed Ifng chromatin interactions, even though this region is distal to the boundaries of the Ifng interaction domain (−70 kb to +66 kb) (Figure 5A, B). Importantly, the observed changes in chromatin architecture were not associated with differences in DNA accessibility or CTCF binding between WT and Ifng-as1 KO cells within the region (−70 kb to +111 kb, aside from the +95 kb site deleted in Ifng-as1 KO cells, Figure 5C, F). We also did not find significant differences in the accessibility or CTCF deposition in cells from WT versus Ifng-as1-PolyA KI mice (Figure 5D - F). Thus, lack of Ifng-as1 RNA or the disruption of the Ifng-as1 locus appears not to have discernible influences on chromatin accessibility or CTCF binding. Although residing outside the Ifng interaction domain per se, the Ifng-as1 locus contributes as a cis-regulatory element that is required for normal local chromatin topology, providing potential enhancer elements and/or CTCF binding sites.
Figure 5: Extent of local chromatin interactions does not depend on locus accessibility and CTCF binding at the extended Ifng/Ifng-as1 loci.

(A)(B) Looping interactions within the Ifng/Ifng-as1 loci were analyzed by 3C between the +66 kb (66 kb downstream of Ifng TSS) HindIII fragment as anchor (shown in violet) and different fragments positioned at increasing distances from the anchor. Shown are representative data from n=3 independent experiments using Th1 cells (A) or Th2 cells (B). Dashed lines indicate deleted DNA fragment in Ifng-as1 KO cells. (C) ATAC sequencing profiles comparing WT and Ifng-as1 KO Th1 and Th2 cells. Shown are representative tracks from n=2 independent experiments (D) ATAC sequencing profiles for WT and Ifng-as1-PolyA KI Th1 and Th2 cells. Shown are representative tracks from n=2 independent experiments. 26 ATAC peaks (indicated in red) were called in a 340 kb region encompassing Ifng and Ifng-as1. (E) Statistical significance (p-values) of peak calling between WT and Ifng-as1-PolyA KI Th1 ATAC sequencing samples (F) Genomic tracks of CTCF binding comparing Th1 and Th2 cells (day 6 of culture) isolated from WT and Ifng-as1 KO mice and Ifng-as1-PolyA KI mice. Shown are representative tracks from n=2 independent experiments. See also Table T1.
Discordant expression of Ifng-as1 and Ifng in effector T cells
The simultaneous expression of Ifng and Ifng-as1 in T helper 1 (Th1) cells and the use of shared transcription factor, such as T-bet, argue for a coordinated regulation (Collier et al., 2012). However, we observed surprisingly distinct expression kinetics for Ifng and Ifng-as1 in the course of a Th1 cell differentiation. Whereas Ifng expression peaked at day 3 of culture, we detected only very low levels of Ifng-as1 RNA at this time point (Figure 6A). We found that the Ifng-as1 expression increased starting from day 4 of culture, the day of αCD3/αCD28 withdrawal, reaching its highest levels at day 6 of culture (Figure 6A). To pursue the idea that αCD3/αCD28 stimulation might inhibit Ifng-as1 expression, we withdrew the stimulation at different time points of culture and let the cells rest for another 24 hours. We found that 24 hours of αCD3/αCD28 stimulation in the presence of IL-12 followed by a 24-hour rest in IL-12-containing medium alone was sufficient to induce Ifng-as1 transcription (Figure 6B). However, in contrast to Ifng, whose expression increased after three days of αCD3/αCD28 plus IL-12 stimulation, Ifng-as1 expression was inhibited as long as CD3/CD28 engagement was maintained. We next sought to ascertain whether this inhibition was mediated by signals from CD3, CD28 or both. We found that CD3 engagement was sufficient to suppress Ifng-as1 transcription, whereas CD28-mediated signaling had no effect (Figure 6C). In contrast, αCD3 stimulation was necessary for proper Ifng expression as expected. The combination of IL-12 and IL-18 is a potent inducer of IFN-γ. However, we found that IL-18 had opposing effects on Ifng and Ifng-as1 expression; stimulation of T cells with IL-12 and IL-18 increased Ifng expression but decreased Ifng-as1 expression (Figure 6D). Both T cell receptor and IL-18 signaling activate NF-kB and since NF-kB was shown to bind the Ifng-as1 locus, it is conceivable that the NF-kB pathway is causally involved in the discordant expression pattern of Ifng and Ifng-as1 (Collier et al., 2014).
Figure 6: Ifng-as1 expression is suppressed by TCR stimulation but maintained in long-lived memory cells in the absence of antigen stimulation.

(A)-(D) Naïve T cells from WT mice were isolated by FACS and cultured under Th1 polarization conditions for up to 6 days. Ifng and Ifng-as1 expression was analyzed by RT-qPCR and normalized to the expression of β-actin. Shown are representative graphs from n=2 independent experiments. Graphs show mean ± sem. (A) Ifng and Ifng-as1 expression on day 3 and on day 6 of culture. (B) αCD3/αCD28 stimulation was withdrawn at different time points of culture, followed by 24 hours of resting. Expression of Ifng (top panel) and Ifng-as1 (bottom panel) for indicated conditions was analyzed by RT-qPCR and normalized to the expression of β-actin. (C) Cells were stimulated under Th1 polarizing conditions for 2 days. Afterwards cells were cultured in IL-12-containing medium in the presence or absence of αCD3 or αCD28 stimulation for an additional period of 24 hours. (D) Cells were stimulated without cytokines or in the presence of IL-12 or IL-12 and IL-18 for 6 days. (E) Effector memory cells (TEM, CD4+CD25−CD44+CD62L−) or central memory cells (TCM, CD4+CD25−CD44+CD62L+) were isolated from WT mice. Tbx21, Ifng, and Ifng-as1 expression was analyzed by RT-qPCR and normalized to the expression of β-actin. Shown are representative data from n=3 independent experiments. Graphs show mean ± sem. (F) CD45.1+CD45.2− P14 cells (LCMV-gp33 specific transgenic TCR, CD45.1+) were injected intravenously into CD45.2+ WT mice. The next day, these mice were challenged with 2 × 10⁵ pfu of LCMV Armstrong. At day 8, terminal effector cells (CD8+CD45.1+KLRB1+CD127−) and memory precursor cells (CD8+CD45.1+KLRB1− CD127+) were isolated from spleens using FACS. Effector memory cells (CD45.1+CD44+CD127+CD62L−) and central memory cells (CD45.1+CD44+CD127+CD62L+) were collected by FACS from CD8+ T cell enriched splenocytes 48 days after infection from splenic CD8+ fractions. Naïve cells (CD8+CD44−CD62L+) were independently collected from the spleens LCMV-naive CD45.1+CD45.2− P14 mice. Ifng and Ifng-as1 expression was analyzed by RNA sequencing. (G) Expression of IFNG and IFNG-AS1 in naive and A2-NS4B214 tetramer+ effector (day 14, day 28) and long-term memory CD8+ T cells in human samples (see PMID: 29236685 for further details). (H) Ifng and Ifng-as1 expression was analyzed by RT-qPCR in effector memory cells (TEM, CD4+CD25−CD44+CD62L−) and central memory cells (TCM, CD4+CD25−CD44+CD62L+) from WT mice, Ifng-as1 KO mice, and Ifng-as1-PolyA KI mice. Shown are representative graphs from n=3 independent experiments. Graphs show mean ± sem. *p<0.05 **p<0.01 ***p<0.001.
Ifng-as1 controls Ifng expression in memory T cells
Since we found that Ifng-as1 was expressed upon initiation of the Th1 differentiation program but extinguished by prolonged CD3 engagement, we returned to the question of Ifng-as1’s role in various T cell subsets. Therefore, we analyzed Ifng-as1 expression levels in subsets of memory T cells. We first isolated CD4+ T memory cells from spleens and lymph nodes of WT mice and found, consistent with previous studies, little or moderate expression of Ifng in central memory cells or effector memory cells, respectively (Figure 6E). Unexpectedly, Ifng-as1 was expressed at equally high levels in both effector and central memory cells, its expression even exceeding Ifng expression in central memory cells.
In order to investigate whether this expression pattern was limited to CD4+ T cells or also relevant for CD8+ memory T cells, we next analyzed the Ifng and Ifng-as1 expression in antigen-specific CD8+ T cells isolated from mice infected with LCMV. We found higher expression levels of Ifng-as1 in antigen-specific memory precursor and central memory T cells (Figure 6F). Lower expression of Ifng-as1 was detected in terminal effector and effector memory T cells, consistent with antigen receptor-driven extinction of Ifng-as1 transcription. In contrast, Ifng showed an inverse expression pattern, being expressed at its highest levels in terminal effector and effector memory T cells. Considering that Ifng-as1 is located at syntenic positions adjacent to IFNG in different species, including mouse and human, we speculated that similar expression patterns might exist for IFNG-AS1 and IFNG in human T cells.
It has been previously shown that antigen-specific CD8+ memory T cells isolated from subjects immunized with a live attenuated yellow fever vaccine (YFV) maintain an accessible chromatin profile at CD8+ effector gene loci and rapidly produce IFN-γ upon peptide re-stimulation up to a decade later (Akondy et al., 2017). In agreement with our mouse data, we found high expression of IFNG-AS1 in the face of low expression of IFNG in YFV-specific memory T cells compared to naive T cells or cells isolated 2-4 weeks after the vaccination (Figure 6G). Since the vaccination was done in the United States where yellow fever is not indigenous, it is extremely unlikely that subjects were re-exposed to yellow fever antigen again after the vaccination. The data therefore suggest that the IFNG-AS1 expression is maintained at a high level in memory T cells up to 10 years after antigen encounter. To further dissect the role of Ifng-as1 in memory T cells, we isolated effector memory cells and central memory cells from naïve Ifng-as1 KO and Ifng-as1-PolyA KI mice and found reduced expression of Ifng compared to cells isolated from WT mice (Figure 6H), pointing to the functional relevance of Ifng-as1 transcription in memory T cells.
In summary, this study establishes Ifng-as1 as an important regulator of Ifng expression, both in-vitro and in-vivo, as a DNA element and transcribed RNA, involved in dynamic and cell state-specific responses to infection (Figure S6E).
DISCUSSION
Among the surprises associated with the completion of the sequences of the human and other genomes were the paucity of protein-coding genes relative to the large proportion of the genome that is transcribed. Compared to the expression patterns of protein-coding genes, the expression of non-coding genes often occurs at very low levels and exhibits a much higher cell- and process-specificity (Cabili et al., 2011; Derrien et al., 2012). While selected ncRNA molecules have broad effects on adjacent or even distal genes, the low level expression of many other ncRNAs and the lack of species conservation has suggested restricted local effects with minimal roles for sequence-specific functions of the RNA produced or “transcriptional noise” that may not be functionally critical (Necsulea et al., 2014). Nonetheless, it has become increasingly clear that ncRNAs, especially lncRNAs, are important, yet cryptic regulators of gene expression (Engreitz et al., 2016; Isoda et al., 2017; Kotzin et al., 2016). In many cases, however, the mechanism by which lncRNAs regulate gene expression remains unclear.
IFN-γ is a critical cytokine with essential functions in host defense and cancer. In this study, we dissected the functional cross-talk between Ifng and its adjacent lncRNA locus, Ifng-as1. Using Ifng-as1 KO and KI mice, we establish that both the integrity of the Ifng-as1 locus and the Ifng-as1 transcript are required for maximal Ifng gene expression in IFN-γ producing cells—Whereas disruption of DNA structure or the encoded RNA product compromised host defense response, the degree of impairment with DNA/RNA deletion was clearly more severe than interference of RNA production alone. Furthermore, our study revealed a discordant regulation of Ifng and Ifng-as1 depending on the state of cells. As previous reports have emphasized the co-regulation of Ifng-as1 with its adjacent cytokine gene Ifng, we observed that TCR signaling led to discordant expression of Ifng and Ifng-as1, with the latter being upregulated with termination of TCR stimulation. The most compelling example of this was shown in human memory T cells where Ifng-as1 expression is maintained in the absence of Ifng transcription for at least a decade after the initial antigen encounter. In this regard, Ifng-as1 could be a relevant identifier of antigen-experienced T cells, denoting prior Ifng expression.
Multiple mechanisms have been identified and proposed by which lncRNAs regulate gene expression (Kopp and Mendell, 2018), and it is more likely that each lncRNA functions uniquely to suit local structure of a given locus. For example, Xist acts locally yet its action can impact nearly the entire X chromosome with its RNA product being critical for initiating recruitment of gene silencing proteins to chromatin. In contrast, upperhand (Uph) acts locally but its RNA product has no discernible sequence-specific functions (Toiber et al., 2017). We propose that the predominant action of Ifng-as1 is also local, confined and specialized to regulate its neighbor, the Ifng gene, with its major, but not exclusive influence being an organizer of chromatin architecture.
The Ifng locus is remodeled during Th1 cell differentiation by CTCF and cohesion-mediated formation of long-range chromatin loops between IFNG and the adjacent intergenic regions (Hadjur et al., 2009). Depletion of CTCF binding typically perturbs insulation at boundaries between neighboring, functionally distinct regions of the genome (TADs) (Dixon et al., 2012; Nora et al., 2012) and results in inappropriate interactions between adjacent TADs (Lupiáñez et al., 2015; Narendra et al., 2015; Nora et al., 2012; Sanborn et al., 2015; Tsujimura et al., 2015). An interesting exception to this principle is the lncRNA locus Firre, which harbors ~ 15 CTCF binding sites and represents a stable TAD boundary across many cell types; yet, deletion of Firre does not alter TAD formation (Barutcu et al., 2018). This re-emphasizes the concept that each locus exhibits unique features that may not easily conform to general rules.
The Ifng-as1 locus harbors two CTCF sites: a telomeric site in intron 1 (+95 kb downstream of the Ifng TSS) and a centromeric site in intron 4 (+66 kb). The latter, more proximal to Ifng, has been described as a cis-regulatory element, interacting with a CTCF site within the Ifng gene body (intron 1, +1 kb from Ifng TSS) and separating the locus from its surroundings (Sekimata et al., 2009). However, in the Ifng-as1 KO mouse described herein, the more distal CTCF site in intron 1 of Ifng-as1 (+95 kb) is deleted. Although it has been postulated that this site is located beyond the Ifng-centered functional domain, we observed perturbed chromatin architecture of the extended Ifng/Ifng-as1 loci associated with impaired IFN-γ production and host defense deficits. Thus, we suggest that one critical aspect of Ifng-as1’s function is the underlying DNA sequence acting as a cis-regulatory element. The +95 CTCF site appears to not interact with the Ifng locus via chromatin looping; however, deletion of this region reduced interactions between Ifng and its +66 enhancer. However, upon deletion of the +95 site we did identify increased interactions in the region telomeric to Ifng-as1. This and the analysis of upstream and downstream contacts (“directionality index”) relative to the +95 site suggest that this CTCF site serves as a functional insulator. Our data collectively establish the importance of the chromatin architecture at the Ifng/Ifng-as1 loci and the impact of Ifng-as1 on the extensive looping within the Ifng interaction domain which correlates with optimal expression of Ifng.
Beyond the role of Ifng-as1 as a chromatin organizer, the phenotype of Ifng-as1-PolyA KI mice is illuminating in terms of Ifng-asl transcription. We noted that the modified Ifng-as1 locus in cells from Ifng-as1-PolyA KI mice failed to produce a full-length Ifng-as1 transcript, but still generated shorter transcripts, suggesting a role of the full-length Ifng-as1 RNA in supporting normal Ifng responses. As we did not observe major changes in chromatin loop formation in Ifng-as1-PolyA KI Th1 cells, the Ifng-as1 transcript does not take part in the local chromatin architecture, suggesting alternative mechanisms controlling Ifng expression. The Ifng-as1 RNA may serve to enrich transcription factors and chromatin modifiers within the proximity of the Ifng locus once the proper chromatin conformation is formed within the Ifng interaction domain. In addition, we cannot entirely exclude the possibility that the Ifng-as1 transcript influences Ifng translation in the cytoplasm, although low transcript levels are presumed to not act via this mechanism (Ulitsky and Bartel, 2013). However, the observed discrepancies between RNA and protein levels are notable. As both the generation and degradation of mRNA and proteins are highly dynamic processes, it is possible that the degradation rate of Ifng mRNA and IFN-γ protein are quite different resulting in the observed discrepancies between Ifng transcript and protein in Ifng-as1 KI cells. How Ifng-as1 might impact these processes will be important to examine in the future.
Many lncRNAs are not conserved amongst species and there is limited conservation between mouse Ifng-as1 and its human counterpart IFNG-ASl (Collier et al., 2012; Necsulea et al., 2014). Even the organization of the extended mouse and human IFNG-IL22 locus are distinct, with the IL26 locus being a pseudogene in the mouse. Nonetheless, large anti-sense transcripts are present in both mouse and human and both Ifng-as1 and IFNG-ASl have been argued to be important regulators of IFN-γ (Collier et al., 2012; Gomez et al., 2013; Spurlock et al., 2017). While Ifng-as1/IFNG-ASl expression is induced in Th1 cells, apparently by some of the same factors that induce IFNG, the overall expression level is very low (Collier et al., 2014). Low level expression is a common feature of lncRNAs that act locally on their neighboring gene (Derrien et al., 2012; FANTOM Consortium and the RIKEN PMI and CLST (DGT) et al., 2014; Werner and Ruthenburg, 2015). That is, high expression might not be required because of the proximity between the lncRNA and its target gene or because the RNA transcript itself is dispensable. However, we found high level expression of Ifng-as1 and IFNG-AS1 in memory cells. There are at least two ways to interpret these results: Ifng-as1 RNA expression might lock the extended Ifng/Ifng-as1 loci in a poised epigenetic state, facilitating rapid Ifng transcription after antigen re-challenge. It is tempting to speculate that Ifng-as1 transcription maintains local chromatin architecture in order to promote secondary IFN-γ induction. It has been suggested that chromatin loops are involved in a process, called transcriptional memory (Tan-Wong et al., 2009); the extent to which this is a fundamental determinant of immunologic memory remains to be determined. Technical advances in chromatin conformation assays will be necessary to investigate the role of Ifng-as1 in small subsets such as antigen-specific memory cells in a sufficient resolution. However, it is also reasonable to consider that Ifng-as1 may have more complex, process-specific roles, enhancing Ifng expression during the effector phase but suppressing its expression during resting periods, thus inhibiting possibly harmful consequences of unnecessary stochastic IFN-γ secretion. It is conceivable that the Ifng-as1 transcript employs different mechanisms in effector cells that differentiate under the influence of IL-12 and IFN-g and in long-lived resting memory cells whose maintenance rather relies on cytokines such as IL-7, IL-15 or IL-21 (Cui et al., 2011; Fehniger et al., 2001; Kieper et al., 2002; Rubinstein et al., 2008). To understand the functional relevance of Ifng-as1 during memory responses, it will be important to elucidate factors that drive high level expression of Ifng-as1/IFNG-ASl independent of IFNG.
In sum, we demonstrate here that the lncRNA Ifng-as1 modulates the expression of Ifng both as a regulatory DNA element and through transcription of its RNA product. That a lncRNA regulates its neighboring gene by multiple mechanisms is likely due to the importance of IFN-γ for both the innate and the adaptive immune response and highlights the relevance of a tight control of its expression potentially lasting decades. We also show that antigen availability reciprocally affects the expression of Ifng and Ifng-as1, allowing for Ifng-as1/IFNG-AS1 to serve as a biomarker for memory T cells previously involved in IFN-γ-dependent immune responses.
STAR METHODS
CONTACT FOR REAGENT AND RESOURCE SHARING
Further information and requests for resources and reagents should be directed to and will be fulfilled by Franziska Petermann, Yuka Kanno or John J. O’Shea.
EXPERIMENTAL MODEL AND SUBJECT DETAILS
Mice
All animal experiments were performed in the AAALAC-accredited animal housing facilities at NIH. All animal studies were performed according to the NIH guidelines for the use and care of live animals and were approved by the Institutional Animal Care and Use Committee of NIAMS. Female mice of 6 -14 weeks old were used in all experiments. For sample size, see corresponding figure legends. B6(Cg)-Rag2tm1.1Cgn/J (Rag2−/−) were purchased from Jackson Laboratories. To generate Ifng-as1 KO mice exon 1 and intron 1 (~ 30 kb) of the Ifng-as1 gene were replaced with an EGFP and an FRT-flanked positive selection cassette. The targeting vector was generated using BAC clones from the C57BL/6J RPCIB-731 BAC library and transfected into the TaconicArtemis C57BL/6N Tac ES cell line. Homologous recombinant clones were isolated using positive (Puro resistance) and negative (Thymidine kinase) selections. The constitutive knock in allele was obtained after Flp-mediated removal of the selection marker (Puro). To generate Ifng-as1-PolyA KI mice we constructed a targeting vector (backbone: pcDNA3.1) containing the BGH polyadenylation sequence flanked by two 3 kb homologous arms. In addition, we designed a CRISPR single-guide RNAs (sgRNAs) using MIT’s CRISPR online tool (crispr.mit.edu/). The sgRNA sequence was cloned into an sgRNA vector using OriGene’s sgRNA cloning services. Then, the sgRNA was in vitro-transcribed using the MEGAshortscript T7 kit (Life Technologies). Cas9 mRNA was in vitro-synthesized from the MLM3613 plasmid vector (no. 42251; Addgene) using the mMESSAGE mMACHINE T7 kit (Life Technologies). To insert the BGH sequence into the Ifng-as1 gene, the sgRNA (50 ng/μL) was mixed with Cas9 mRNA (100 ng/μL) and the double-stranded vector and then coinjected into the cytoplasm of fertilized mouse eggs. After culturing overnight in M16 medium (EMD Millipore), those embryos that reached the two-cell stage of development were implanted into the oviducts of pseudopregnant foster mothers. Mice born to these foster mothers were genotyped by PCR amplification of the targeted regions, followed by DNA sequencing.
ACCAACCAAAAGTATAGTCATCCGGGAAGAGAAGAGCCTGAGAGAAAAATAACACTTGGACTGGCATCtgtgccttctagttgccagccatctgttgtttgcccctcccccgtgccttccttgaccctggaaggtgccactcccactgtcctttcctaataaaatgaggaaattgcatcgcattgtctgagtaggtgtcattctattctggggggtggggtggggcaggacagcaagggggaggattgggaagtcaatagcaggcatgctggggatgcggtgggctctatggAGGAGG
(Legend: Ifng-as1 TSS, gRNA, BGH sequence, PAM)
The sequences of the primer pairs that were used to detect remaining transcripts at the Ifng-as1 KO and KI locus were: catccgggaagagaagagcctg (Exon1, fwd), ggacttggtgtcaaagaatggtgc (Exon 2, rev), gcaccattctttgacaccaagtcc (Exon 2, fwd), tgggagtttcaccctgtcttctg (Exon 3, rev), cacatccattggagccttcttcag (Exon 3, fwd), cgtcaaacattgggaggcagc (Exon 4, rev), cctcccaatgtttgacgacatcc (Exon 4, fwd) and tgaccttccctcacttgttctagc (Exon 5, rev).
Cell culture medium
All primary T cells isolated from mice were cultured in complete RPMI (cRPMI) medium containing 10% (vol/vol) FCS, 2 mM glutamine, 100 IU/ml of penicillin, 0.1 mg/ml of streptomycin and 20 mM HEPES buffer, pH 7.2-7.5, 1 mM sodium pyruvate, nonessential amino acids (all Thermo Fisher), and 2 μM β-mercaptoethanol (Sigma-Aldrich).
METHOD DETAILS
Purification of T cell populations
CD4+ T cells were purified from splenocytes and lymph nodes of untreated 6- to 14-week-old mice by negative selection and magnetic separation (Miltenyi Biotec). To obtain naïve T cells, CD4+ T cells were sorted into CD4+CD62L+CD44−CD25− T cells by fluorescence activated cell sorting (FACS) using FACSAria Illu or FACSAria Fusion (BD). To obtain central and effector memory T cells CD4+ T cells were sorted into CD4+CD62L+CD44+CD25− T cells or CD4+CD62L−CD44+CD25− T cells, respectively, by FACS.
T cell differentiation
Naive CD4+ T cells were activated by plate-bound anti-CD3 (10 μg/ml, clone: 145-2C11) and anti-CD28 (10 μg/m1, clone: 37.51) in cRPMI for 3 days with IL-12 (10 ng/ml, R&D Systems) and anti-IL-4 (10 μg/ml, 11B11) for Th1 cells or IL-4 (20 ng/ml, R&D Systems) and anti-IFN-γ (10 μg/ml, XMG1.2) for Th2. After 3 days, cells are split onto uncoated plates with fresh media and cytokines added along with IL-2 (100 U/ml, R&D Systems). For LNA knockdown experiments, a pool consisting of four LNA GapmeRs (Exiqon) targeting different sites of the Ifng-as1 full-length transcript or a negative control LNA GapmeR was added to a Th1 cell culture on day 3 of culture after splitting and TCR withdrawal via unassisted delivery at a final concentration of 1 μM.
Flow Cytometry
Cells were stained with live/dead fixable dyes (Aqua [405 nm exc] or Near-IR [633 nm exc], Thermo Fisher) and fluorochrome-labelled anti-mouse antibodies to the following surface markers (all purchased from BD Biosciences unless otherwise stated): CD3 (clone 145-2C11), CD4 (GK1.5 or RM4-5), CD11b (M1/70), CD8 (53-6.7), CD19 (6D5 or eBio1D3, ThermoFisher), CD25 (PC61 or 7D4), CD44 (IM7), CD62L (MEL-14), CD127 (A7R34), GL-3 (GL3, BioLegend), IFN-γ (XMG1.2), NK1.1 (PK136), NKp46 (29A1.4), TCRb (H57-597). For intracellular cytokine staining, cells were re-stimulated with 50 ng/ml PMA (Sigma-Aldrich), 1 μg/m1 ionomycin (Sigma-Aldrich) and monensin (1 μl/ml BD GolgiStop, BD Biosciences) at 37 °C for 2.5 h. Subsequent to live/dead and surface staining, cells were fixed and permeabilized (Cytofix/Cytoperm and Perm/Wash Buffer; BD Biosciences), and stained for cytokines IFN-γ (XMG1.2, BD Biosciences) and IL-13 (eBio13A, ThermoFisher). Flow cytometry analysis was performed on a FACSVerse or FACSCanto II machine (BD Bioscience). Acquired data were analyzed with FlowJo software (TreeStar).
Quantitative RT-PCR
Total RNA was extracted with TRIzol reagent (Thermo Fisher) in conjunction with or solely using the Quick RNA MiniPrep Plus Kit or the Direct-zol RNA MiniPrep Kit (both from Zymo Research). RNA was reverse-transcribed to cDNA with the iScript cDNA synthesis kit (Bio-Rad) according to the manufacturer’s instructions. Quantitative real-time PCR (qRT-PCR) experiments were carried out in duplicate with Taqman Universal PCR Master Mix (Applied Biosystems) in total reaction volumes of 20 μl and thermocycled in a CFX96 Touch real-time PCR detection system (Bio-Rad). The following Taqman gene-specific primer probes were purchased from Applied Biosystems: Actb, Tbx21, Ifng, Ifng-as1. Cycle threshold (Ct) values were exported and normalized against the control probe via the 2−ΔCt method and are reported as expression relative to a control condition.
Chromosome conformation capture assay (3C)
The 3C assays were performed as described previously with slight modifications (Hagege, Nat Prot). In brief, 10 million cells were cross-linked in 8 mL RPMI containing 10% FBS (vol/vol) and 2% paraformaldehyde (vol/vol) for 10 min on ice, followed by the addition of glycine to 0.125 M to stop the cross-linking reaction. After washing with 1 × PBS, cells were lysed in 10 mM Tris (pH8.0), 10 mM NaCl, and 0.2% (vol/vol) Nonidet P-40 for 10 min on ice. Nuclei were pelleted by centrifugation and resuspended with 1.1 × restriction enzyme buffer (NEBuffer 2; New England BioLabs) containing 0.3% (wt/vol) SDS. After 1 h of incubation at 37 °C, Triton-X was added to a final concentration of 2% (vol/vol) for an additional hour of incubation at 37 °C to neutralize the SDS. Chromatin then was digested by the addition of 200 U HindIII (New England BioLabs) for overnight incubation at 37 °C, followed by a second addition of 200 U HindIII for an additional 4 h. Digestion was stopped by the addition of SDS to 0.8% (wt/vol) and heat inactivation at 68 °C for 10 min. Digested chromatin was purified from cellular proteins by centrifugation for 16 h at 35,000 rpm through 8 M urea in a Beckman SW40Ti rotor at 10 °C. The cross-linked chromatin pellet was resuspended in 2 mL of 30 mM Tris⋅HCl (pH 7.4) and 10 mM MgCl2 and was dialyzed against the same buffer overnight to remove urea. Purified chromatin then was diluted by the addition of 5 ml of the same buffer followed by DTT to 10 mM and ATP to 1 mM. The chromatin then was ligated by the addition of 200 U T4 ligase (New England BioLabs) for overnight incubation at 16 °C, followed by the addition of another 200 U of T4 ligase for 4 h additional incubation. Ligated DNA was collected after overnight incubation at 65 °C with 10 μg/ml proteinase K and purification by phenol/chloroform extraction and ethanol precipitation. 3C products were quantified by Taqman-based real-time qPCR assays using a LightCycler 480 probe master kit (Roche) and a LightCycler 480 Real-Time PCR system (Roche). The following PCR program was used: 95 °C for 10 min, followed by 48 cycles of 95 °C for 10 s and 65 °C for 30 s. All PCR reactions were run in duplicate. The sequences of probes and PCR primers are shown in Table S1. An unbiased pool of 3C products generated by digestion and religation of RP23-55021 BAC DNA (spanning the Ifng/Ifng-as loci) was used to generate standard curves. Accordingly, standard curves generated by using digested and religated BAC DNA spanning the Gapdh locus (RP23-410F11) served to normalize the samples.
Hi-C
A detailed protocol to generate HiC libraries including sequence alignment can be obtained at PMID:25497547 and PMID:26499245.
RNA-seq
For LCMV experiments RNA was isolated from sorted cells of LCMV-infected mice with the Qiagen AllPrep Micro Kit. Libraries were prepared and sequenced by the HudsonAlpha Genomic Services Lab (paired-end, 150 bp reads). For all other experiments total RNA was prepared using the RNeasy kit (Qiagen). 500 ng of total RNA was subsequently used to prepare RNA-seq libraries by a combination of NEBNext RNA library prep kit (New England BioLabs) and Ovation SP Ultralow DR Multiplex system (Nugen) following the manufacturer’s protocol. The libraries were sequenced for 50 cycles (single read) using the HiSeq 2500 (Illumina).
Histone chromatin immunoprecipitation (ChIP) sequencing
0.5-1.5 million Th1 and Th2 cells cultured as indicated above were cross-linked for 10 min with 1% formaldehyde and harvested in 100 μl detergent lysis shearing buffer (1% SDS, 10 mM EDTA, 50 mM Tris-HCl, pH 8.0). Cells were sonicated (Bioruptor (Diagenode), 40 cycles, 30s on, 30s off, power H) and immuno-precipitated using antibodies recognizing H3K36me3 (ab9050, Abcam), H3K4me1 (ab8895, Abcam), H3K27me3 (07-449, Millipore Sigma) or H3K27Ac (ab4729. Abcam). ChIP was performed overnight at 4 °C using Protein A Dynabeads (Thermo Fisher). Antibody-bound beads were washed twice with RIPA buffer, twice with RIPA buffer containing 0.3M NaCl, twice with LiCl buffer (0.25 M LiCl, 0.5% Igepal-630, 0.5% sodium deoxycholate), once with TE buffer (pH 8.0) containing 0.2% Triton X-100, and once with TE buffer (pH 8.0). DNA was released by incubating the beads at 65°C for 4 hrs in the presence of 0.3% SDS and 1 mg/mL Proteinase K. ChIP DNA was purified by a DNA clean and concentrator column (Zymo research). 10 ng of ChIPed DNA was subsequently used to prepare ChIP-Seq libraries by a combination of NEBNext library prep kit (New England BioLabs) and Ovation SP Ultralow DR Multiplex system (Nugen) following the manufacturer’s protocol. The libraries were sequenced for 50 cycles (single read) using the HiSeq 2500 (Illumina). SICER (Zang et al., 2009) was used for peak calling using mm9 as a reference genome.
CTCF and Tbet chromatin immunoprecipitation (ChIP) sequencing
10 million Th1 and Th2 (for CTCF ChIP only) cells cultured as indicated above were cross-linked for 10 min with 1% formaldehyde and harvested. Cells were lysed by sonication (Sonifier S-450 Digital Ultrasonic Cell Disruptor/Homogenizer, Branson Ultrasonics) in shearing buffer (50mM Tris-HCl pH 7.6, 0.2% Triton X) and immuno-precipitated using a polyclonal rabbit anti-mouse anti-CTCF antiserum (07-729, Millipore Sigma, 8 μl per assay). ChIP was performed overnight at 4 °C using Protein A Dynabeads (Thermo Fisher). Antibody-bound beads were washed twice with RIPA buffer, twice with RIPA buffer containing 0.3M NaCl, twice with LiCl buffer (0.25 M LiCl, 0.5% Igepal-630, 0.5% sodium deoxycholate), once with TE buffer (pH 8.0) containing 0.2% Triton X-100, and once with TE buffer (pH 8.0). DNA was released by incubating the beads at 65°C for 4 hrs in the presence of 0.3% SDS and 1 mg/mL Proteinase K. ChIP DNA was purified by a DNA clean and concentrator column (Zymo research). 80 ng (for CTCF ChIP) or 10 ng (for Tbet ChIP) of ChIPed DNA was subsequently used to prepare ChIP-Seq libraries using Ovation SP Ultralow DR Multiplex system (Nugen) following the manufacturer’s protocol. The libraries were sequenced for 50 cycles (single read) using the HiSeq 3000 (Illumina). MACS1.4.2 (Zhang et al., 2008)was used for peak calling using mm10 as a reference genome.
ATAC-Seq
ATAC-seq was performed according to a published protocol (Buenrostro et al., 2013) with minor modification. Fifty thousand cells were pelleted and washed with 50 μl 1× PBS, followed by treatment with 50 μl lysis buffer (10 mM Tris-HCl [pH 7.4], 10 mM NaCl, 3 mM MgCl2, 0.1% IGEPAL CA-630). After pelleting the nuclei by centrifuging at 500 × g for 10 min, the pellets were re-suspended in a 40-μl transposition reaction with 2 μl Tn5 transposase (FC-121-1030; Illumina) to tag and fragmentalize accessible chromatin. The reaction was incubated at 37°C with shaking at 300 rpm for 30 min. The fragmentalized DNAs were then purified using a QIAGEN MinElute kit and amplified with 10 or 11 cycles of PCR based on the amplification curve. Once the libraries were purified using a QIAGEN PCR cleanup kit, they were further sequenced for 50 cycles (paired-end reads) on a HiSeq 2500.
Toxoplasma gondii infection
WT, Ifng-as1 KO and Ifng-as1 PolyA_KI mice were i.p. infected with approximately 20 cysts of the avirulent ME49 strain of T. gondii as described previously (Jankovic et al., 2007). To check serum cytokine levels, mice were bled on day 8 post-infection. 8 weeks after the infection, the mice were euthanized and whole-brain homogenates were used to count cysts in a blinded manner.
LCMV infection and cell sorting
For collection of LCMV Armstrong-infected mouse samples, 2 × 10³ P14 cells from a CD45.1+CD45.2− P14 (LCMV-gp33 specific transgenic TCR) donor mouse (CD45.2+, C57BL/6J background) were injected intravenously into C57BL/6J mice (Jackson Laboratories, Bar Harbor, ME). The next day, these mice were injected intraperitoneally with 2 × 10⁵ pfu of LCMV Armstrong. At day 8, terminal effector cells (CD8+CD45.1+KLRB1+CD127−) and memory precursor cells (CD8+CD45.1+KLRB1−CD127+) were isolated from spleens using FACS. Effector memory cells (CD45.1+CD44+CD127+CD62L−) and central memory cells (CD45.1+CD44+CD127+CD62L+) were collected by FACS from CD8+ T cell enriched splenocytes (using the Stemcell Mouse CD8+ T cell isolation kit) 48 days after infection. Naïve cells (CD8+CD44−CD62L+) were collected from the spleens of LCMV-naive CD45.1+CD45.2− P14 mice (C57BL/6J background). Antibodies (clones) used for flow sorting were: CD4 (GK1.5); CD19 (6D5); CD45.1 (A20); CD8 (53-6.7); CD127 (SB/199); KLRG1 (2F1); CD62L (MEL-14); CD44 (IM7). Animal experiments were approved by the Institutional Animal Care and Use Committee of Emory University.
QUANTIFICATION AND STATISTICAL ANALYSIS
RNA-seq Analysis
Raw sequencing data were processed with CASAVA 1.8.2 to generate FastQ files. Sequence reads for RNA-seq were mapped onto the mouse genome build mm9 using TopHat 2.1.0. Gene expression values (RPKM, reads per kilobase exon per million mapped reads) were calculated by Partek Genomics Suite (6.6/6.14.0514). BigWig tracks were generated from Bam files and converted into Bedgraph format using BEDTOOL. These were further reformatted with the UCSC tool bedGraphToBigWig. The differential gene expression was calculated by Partek Genomics Suite (6.6/6.14.0514).
Differentially expressed genes were selected with following criteria (1) absolute RPKM > 1 in at least 1 condition, and (2) p value < 0.01 and (3) fold expression change > 2.
ATAC-seq analysis
ATAC-seq reads from two biological replicates for each sample were mapped to the mouse genome (mm9 assembly) using Bowtie 0.12.8 (Langmead and Salzberg, 2012). In all cases, redundant reads were removed using FastUniq (Xu et al., 2012) and customized Python scripts were used to calculate the fragment length of each pair of uniquely mapped paired-end (PE) reads. The fragment sizes distribute similar to previously published data (data not shown). Regions of open chromatin were identified by MACS (version 1.4.2) (Zhang et al., 2008) using a p-value threshold of 1 × 10⁻⁵. Only regions called in both replicates were used in downstream analysis. Peak intensities (“tags” column) were normalized as tags per 10 million reads (RP10M) in the original library. Downstream analysis was performed with the Hypergeometric Optimization of Motif EnRichment program (HOMER) version 4.8 (Heinz et al., 2010) and R 3.0.1 (R Core Team, 2014).
Preprocessing and analysis of local Hi-C experiments
Juicer was used to preprocess local Hi-C libraries (Durand et al., 2016). Raw ligation frequency matrices at the resolution of 5 kb were extracted from the .hic files. We considered only chr10 in the subsequent analyses. The data was imported to R using a custom script. A chromosome-wide contact matrix suitable for normalization by balancing was created, as suggested in (Sanborn et al., 2015). Briefly, we used published Hi-C data from Vian et al., 2018, (Vian et al., 2018) to obtain the in-silico spike ins (Sins). The amount of Sins was estimated by computing the median of the chromosome-wide per-bin coverage of the local Hi-C matrix at the targeted region (Ifng) in each local Hi-C sample. Next, the number of reads per bin pair resulting in the final coverage of each of the 5 kb bin equal to Sins was sampled using Hi-C map obtained in WT CH12 cells (excluding the targeted region from the procedure). This matrix was normalized using Knight-Ruiz balancing algorithm with the juicebox pre −r 5000 command. We constructed these normalized matrices for each biological replicate separately and also for the pooled library (in this case, the unnormalized ligation frequency matrices for each replicate were first summed. Sins were next added and normalization procedure was applied). At the final step of analysis, we first considered each biological replicate separately. We compared the distributions of log2 (Mutant/wild type) Hi-C signals in the two regions (Figure 4A, region I and region II) for each of the samples separately. After confirming reproducibility of the trend, in Figure 4, we used pooled normalized matrices to derive the final estimates of the effect of the genetic manipulations on chromatin topology at the Ifng locus. To estimate the interaction bias of each bin, we inferred the directionality index ((DI) (Dixon et al., 2012)), as implemented in Pekowska et al., 2018 (Pękowska et al., 2018). We considered the normalized interaction matrices at the resolution of 5kb. To calculate the DI of bin i, we computed the sum of the interactions of bin i within the window of 150 kb to the left and the sum of the interactions of bin i within the window of 150 kb to the right.
Statistical analysis
Statistical significance was assessed with non-paired two-tailed Student's t-test.
DATA AND SOFTWARE AVAILABILITY
Raw and analyzed data reported in this paper will be available via NCBI GEO (accession number: GSE132531)
Supplementary Material
Table S1. Related to Figure 5: 3C primers
KEY RESOURCES TABLE
| REAGENT or RESOURCE | SOURCE | IDENTIFIER |
|---|---|---|
| Antibodies | ||
| APC anti-mouse IFN-γ | BD | 554413 |
| BV421 anti-mouse NKp46 | Biolegend | 137611 |
| Alexa Fluor 488 anti-mouse Tbet | BD | 651266 |
| PE anti-mouse CD44 | BD | 553134 |
| APC anti-mouse CD62L | ThermoFisher | 17-0621-83 |
| CTCF | Millipore | 07-729 |
| H3K36me3 | Abcam | ab9050 |
| H3K4me1 | Abcam | Ab8895 |
| H3K27me3 | Millipore | 07-449 |
| H3K27Ac | Abcam | Ab4729 |
| Tbet | Santa Cruz | Sc-21003 |
| Anti-IFN-γ (neutralizing) | BioXCell | BE0055 |
| Bacterial and Virus Strains | ||
| Toxoplasma gondii | Jankovic et al., 2007 | N/A, generated in house |
| LCMV Armstrong | Araki et al., 2017 | N/A, generated in house |
| Biological Samples | ||
| N/A | ||
| Chemicals, Peptides, and Recombinant Proteins | ||
| Recombinant mouse IL-12 | R&D systems | 419-ML-010 |
| Anti-CD3 | BioXCell | BE0001-1 |
| Anti-CD28 | BioXCell | BE0087 |
| Antisense LNA GapmerR | Qiagen | 339511 |
| Critical Commercial Assays | ||
| Nugen Ovation Ultralow Library System V2 | Nugen | 0344NB-32 |
| NEXTflex DNA Barcodes (for Hi-C sequencing) | Bioo Scientific | NOVA-514102 |
| Deposited Data | ||
| Raw and analyzed data | This paper | |
| ChIP Seq (K4me1, K27Ac, Tbet, related to Figure 1) | Iwata et al., 2016 | GEO: GSE96724 |
| ChIP Seq (K27me3, K36me3, related to Figure 1) | Wei et al., 2010 | GEO: GSE22104 |
| RNA Seq (human YFV-specific CD8 T cells, related to Figure 6) | Akondy et al., 2017 | GEO: GSE100745 |
| Experimental Models: Cell Lines | ||
| N/A | ||
| Experimental Models: Organisms/Strains | ||
| C57BL/6J | The Jackson Laboratory | #000664 |
| B6 (Cg)-Rag2tm1.1Cgn/J (Rag2−/−) | The Jackson Laboratory | #008448 |
| NeST KO | This paper | |
| NeST-PolyA KI | This paper | |
| Oligonucleotides | ||
| Taqman Assay Actb | ThermoFisher | Mm00607939_s1 |
| Taqman Assay Ifng | ThermoFisher | Mm01168134_m1 |
| Taqman Custom Assay NeST | ThermoFisher | AIAAY7C |
| For 3C primers see Table 1 | ||
| Recombinant DNA | ||
| N/A | ||
| Software and Algorithms | ||
| TopHat 2.1.0 | Trapnell et al., 2012 | https://ccb.jhu.edu/software/tophat/index.shtml |
| bedtools | Quinlan and Hall, 2010 | http://bedtools.readthedocs.io/en/latest/ |
| Bowtie 0.12.8 | Langmead et al., 2009 | http://bowtie-bio.sourceforge.net/index.shtml |
| FastUniq | Xu et al., 2012 | https://sourceforge.net/projects/fastuniq/ |
| MACS (version 1.4.2) | Zhang et al., 2008 | http://liulab.dfci.harvard.edu/MACS/index.html |
| R 3.0.1 | R Core Team, 2014 | https://www.r-project.org |
| The Integrative Genomics Viewer (IGV) | Thorvaldsdottir et al., 2013 | http://software.broadinstitute.org/software/igv/ |
| Partek Genomics Suite | Partek | http://www.partek.com/pgs |
| Juicer | Durand et al., 2016 | https://www.ncbi.nlm.nih.gov/pmc/articles/PMC5846465/ |
| Other | ||
| N/A | ||
Highlights.
Ifng-as1 regulates Ifng expression locally, in cis without affecting other genes.
Ifng-as1 gene locus, but not its non-coding transcript, impacts chromatin organization.
Ifng and Ifng-as1 transcripts can be discordantly regulated in long-lasting memory cells.
ACKNOWLEDGEMENTS
We thank members of the O'Shea lab for helpful discussions, Gustavo Gutierrez-Cruz (Office of Science and Technology, NIAMS, NIH) for sequencing and the NIAMS Flow Cytometry Group for cell sorting. We also want to thank Florian Hahne for his help with data visualization. This study utilized the high-performance computational capabilities of the Helix System at the National Institutes of Health, Bethesda, MD (http://helix.nih.gov) and was supported by NIAID and NIAMS intramural research programs and the German Research Foundation (DFG to F.P.).
Footnotes
Publisher's Disclaimer: This is a PDF file of an unedited manuscript that has been accepted for publication. As a service to our customers we are providing this early version of the manuscript. The manuscript will undergo copyediting, typesetting, and review of the resulting proof before it is published in its final citable form. Please note that during the production process errors may be discovered which could affect the content, and all legal disclaimers that apply to the journal pertain.
DECLARATION OF INTERESTS
The authors have no competing interests to declare.
REFERENCES
- Akondy RS, Fitch M, Edupuganti S, Yang S, Kissick HT, Li KW, Youngblood BA, Abdelsamed HA, McGuire DJ, Cohen KW, et al. (2017). Origin and differentiation of human memory CD8 T cells after vaccination. Nature 552, 362–367. [DOI] [PMC free article] [PubMed] [Google Scholar]
- Atianand MK, Caffrey DR, and Fitzgerald KA (2017). Immunobiology of Long Noncoding RNAs. Annu. Rev. Immunol. 35, 177–198. [DOI] [PMC free article] [PubMed] [Google Scholar]
- Barutcu AR, Maass PG, Lewandowski JP, Weiner CL, and Rinn JL (2018). A TAD boundary is preserved upon deletion of the CTCF-rich Firre locus. Nat Commun 9, 1444. [DOI] [PMC free article] [PubMed] [Google Scholar]
- Bihl F, Brahic M, and Bureau JF (1999). Two loci, Tmevp2 and Tmevp3, located on the telomeric region of chromosome 10, control the persistence of Theiler's virus in the central nervous system of mice. Genetics 152, 385–392. [DOI] [PMC free article] [PubMed] [Google Scholar]
- Bureau JF, Montagutelli X, Bihl F, Lefebvre S, Guénet JL, and Brahic M (1993). Mapping loci influencing the persistence of Theiler's virus in the murine central nervous system. Nat. Genet. 5, 87–91. [DOI] [PubMed] [Google Scholar]
- Bustamante J, Boisson-Dupuis S, Abel L, and Casanova J-L (2014). Mendelian susceptibility to mycobacterial disease: genetic, immunological, and clinical features of inborn errors of IFN-γ immunity. Semin. Immunol. 26, 454–470. [DOI] [PMC free article] [PubMed] [Google Scholar]
- Cabili MN, Trapnell C, Goff L, Koziol M, Tazon-Vega B, Regev A, and Rinn JL (2011). Integrative annotation of human large intergenic noncoding RNAs reveals global properties and specific subclasses. Genes Dev. 25, 1915–1927. [DOI] [PMC free article] [PubMed] [Google Scholar]
- Cheng L, Wang P, Tian R, Wang S, Guo Q, Luo M, Zhou W, Liu G, Jiang H, and Jiang Q (2019). LncRNA2Target v2.0: a comprehensive database for target genes of lncRNAs in human and mouse. Nucleic Acids Res. 47, D140–D144. [DOI] [PMC free article] [PubMed] [Google Scholar]
- Collier SP, Collins PL, Williams CL, Boothby MR, and Aune TM (2012). Cutting edge: influence of Tmevpg1, a long intergenic noncoding RNA, on the expression of Ifng by Th1 cells. J. Immunol. 189, 2084–2088. [DOI] [PMC free article] [PubMed] [Google Scholar]
- Collier SP, Henderson MA, Tossberg JT, and Aune TM (2014). Regulation of the Th1 genomic locus from Ifng through Tmevpg1 by T-bet. J. Immunol. 193, 3959–3965. [DOI] [PMC free article] [PubMed] [Google Scholar]
- Consortium, T.E.P., Dunham I, Aldred SF, Collins PJ, Davis CA, Doyle F, Epstein CB, Frietze S, Harrow J, Kaul R, et al. An integrated encyclopedia of DNA elements in the human genome. Nature 489, 57EP–. [DOI] [PMC free article] [PubMed] [Google Scholar]
- Cui W, Liu Y, Weinstein JS, Craft J, and Kaech SM (2011). An interleukin-21-interleukin-10-STAT3 pathway is critical for functional maturation of memory CD8+ T cells. Immunity 35, 792–805. [DOI] [PMC free article] [PubMed] [Google Scholar]
- Derrien T, Johnson R, Bussotti G, Tanzer A, Djebali S, Tilgner H, Guernec G, Martin D, Merkel A, Knowles DG, et al. (2012). The GENCODE v7 catalog of human long noncoding RNAs: analysis of their gene structure, evolution, and expression. Genome Res. 22, 1775–1789. [DOI] [PMC free article] [PubMed] [Google Scholar]
- Dixon JR, Selvaraj S, Yue F, Kim A, Li Y, Shen Y, Hu M, Liu JS, and Ren B (2012). Topological domains in mammalian genomes identified by analysis of chromatin interactions. Nature 485, 376–380. [DOI] [PMC free article] [PubMed] [Google Scholar]
- Djebali S, Davis CA, Merkel A, Dobin A, Lassmann T, Mortazavi A, Tanzer A, Lagarde J, Lin W, Schlesinger F, et al. (2012). Landscape of transcription in human cells. Nature 489, 101EP–. [DOI] [PMC free article] [PubMed] [Google Scholar]
- Durand NC, Shamim MS, Machol I, Rao SSP, Huntley MH, Lander ES, and Aiden EL (2016). Juicer Provides a One-Click System for Analyzing Loop-Resolution Hi-C Experiments. Cell Syst 3, 95–98. [DOI] [PMC free article] [PubMed] [Google Scholar]
- Engreitz JM, Haines JE, Perez EM, Munson G, Chen J, Kane M, McDonel PE, Guttman M, and Lander ES (2016). Local regulation of gene expression by lncRNA promoters, transcription and splicing. Nature 539, 452–455. [DOI] [PMC free article] [PubMed] [Google Scholar]
- FANTOM Consortium and the RIKEN PMI and CLST (DGT), Forrest ARR, Kawaji H, Rehli M, Baillie JK, de Hoon MJL, Haberle V, Lassmann T, Kulakovskiy IV, Lizio M, et al. (2014). A promoter-level mammalian expression atlas. Nature 507, 462–470. [DOI] [PMC free article] [PubMed] [Google Scholar]
- Fehniger TA, Suzuki K, Ponnappan A, VanDeusen JB, Cooper MA, Florea SM, Freud AG, Robinson ML, Durbin J, and Caligiuri MA (2001). Fatal leukemia in interleukin 15 transgenic mice follows early expansions in natural killer and memory phenotype CD8+ T cells. J. Exp. Med. 193, 219–231. [DOI] [PMC free article] [PubMed] [Google Scholar]
- Gomez JA, Wapinski OL, Yang YW, Bureau J-F, Gopinath S, Monack DM, Chang HY, Brahic M, and Kirkegaard K (2013). The NeST long ncRNA controls microbial susceptibility and epigenetic activation of the interferon-γ locus. Cell 152, 743–754. [DOI] [PMC free article] [PubMed] [Google Scholar]
- Guttman M, Amit I, Garber M, French C, Lin MF, Feldser D, Huarte M, Zuk O, Carey BW, Cassady JP, et al. (2009). Chromatin signature reveals over a thousand highly conserved large non-coding RNAs in mammals. Nature 458, 223–227. [DOI] [PMC free article] [PubMed] [Google Scholar]
- Hadjur S, Williams LM, Ryan NK, Cobb BS, Sexton T, Fraser P, Fisher AG, and Merkenschlager M (2009). Cohesins form chromosomal cis-interactions at the developmentally regulated IFNG locus. Nature 460, 410–413. [DOI] [PMC free article] [PubMed] [Google Scholar]
- Heinz S, Benner C, Spann N, Bertolino E, Lin YC, Laslo P, Cheng JX, Murre C, Singh H, and Glass CK (2010). Simple combinations of lineage-determining transcription factors prime cis-regulatory elements required for macrophage and B cell identities. Mol. Cell 38, 576–589. [DOI] [PMC free article] [PubMed] [Google Scholar]
- Huang Y, Yang H, Borg BB, Su X, Rhodes SL, Yang K, Tong X, Tang G, Howell CD, Rosen HR, et al. (2007). A functional SNP of interferon-gamma gene is important for interferon-alpha-induced and spontaneous recovery from hepatitis C virus infection. Proc. Natl. Acad. Sci. U.S.a. 104, 985–990. [DOI] [PMC free article] [PubMed] [Google Scholar]
- Isoda T, Moore AJ, He Z, Chandra V, Aida M, Denholtz M, Piet van Hamburg J, Fisch KM, Chang AN, Fahl SP, et al. (2017). Non-coding Transcription Instructs Chromatin Folding and Compartmentalization to Dictate Enhancer-Promoter Communication and T Cell Fate. Cell 171, 103–119.e118. [DOI] [PMC free article] [PubMed] [Google Scholar]
- Ivaldi MS, Diaz LF, Chakalova L, Lee J, Krivega I, and Dean A (2018). Fetal γ-globin genes are regulated by the BGLT3 long noncoding RNA locus. Blood 132, 1963–1973. [DOI] [PMC free article] [PubMed] [Google Scholar]
- Jouanguy E, Altare F, Lamhamedi S, Revy P, Emile JF, Newport M, Levin M, Blanche S, Seboun E, Fischer A, et al. (1996). Interferon-gamma-receptor deficiency in an infant with fatal bacille Calmette-Guérin infection. N. Engl. J. Med. 335, 1956–1961. [DOI] [PubMed] [Google Scholar]
- Katayama S, Tomaru Y, Kasukawa T, Waki K, Nakanishi M, Nakamura M, Nishida H, Yap CC, Suzuki M, Kawai J, et al. (2005). Antisense transcription in the mammalian transcriptome. Science 309, 1564–1566. [DOI] [PubMed] [Google Scholar]
- Kieper WC, Tan JT, Bondi-Boyd B, Gapin L, Sprent J, Ceredig R, and Surh CD (2002). Overexpression of interleukin (IL)-7 leads to IL-15-independent generation of memory phenotype CD8+ T cells. J. Exp. Med. 195, 1533–1539. [DOI] [PMC free article] [PubMed] [Google Scholar]
- Kopp F, and Mendell JT (2018). Functional Classification and Experimental Dissection of Long Noncoding RNAs. Cell 172, 393–407. [DOI] [PMC free article] [PubMed] [Google Scholar]
- Kotzin JJ, Spencer SP, McCright SJ, Kumar DBU, Collet MA, Mowel WK, Elliott EN, Uyar A, Makiya MA, Dunagin MC, et al. (2016). The long non-coding RNA Morrbid regulates Bim and short-lived myeloid cell lifespan. Nature 537, 239–243. [DOI] [PMC free article] [PubMed] [Google Scholar]
- Langmead B, and Salzberg SL (2012). Fast gapped-read alignment with Bowtie 2. Nat. Methods 9, 357–359. [DOI] [PMC free article] [PubMed] [Google Scholar]
- Lees JR (2015). Interferon gamma in autoimmunity: A complicated player on a complex stage. Cytokine 74, 18–26. [DOI] [PubMed] [Google Scholar]
- Li W, Notani D, Ma Q, Tanasa B, Nunez E, Chen AY, Merkurjev D, Zhang J, Ohgi K, Song X, et al. (2013). Functional roles of enhancer RNAs for oestrogen-dependent transcriptional activation. Nature 498, 516–520. [DOI] [PMC free article] [PubMed] [Google Scholar]
- Lipton HL (1975). Theiler's virus infection in mice: an unusual biphasic disease process leading to demyelination. Infect. Immun. 11, 1147–1155. [DOI] [PMC free article] [PubMed] [Google Scholar]
- Lupiáñez DG, Kraft K, Heinrich V, Krawitz P, Brancati F, Klopocki E, Horn D, Kayserili H, Opitz JM, Laxova R, et al. (2015). Disruptions of topological chromatin domains cause pathogenic rewiring of gene-enhancer interactions. Cell 161, 1012–1025. [DOI] [PMC free article] [PubMed] [Google Scholar]
- Narendra V, Rocha PP, An D, Raviram R, Skok JA, Mazzoni EO, and Reinberg D (2015). CTCF establishes discrete functional chromatin domains at the Hox clusters during differentiation. Science 347, 1017–1021. [DOI] [PMC free article] [PubMed] [Google Scholar]
- Necsulea A, Soumillon M, Warnefors M, Liechti A, Daish T, Zeller U, Baker JC, Grützner F, and Kaessmann H (2014). The evolution of lncRNA repertoires and expression patterns in tetrapods. Nature 505, 635–640. [DOI] [PubMed] [Google Scholar]
- Newport MJ, Huxley CM, Huston S, Hawrylowicz CM, Oostra BA, Williamson R, and Levin M (1996). A mutation in the interferon-gamma-receptor gene and susceptibility to mycobacterial infection. N. Engl. J. Med. 335, 1941–1949. [DOI] [PubMed] [Google Scholar]
- Nora EP, Lajoie BR, Schulz EG, Giorgetti L, Okamoto I, Servant N, Piolot T, van Berkum NL, Meisig J, Sedat J, et al. (2012). Spatial partitioning of the regulatory landscape of the X-inactivation centre. Nature 485, 381–385. [DOI] [PMC free article] [PubMed] [Google Scholar]
- O'Connell RM, Rao DS, Chaudhuri AA, and Baltimore D (2010). Physiological and pathological roles for microRNAs in the immune system. Nat. Rev. Immunol. 10, 111–122. [DOI] [PubMed] [Google Scholar]
- Pękowska A, Klaus B, Xiang W, Severino J, Daigle N, Klein FA, Oleś M, Casellas R, Ellenberg J, Steinmetz LM, et al. (2018). Gain of CTCF-Anchored Chromatin Loops Marks the Exit from Naive Pluripotency. Cell Syst 7, 482–495.e10. [DOI] [PMC free article] [PubMed] [Google Scholar]
- Rubinstein MP, Lind NA, Purton JF, Filippou P, Best JA, McGhee PA, Surh CD, and Goldrath AW (2008). IL-7 and IL-15 differentially regulate CD8+ T-cell subsets during contraction of the immune response. Blood 112, 3704–3712. [DOI] [PMC free article] [PubMed] [Google Scholar]
- Sanborn AL, Rao SSP, Huang S-C, Durand NC, Huntley MH, Jewett AI, Bochkov ID, Chinnappan D, Cutkosky A, Li J, et al. (2015). Chromatin extrusion explains key features of loop and domain formation in wild-type and engineered genomes. Proc. Natl. Acad. Sci. U.S.a. 112, E6456–E6465. [DOI] [PMC free article] [PubMed] [Google Scholar]
- Schroder K, Hertzog PJ, Ravasi T, and Hume DA (2004). Interferon-gamma: an overview of signals, mechanisms and functions. J. Leukoc. Biol. 75, 163–189. [DOI] [PubMed] [Google Scholar]
- Sekimata M, Pérez-Melgosa M, Miller SA, Weinmann AS, Sabo PJ, Sandstrom R, Dorschner MO, Stamatoyannopoulos JA, and Wilson CB (2009). CCCTC-binding factor and the transcription factor T-bet orchestrate T helper 1 cell-specific structure and function at the interferon-gamma locus. Immunity 31, 551–564. [DOI] [PMC free article] [PubMed] [Google Scholar]
- Smale ST, Plevy SE, Weinmann AS, Zhou L, Ramirez-Carrozzi VR, Pope SD, Bhatt DM, and Tong A-J (2013). Toward an understanding of the gene-specific and global logic of inducible gene transcription. Cold Spring Harb. Symp. Quant. Biol. 78, 61–68. [DOI] [PubMed] [Google Scholar]
- Spurlock CF, Shaginurova G, Tossberg JT, Hester JD, Chapman N, Guo Y, Crooke PS, and Aune TM (2017). Profiles of Long Noncoding RNAs in Human Naive and Memory T Cells. J. Immunol. 199, 547–558. [DOI] [PMC free article] [PubMed] [Google Scholar]
- Tan-Wong SM, Wijayatilake HD, and Proudfoot NJ (2009). Gene loops function to maintain transcriptional memory through interaction with the nuclear pore complex. Genes Dev. 25, 2610–2624. [DOI] [PMC free article] [PubMed] [Google Scholar]
- Toiber D, Leprivier G, and Rotblat B (2017). Long noncoding RNA: noncoding and not coded. Cell Death Discov 5, 16104. [DOI] [PMC free article] [PubMed] [Google Scholar]
- Tsujimura T, Klein FA, Langenfeld K, Glaser J, Huber W, and Spitz F (2015). A discrete transition zone organizes the topological and regulatory autonomy of the adjacent tfap2c and bmp7 genes. PLoS Genet. 11, e1004897. [DOI] [PMC free article] [PubMed] [Google Scholar]
- Ulitsky I, and Bartel DP (2013). lincRNAs: genomics, evolution, and mechanisms. Cell 154, 26–46. [DOI] [PMC free article] [PubMed] [Google Scholar]
- Vian L, Pękowska A, Rao SSP, Kieffer-Kwon K-R, Jung S, Baranello L, Huang S-C, Khattabi El, L., Dose M, Pruett N, et al. (2018). The Energetics and Physiological Impact of Cohesin Extrusion. Cell 175, 292–294. [DOI] [PMC free article] [PubMed] [Google Scholar]
- Vigneau S, Rohrlich P-S, Brahic M, and Bureau J-F (2003). Tmevpg1, a candidate gene for the control of Theiler's virus persistence, could be implicated in the regulation of gamma interferon. J. Virol. 77, 5632–5638. [DOI] [PMC free article] [PubMed] [Google Scholar]
- Wang KC, Yang YW, Liu B, Sanyal A, Corces-Zimmerman R, Chen Y, Lajoie BR, Protacio A, Flynn RA, Gupta RA, et al. (2011). A long noncoding RNA maintains active chromatin to coordinate homeotic gene expression. Nature 472, 120–124. [DOI] [PMC free article] [PubMed] [Google Scholar]
- Werner MS, and Ruthenburg AJ (2015). Nuclear Fractionation Reveals Thousands of Chromatin-Tethered Noncoding RNAs Adjacent to Active Genes. Cell Rep 12, 1089–1098. [DOI] [PMC free article] [PubMed] [Google Scholar]
- Xu H, Luo X, Qian J, Pang X, Song J, Qian G, Chen J, and Chen S (2012). FastUniq: a fast de novo duplicates removal tool for paired short reads. PLoS ONE 7, e52249. [DOI] [PMC free article] [PubMed] [Google Scholar]
- Yap GS, and Sher A (1999). Cell-mediated immunity to Toxoplasma gondii: initiation, regulation and effector function. Immunobiology 201, 240–247. [DOI] [PubMed] [Google Scholar]
- Zang C, Schones DE, Zeng C, Cui K, Zhao K, and Peng W (2009). A clustering approach for identification of enriched domains from histone modification ChIP-Seq data. Bioinformatics 25, 1952–1958. [DOI] [PMC free article] [PubMed] [Google Scholar]
- Zhang Y, Liu T, Meyer CA, Eeckhoute J, Johnson DS, Bernstein BE, Nusbaum C, Myers RM, Brown M, Li W, et al. (2008). Model-based analysis of ChIP-Seq (MACS). Genome Biol. 9, R137. [DOI] [PMC free article] [PubMed] [Google Scholar]
- Zhao Y, Li H, Fang S, Kang Y, Wu W, Hao Y, Li Z, Bu D, Sun N, Zhang MQ, et al. (2016). NONCODE 2016: an informative and valuable data source of long non-coding RNAs. Nucleic Acids Res. 44, D203–D208. [DOI] [PMC free article] [PubMed] [Google Scholar]
Associated Data
This section collects any data citations, data availability statements, or supplementary materials included in this article.
Supplementary Materials
Table S1. Related to Figure 5: 3C primers
Data Availability Statement
Raw and analyzed data reported in this paper will be available via NCBI GEO (accession number: GSE132531)