Abstract
Introduction:
Visceral fat, also known as visceral adipose tissue (VAT), has been the focus of intensive research over the past several years, as ground breaking studies have investigated its possible role in predicting long term cardiac dysfunction, hypertension, and diabetes. Historically, Magnetic Resonance Imaging and Computed Tomography were the instruments of choice for visceral fat quantification. However, with the introduction of visceral fat assessment software for Dual-Energy X-Ray Absorptiometry (DXA) scanners, DXA’s use for VAT assessment has become increasingly common. To effectively utilize DXA in future VAT research studies, information about their precision and accuracy must be known. This study provides novel information regarding the precision of the Hologic Horizon DXA scanner in the assessment of VAT.
Methods:
60 individuals (32.7±17.1 years, 51% male, 40% with BMI>25 kg/m2) above the age of 16 years were recruited to participate in this study. Subjects found to be pregnant, have a lumbar vertebral compression fracture, non-removable metal implants in the abdomen, or scoliosis/lordosis/kyphosis were excluded from the study. All subjects underwent three consecutive whole body scans on a Hologic Horizon A DXA scanner.
Results:
VAT mass ranged from 102g-1454g. VAT precision improved with increasing BMI (p=0.025): CV% was 15.2% for underweight subjects (n=2), 7.1% for healthy subjects (n=34), 6.4% for overweight subjects (n=18), and 4.7% for obese subjects (n=6).
Conclusions:
VAT measurement by Hologic DXA displays a satisfactory level of precision in individuals with a body mass index of >18.5kg/m2. Precision was found to be higher in those with the greatest risk of cardio-metabolic dysfunction (individuals with high VAT). Due to its low cost, brief examination time, non-invasiveness, and limited radiation exposure, DXA may be considered the tool of choice for VAT determination in future studies.
Keywords: Visceral Fat, Dual Energy X-Ray Absorptiometry, Precision
Introduction:
Visceral fat, also known as visceral adipose tissue (VAT), is found lining and filling the abdominal cavity. Its primary purpose is to protect organs from mechanical damage. Recent studies have proposed that VAT may also play a role in producing endocrine cytokines that support and activate the immune system.(1) Measurement of VAT as a predictor of poor health outcomes has become increasingly common in recent years; in 2012, ground-breaking research using computed tomography (CT) indicated that VAT was strongly linked to comorbidities such as type 2 diabetes and high blood pressure, in addition to early mortality.(2) A separate study also indicated that VAT is predictive of dementia risk.(3) With the recent introduction of VAT assessment software in the Hologic Dual Energy X-Ray Absorptiometry (DXA, Apex software) and General Electric (GE) Lunar iDXA (CoreScan software), VAT quantification is no longer confined to CT or Magnetic Resonance Imaging (MRI) measurements, which can be expensive, invasive, or have increased radiation exposure. Both CT and MRI have been validated against cadavers in their estimations of VAT,(4,5) and previous comparison studies have indicated that VAT assessments by CT and MRI are significantly correlated with those measured by DXA.(6,7,8) This affirms DXA’s accuracy in the measurement of true VAT. Furthermore, recent studies have replicated the relationship between VAT and comorbidities using DXA.(9,10) Because DXA is a cost effective and low radiation alternative to CT and MRI, quantifying the precision of VAT assessment is vital for planning investigational studies and determining sample size.
There are two major types of DXA manufacturers: Lunar/GE and Hologic. As a previous commentary on bone precision states, “Until precision studies are performed, the least significant change cannot be determined for any level of statistical confidence, making the interpretation of serial studies impossible.”(11) In essence, without preliminary precision studies, further investigation into VAT by DXA is severely hampered. The earliest study into the precision of VAT was done in 2013 on a Lunar iDXA (12), a year after CoreScan software implementation, and the majority of VAT precision studies have also been performed in Lunar scanners.(13) These investigations have indicated that in Lunar Scanners, VAT precision improves with a higher body mass index (BMI) (14), and that the coefficient of variation may range from 5.1%−54% depending on an individual’s BMI. The previous research performed in Hologic DXA scanners have had many limitations. A previous study comparing DXA to MRI suggested a VAT %CV of 6.7% in overweight women, however the precision estimates were confined to 9 subjects. (15) Other research using the Hologic APEX software has focused on the reproducibility and clinical utility of DXA in the assessment of VAT by taking a longitudinal approach to collecting VAT values, rather cross-sectional.(16,17) The present study will expand upon these previously observed results, with focus into the effect of BMI on VAT precision.
Therefore, this study quantified VAT precision from whole body Hologic DXA scans in a healthy and diverse U.S. based population. Additionally, we investigated age, gender, and BMI differences in VAT, and compared DXA-generated indices to similar anthropometric measures.
Methods:
This study was conducted in a convenience sample of healthy individuals above 16 years of age from June 2017 to December 2018. Individuals were excluded from study participation if they had a BMI of above 40 kg/m2 (due to Hologic DXA table limitations), were pregnant, had non-removable metal implants in the abdomen, had scoliosis/lordosis/kyphosis, or if they had suffered a lumbar vertebral compression fracture. Potential subjects were introduced to this study through disseminated fliers, word of mouth, and weekly newsletters at a local University (identity retracted for peer review). Written consent was obtained from all subjects or legal guardians, and assent from subjects 16–17 years. The protocol was approved by the Institutional Review Board at our institution (identity retracted).
Each subject was measured by a single anthropometrist: height, weight, and waist to hip ratios were collected. While only one height and weight was collected, three waist/hip measurements were gathered per subject, and the average used for statistics. Menstruating female subjects were each required to provide a urine sample for pregnancy testing, which was assessed via Quidel QuickVue HCG (San Diego, CA) urine tests, prior to DXA scan.
Each subject underwent three sequential whole body array scans on a Horizon A scanner (Hologic APEX software v.5.6.0.4, Waltham, MA). As Bredella et al. has previously described, in order to identify visceral fat within a DXA scan, Hologic software locates the inner and outer margins of both sides abdominal wall as calculated by body composition profiles in a region with a 5 cm height across the abdomen at approximately the height of L4/L5, with the bottom edge situated 1 cm above the iliac crest. The software then measures the total fat mass within the abdominal walls, a region which contains both subcutaneous and visceral fat. To generate total VAT, the fat tissue is calculated for the entirety of the abdominal region. All area denoted by reference markers as “subcutaneous fat” is then subtracted from this number, to generate VAT.(18) When applicable, the automatically generated reference lines denoting the separation between subcutaneous and visceral fat were manually revised if they were deemed inaccurate by the analyst. Subjects were asked to get off the scanner and be repositioned between each scan. All scans were performed by one certified DXA technician. Analysis of scans were done by a single analyst, separate from the DXA technician.
Statistical Analysis
Variables were initially visually represented via scatterplot to look for outliers, then summarized (means ± SD) using t-tests. Chi-squared was used to describe differences in categorical data such as gender, ethnicity, or proportions of subjects. “Average” or “mean” numbers described in figures are the mean of all three, whole body DXA measurements for each subject. All tests were two-tailed with a threshold for significance of p<0.05. Individual body mass index (BMI) data was categorized according to the CDC criteria: <18.5 kg/m2 were classified as underweight, 15.5 to 24.9 kg/m2 healthy weight, 25.0 to 29.9 kg/m2 overweight, and ≥30 kg/m2 as obese.(19) Subjects were also categorized as adolescent or adult, with adults defined by an age of ≥21.0 years. Data was analyzed using STATA v15 (College Station, TX) and Microsoft Excel 2013.
The Coefficient of Variation (%CV) for our cohort was calculated using the equation provided by the International Society of Clinical Densitometry (ICSD):
Results:
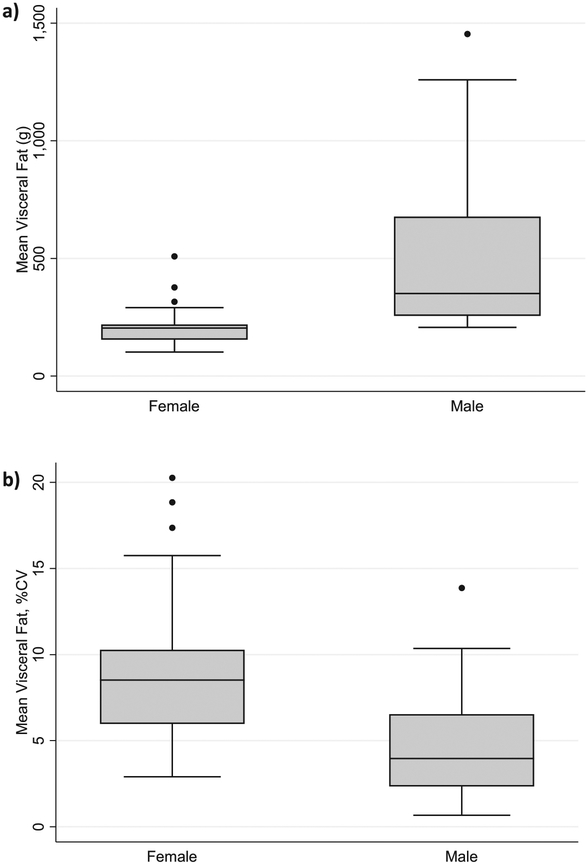
60 healthy subjects (32.7±17.1 years, range: 16–67 years, 51% male) participated in this study. Mean BMI of males in this cohort was >25 kg/m2, indicating that the majority in this cohort were overweight or obese. (Table 1) Men were also found to have significantly more VAT than women. (Figure 1)
Table 1:
Demographic and Body Composition Characteristics for Healthy Enrolled Subjects, by Gender
| Total | Male | Female | p-valuea | |
|---|---|---|---|---|
| No. of Subjects | 60 | 31 | 29 | |
| Age, years | 32.7 ±17.1 | 37.7 ± 18.5 | 27.3 ± 13.9 | 0.017 |
| Height, cm | 169.8 ±12.1 | 178.0 ± 8.5 | 161.1 ±9.0 | <0.001 |
| Weight, kg | 71.7 ±19.1 | 84.1 ± 17.0 | 58.5 ± 10.2 | <0.001 |
| BMIb, kg/m2 | 24.5 ±4.4 | 26.5 ±4.6 | 22.5 ±3.1 | <0.001 |
| Whole Body Fatc, % | 29.7 ±6.4 | 26.5 ±5.9 | 33.2 ±5.0 | <0.001 |
| Visceral Fat, g | 363 ± 287 | 509 ±331 | 208 ± 87 | <0.001 |
| Android to Gynoid Ratiod | 0.95 ±0.20 | 1.05 ±0.21 | 0.84 ±0.11 | <0.001 |
| Waist to Hip Ratioe | 0.91 ±0.08 | 0.96 ± 0.07 | 0.86 ±0.07 | <0.001 |
For continuous variables, data is presented as mean ±SD, and p-values are generated from t-tests for differences between males and females. For categorical variables, data is presented as a % of total subject’s population p-values are from chi-squared with Fisher’s exact follow-up test. P-values were considered statistically significant at a level of p<0.05.
BMI: body mass index, calculated as kg/m2.
Whole body fat percentage generated from average analysis of 3 whole body DXA scans.
Android/Gynoid Ratio calculated from average analysis of 3 whole body DXA scans.
Waist to Hip Ratio, average of 3 anthropometric measures per subject.
Figure 1: Visceral Fat (Absolute and Precision) Derived from Whole Body DXA Scan, Separated by Gender.
a) Difference in VAT by gender, p<0.001, 1b) Difference in VAT precision by gender, P<0.001.
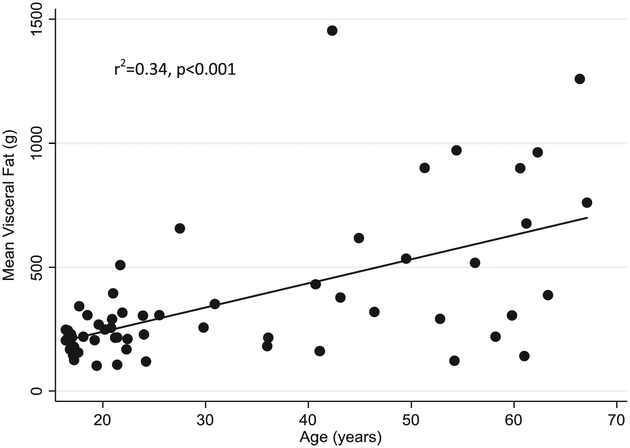
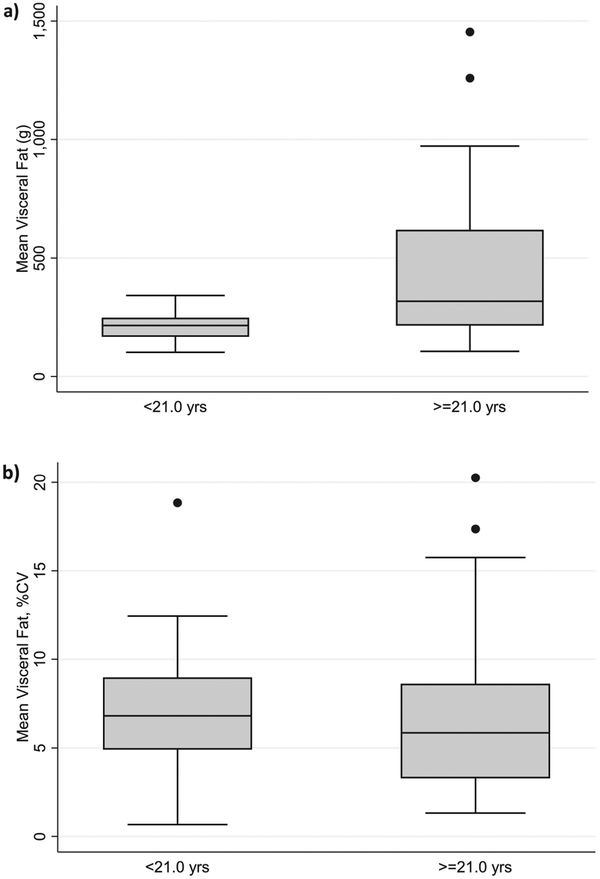
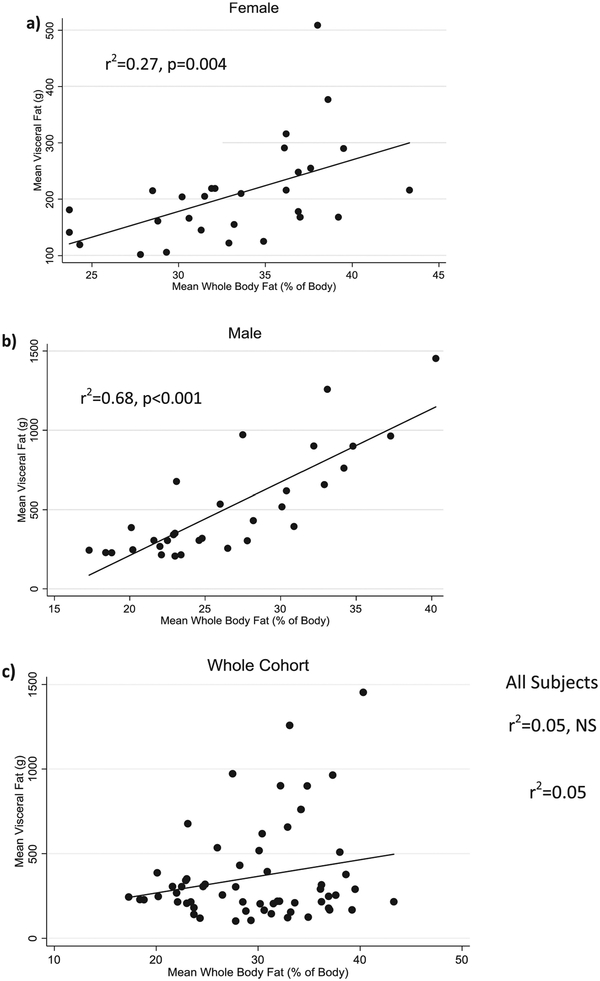
Age was positively correlated with VAT deposition (r2=0.34, p<0.001, Figure 2), a result that was primarily driven by the male subjects (r2=0.43, p<0.001) as there was no correlation between age and VAT in females. The relationship remained significant, even after adjustment for height and whole body fat (R2=0.51, p=0.01). While absolute visceral fat was significantly higher in adults than adolescents (p=0.002), precision (demonstrated by %CV) was found to be similar between age groups (Figure 3). Whole body fat (as a percentage of total body weight) was also found to be positively correlated to mean VAT in both women (R2=0.31, p=0.004) and men (R2=0.75, p<0.001) after controlling for age and height. When the two gender groups were combined without covariates, whole body fat percentage was no longer significantly correlated to mean VAT (r2=0.05, NS). (Figure 4)
Figure 2:
Mean Visceral Fat is Significantly Correlated with Age in All Subjects
Figure 3: Visceral Fat is Significantly Higher in Adults vs. Adolescents, but Precision is Similar.
a) Difference in VAT by age category (Adolescents vs. Adults, p<0.02), 3b) Difference in VAT precision by age category (p=NS).
Figure 4:
Visceral Fat is Significantly Correlated with Whole Body Fat in Men and Women when Analyzed Separately, but not when Combined (Unadjusted)
The variability of VAT measurement (%CV) was lower in individuals with a larger BMI. For individuals who were considered underweight by CDC criteria, BMI <18.5 kg/m2 (n=2, female, age: 54 and 61 years), measurement of VAT had the poorest precision (10.2% and 20.3%CV). When variability in VAT measurement is categorized by BMI, there is a significant stepwise decrease in %CV as BMI level increases (Table 2, p=0.025). Females were found to have double the %CV of male subjects (9.2% in females, 4.8% in males, p<0.001).
Table 2:
Absolute Visceral Fat (g and cm3) and Visceral Fat Variability by BMI Criteria
| Underweight BMI <18.5 kg/m2 | Healthy Weight BMI 18.5–24.9 kg/m2 | Overweight BMI 25–29.9 kg/m2 | Obese BMI ≥ 30 kg/m2 | |||||
|---|---|---|---|---|---|---|---|---|
| N in Group | 2 | 34 | 18 | 6 | ||||
| Units | g | Cm3 | g | Cm3 | g | Cm3 | g | Cm3 |
| Visceral Fat Amount | 132±13 | 142±15 | 222±75 | 240±81 | 471±285 | 509±308 | 917±300 | 992±324 |
| %CVa,b | 15.2% | 15.2% | 7.1% | 7.2% | 6.4% | 6.3% | 4.7% | 4.7% |
Calculation for coefficient of variance (%CV) is presented in the statistical analysis section of the manuscript. Data calculated from analysis of 3 whole body DXA scans per subject.
Significantly different by BMI category, p=0.025 (ANOVA).
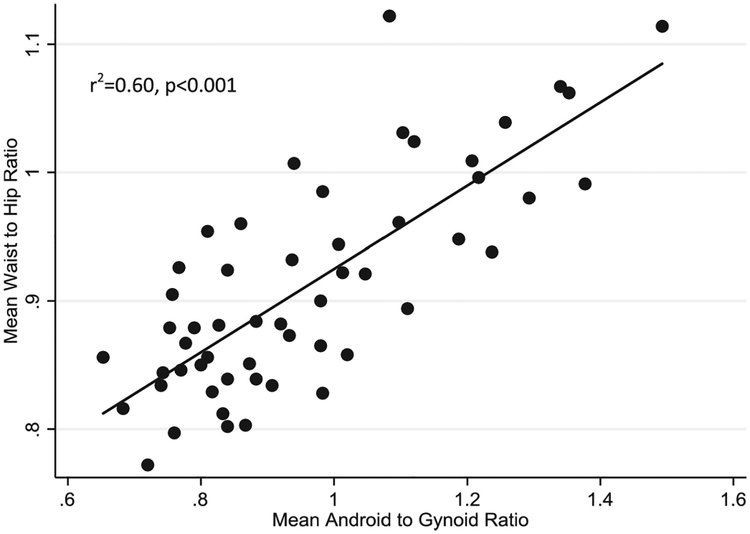
The android and gynoid measures generated by whole body DXA scan analysis displayed a significant positive correlation with anthropometric waist to hip measurements (r2=0.60, p<0.001) (Figure 5). While this correlation was found to be significant in both sexes, the correlation was found to be stronger in males (r2=0.60, p<0.001 in males vs. r2=0.30, p=0.006 in females).
Figure 5:
Anthropometric Waist to Hip Ratio Correlates with Android to Gynoid Ratios Derived from DXA
Discussion:
VAT precision for lean and overweight subjects by Hologic DXA is markedly different than that of Lunar iDXA, which calculates its %CV of VAT measurements to be between 5.1% and 54%. (12,13, 14) However, in the VAT quantification of obese individuals, both the Lunar iDXA and Hologic DXA perform similarly (5.1% Lunar vs. 4.7% Hologic).(9) These results suggest that both Lunar iDXA’s and Hologic DXA’s are suitable for quantifying VAT in obese subjects. Given that the Hologic DXA’s precision lowered to 15% in the few underweight individuals assessed (BMI <18.5 kg/m2), if a greater degree of precision is desired scientists may be advised to consider techniques such as MRI or CT.
A previous study compared VAT measurement by a Hologic scanner to MRI in a cohort of 67 women with polycystic ovarian syndrome.(15) The study concluded the %CV of VAT measurement to be 6.7%, for a small subsample of their cohort (9 out of 67 subjects), but did not provide separate analysis by BMI or gender. Despite including a relatively small number of individuals to generate %CV, and only having women in their cohort, the %CV value closely mirrors the %CV in obese individuals within the current study. This is likely due to the mean BMI of their cohort being 32.8±4.6 kg/m2, which would further reinforce our conclusion that VAT precision improves as BMI increases. A separate investigation into VAT precision was done three years ago by a Master’s student studying at Clemson University.(20) Though the work has yet to be formally published, the findings are nevertheless a reference point for Hologic visceral fat precision. A %CV of 15.95% was reported for their entire cohort (n=42, 7 male), a value much higher than what is observed within healthy individuals in the present study. We hypothesize this difference is likely driven by the high proportion of females (83%) in their cohort. In the current study, females had nearly double the %CV of men in VAT, though similar %CV in whole body fat percentage (1.2% vs 1.3%, male vs female, data not shown). Other studies which have investigated the reproducibility of VAT measurement using Hologic DXA are not comparable with the present study, due to their longitudinal study design (weeks between duplicate measurements).(16,17)
As whole body fat increases, VAT presumably increases proportionally.(21) The present study found that whole body fat was significantly correlated with VAT in both males and females, though the slope of the correlation differed by gender. Etiologies behind fat deposition differences between the sexes are not fully understood, though a review study from 2012 has implicated sex hormones as the primary instigator of gender differences in VAT accumulation.(22) This is evidenced by visceral adiposity rising during the peri-menopausal transition when estrogen levels are low, and by women with polycystic ovarian syndrome who display hyperandrogenism and frequently exhibit an increase in VAT.(23,24) The lack of a significant correlation between VAT and whole body fat in all subjects may have been due to radical differences in fat deposition between males and females; females primarily deposit subcutaneous fat in the gynoid area, while males develop VAT in the abdomen. Due to these dispositions, males and females each display significant, but very differentially driven correlations between visceral and whole body fat. When combined, these correlations combat each other and obscure any overarching deposition pattern, leading to a lack of significance. In the whole cohort, lower VAT values were indicative of a higher %CV. This same phenomenon is leading to the high %CV observed in women, due to their inherent tendency to have less VAT than their male counterparts.
VAT has historically been measured by either MRI or CT. However, due to the expense and time limitations of most MRI scanners, and the radiation exposure exhibited by CT, finding a viable alternative is paramount. There are no published guidelines on what is considered to be an acceptable %CV for a novel instrumentation. Given this lack of relevant information, we may only state that Hologic scanners have shown precision in-line with previously reported %CV’s in Lunar iDXA machines. The precision of VAT quantification by MRI and CT has been found to be within the 1–3% (%CV) range--better than that of DXA (in normal and overweight subjects).(25,26) The present findings reinforce that given the many strengths of DXA instrumentation, DXA may be utilized for the measurement of VAT in investigational settings, unless a subject is too large for the scanner table (>450lbs/204kg), or has a BMI<18.5 kg/m2, wherein the increased precision of MRI/CT will be required to precisely determine their VAT mass.
VAT measurement is less precise than that of whole body fat assessment by DXA, where literature reports range from 1.9%−3.5% (%CV) for whole body fat percentage, and 0.7%−2.0% for lumbar spine bone mineral density (BMD). (27,28) In comparison, our study measured whole body fat percentage %CV to be 1.2%, and 0.8% for lumbar spine BMD (data not shown). The imprecision demonstrated by VAT is likely due to DXA’s limited ability to fully differentiate visceral from subcutaneous fat in the abdominal region and the inherent variability caused by analyst-initiated reference line placement. Measurements are more precise in obese individuals because each movement of the reference lines in the DXA analysis software increases or decreases their fat compartments by a smaller proportion than it would on a lean individual, which subsequently leads to less analyst-initiated variation. As software is refined and becomes better at differentiating the density of visceral versus subcutaneous fat tissue, the precision of VAT assessments by DXA should continue to increase, making it an even more robust tool.
While this study was well-executed and straightforward, there were several limitations. Variation in subject positioning, subjectivity in the analysis, and instrument variability may all lead to measurement error.(29,30) We reduced these sources of possible error wherever possible by having all scans conducted by one certified DXA technician, one separate analyst, and a single scanning device. Artifacts may also have created artificial variability in VAT. This was mediated by a preclusion of individuals with any significant pelvic or abdominal abnormality that may have interfered with or influenced reference line placement.
Conclusion:
The precision of VAT measurement by Hologic DXA is within previously observed precision ranges. Precision is further improved when measuring overweight or obese subjects. However, in comparison to other DXA parameters such as bone or subcutaneous fat, the coefficient of variation for VAT remains relatively high. Given this, the software used by the Hologic DXA to quantify VAT may require further refinement. Due to the precision of the method being worse in underweight individuals, this report suggests that DXA be recommended for use in investigational quantification of VAT in individuals with a BMI>18.5 kg/m2.
Acknowledgements:
The authors would like to thank to thank all of the study participants for taking part in our study, our DXA technician (name retracted), and the SD Jr. Bechtel Foundation for providing funding for this study. This study was also supported in part by an NIH summer student training grant, R25 HL125451.
Footnotes
Publisher's Disclaimer: This is a PDF file of an unedited manuscript that has been accepted for publication. As a service to our customers we are providing this early version of the manuscript. The manuscript will undergo copyediting, typesetting, and review of the resulting proof before it is published in its final citable form. Please note that during the production process errors may be discovered which could affect the content, and all legal disclaimers that apply to the journal pertain.
References
- (1).Batra A, & Siegmund B The Role of Visceral Fat. Digestive Diseases, 2012; 30(1), 70–74. [DOI] [PubMed] [Google Scholar]
- (2).Katzmarzyk PT, Mire E, Bouchard C. Abdominal obesity and mortality: The Pennington Center Longitudinal Study. Nutr Diabetes. 2012;2:e42. [DOI] [PMC free article] [PubMed] [Google Scholar]
- (3).Whitmer RA, Gustafson DR, Barrett-Connor E, Haan MN, Gunderson EP, & Yaffe K 2008. Central obesity and increased risk of dementia more than three decades later. Neurology. 71(14), 1057–1064. [DOI] [PubMed] [Google Scholar]
- (4).Abate N, Burns D, Peshock RM, Garg A, & Grundy SM Estimation of adipose tissue mass by magnetic resonance imaging: validation against dissection in human cadavers. J Lipid Research. 1994; 8, 1490–1496. [PubMed] [Google Scholar]
- (5).Rössner S, Bo WJ, Hiltbrandt E, et al. Adipose tissue determinations in cadavers--a comparison between cross-sectional planimetry and computed tomography. International J Obesity. 1990; 10, 893–902. [PubMed] [Google Scholar]
- (6).Scherzer R, Shen W, Bacchetti P, et al. Comparison of dual-energy X-ray absorptiometry and magnetic resonance imaging-measured adipose tissue depots in HIV-infected and control subjects. Amer J Clin Nutr 2008; 88(4), 1088–96. [DOI] [PMC free article] [PubMed] [Google Scholar]
- (7).Laddu DR, Lee VR, Blew RM, Sato T, Lohman TG, Going SB Predicting visceral adipose tissue by MRI using DXA and anthropometry in adolescents and young adults. Inter J Body Comp Res, 2012;10(4), 93–100. [PMC free article] [PubMed] [Google Scholar]
- (8).Bredella MA, Gill CM, Keating LK, et al. Assessment of abdominal fat compartments using DXA in premenopausal women from anorexia nervosa to morbid obesity. Obesity (Silver Spring, Md.), 2013;21(12), 2458–64. [DOI] [PMC free article] [PubMed] [Google Scholar]
- (9).Direk K, Cecelja M, Astle W, et al. The relationship between DXA-based and anthropometric measures of visceral fat and morbidity in women. BMC Cardiovasc Disord. 2013;13:25. [DOI] [PMC free article] [PubMed] [Google Scholar]
- (10).Sasai H, Brychta RJ, Wood RP, et al. Does Visceral Fat Estimated by Dual-Energy X-ray Absorptiometry Independently Predict Cardiometabolic Risks in Adults? J Diabetes Sci Technol. 2015;9(4):917–24. [DOI] [PMC free article] [PubMed] [Google Scholar]
- (11).Bonnick SL, Johnston CC Jr., Kleerekoper M, et al. Importance of precision in bone density measurements. J Clin Densitom. 2001;4(2):105–10. [DOI] [PubMed] [Google Scholar]
- (12).Rothney MP, Xia Y, Wacker WK, et al. Precision of a new tool to measure visceral adipose tissue (VAT) using dual-energy X-Ray absorptiometry (DXA). Obesity (Silver Spring). 2013;21(1):E134–6. [DOI] [PubMed] [Google Scholar]
- (13).Meredith-Jones K, Haszard J, Stanger N, Taylor R. Precision of DXA-Derived Visceral Fat Measurements in a Large Sample of Adults of Varying Body Size. Obesity (Silver Spring). 2018;26(3):505–12. [DOI] [PubMed] [Google Scholar]
- (14).Mellis MG, Oldroyd B, Hind K. In vivo precision of the GE Lunar iDXA for the measurement of visceral adipose tissue in adults: the influence of body mass index. Eur J Clin Nutr. 2014;68(12):1365–7. [DOI] [PubMed] [Google Scholar]
- (15).Frøssing S, Nylander MC, Chabanova E, Kistorp C, Skouby SO, Faber J. Quantification of visceral adipose tissue in polycystic ovary syndrome: dual-energy X-ray absorptiometry versus magnetic resonance imaging. Acta Radiologica. 2017;59(1):13–17. [DOI] [PubMed] [Google Scholar]
- (16).Katzmarzyk PT, Greenway FL, Heymsfield SB, Bouchard C. Clinical utility and reproducibility of visceral adipose tissue measurements derived from dual-energy X-ray absorptiometry in White and African American adults. Obesity (Silver Spring). 2013;21(11):2221–4. [DOI] [PMC free article] [PubMed] [Google Scholar]
- (17).Tinsley GM, Forsse JS, Morales E, Grandjean PW. Dual-energy X-ray absorptiometry visceral adipose tissue estimates: reproducibility and impact of pre-assessment diet. European Journal of Clinical Nutrition. 2017;72(4):609–612 [DOI] [PubMed] [Google Scholar]
- (18).Bredella MA, Gill CM, Keating LK, et al. Assessment of abdominal fat compartments using DXA in premenopausal women from anorexia nervosa to morbid obesity. Obesity (Silver Spring). 2013;21(12):2458–64. [DOI] [PMC free article] [PubMed] [Google Scholar]
- (19).CDC. About Adult BMI. Available at: www.cdc.gov/healthyweight/assessing/bmi/adult_bmi/index.html#InterpretedAdults Accessed March 9th, 2019.
- (20).Nadia MGN. Mathematical Properties that Influence Least Significant Change of Body Composition and Bone Mineral Density Measured by Dual Energy X-Ray Absorptiometry. Available at https://tigerprints.clemson.edu/all_theses/2509/. Accessed December 27th, 2018.
- (21).Saelens BE, Seeley RJ, van Schaick K, Donnelly LF, O’Brien KJ. Visceral abdominal fat is correlated with whole-body fat and physical activity among 8-y-old children at risk of obesity. Am J Clin Nutr. 2007;85(1):46–53. [DOI] [PMC free article] [PubMed] [Google Scholar]
- (22).Karastergiou K, Smith SR, Greenberg AS, Fried SK Sex differences in human adipose tissues - the biology of pear shape. Biology of sex differences, 2012;3(1), 13. [DOI] [PMC free article] [PubMed] [Google Scholar]
- (23).Toth MJ, Tchernof A, Sites CK, Poehlman ET. Effect of menopausal status on body composition and abdominal fat distribution. Int J Obes Relat Metab Disord. 2000;24:226–231. [DOI] [PubMed] [Google Scholar]
- (24).Puder JJ, Varga S, Kraenzlin M, De Geyter C, Keller U, Müller B. Central fat excess in polycystic ovary syndrome: relation to low-grade inflammation and insulin resistance. J Clin Endocrinol Metab. 2005;90:6014–6021. [DOI] [PubMed] [Google Scholar]
- (25).Lee Y-H, Hsiao H-F, Yang H-T, Huang S-Y, & Chan WP Reproducibility and Repeatability of Computer Tomography-based Measurement of Abdominal Subcutaneous and Visceral Adipose Tissues. Scientific Reports, 2017;7(1). [DOI] [PMC free article] [PubMed] [Google Scholar]
- (26).West J, Romu T, Thorell S, et al. Precision of MRI-based body composition measurements of postmenopausal women. PloS One, 2018;13(2), e0192495. doi: 10.1371/journal.pone.0192495 [DOI] [PMC free article] [PubMed] [Google Scholar]
- (27).Aldo Scafoglieri, ed. Whole Body Composition by Hologic QDR 4500/A DXA: System Reliability versus User Accuracy and Precision in: Applications and Experiences of Quality Control. Intechopen, London, 2011. [Google Scholar]
- (28).Kastl S, Sommer T, Klein P, Hohenberger W, & Engelke K Accuracy and precision of bone mineral density and bone mineral content in excised rat humeri using fan beam dual-energy X-ray absorptiometry. Bone, 2002; 30(1), 243–246. [DOI] [PubMed] [Google Scholar]
- (29).Guo Y, Franks PW, Brookshire T, & Tataranni PA The Intra- and Inter-instrument Reliability of DXA Based on Ex Vivo Soft Tissue Measurements. Obesity Research, 2004;12(12), 1925–1929. [DOI] [PubMed] [Google Scholar]
- (30).Shepherd JA, Fan B, Lu Y, Lewiecki EM, Miller P, & Genant HK Comparison of BMD precision for Prodigy and Delphi spine and femur scans. Osteoporosis International, 2006;17(9), 1303–1308. [DOI] [PubMed] [Google Scholar]


