Abstract
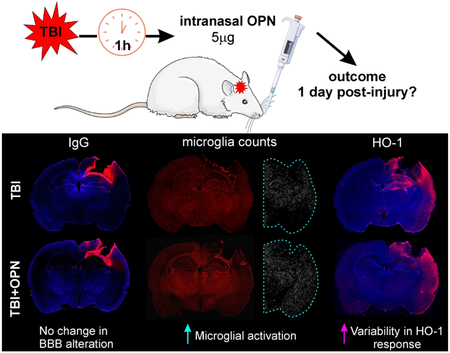
Intranasal recombinant osteopontin (OPN) has been shown to be neuroprotective in different models of acquired brain injury but has never been tested after traumatic brain injury (TBI). We used a model of moderate-to-severe controlled cortical impact in male adult Sprague-Dawley rats and tested our hypothesis that OPN treatment would improve neurological outcomes, lesion and brain tissue characteristics, neuroinflammation, and vascular characteristics at one day post-injury. Intranasal OPN administered one hour after the TBI did not improve neurological score, lesion volumes, blood-brain barrier or vascular characteristics. When assessing neuroinflammation, we did not observe any effect of OPN on the astrocyte reactivity but discovered an increased number of activated microglia within the ipsilateral hemisphere. Moreover, we found a correlation between edema and heme oxygenase-1 (HO-1) expression which was decreased in OPN-treated animals, suggesting an effect of OPN on the HO-1 response to injury. Thus, OPN may increase or accelerate the microglial response after TBI, and early response of HO-1 in modulating edema formation may limit the secondary consequences of TBI at later time points. Additional experiments and at longer time points are needed to determine if intranasal OPN could potentially be used as a treatment after TBI where it might be beneficial by activating protective signaling pathways.
Keywords: Heme-oxygenase-1, edema, microglial activation, T2 mapping, extracellular matrix protein, controlled cortical impact
Graphical Abstract
This study showed that following traumatic brain injury (TBI) in male rats, intranasal osteopontin (OPN) treatment induced no change in lesion size and blood-brain barrier (BBB) disruption 1 day post-injury. However we described an increased number of activated microglia and increased variability in the heme-oxygenase-1 response to the injury.
Introduction
Traumatic brain injury (TBI) is a critical health problem and a leading cause of death throughout the world (Faul, Xu, Wald, & Coronado, 2010; Peeters et al., 2015). TBI is defined as an alteration of brain function and/or evidence of brain pathology, caused by an external force (Menon et al., 2010). At the present time, there are no treatments available for TBI. In human patients and in animal models of TBI, numerous reports have demonstrated that brain injury elicits a broad range of sequelae including neuroinflammation, vascular alterations and long-term modifications in psychological and behavioral outcomes (Bramlett & Dietrich, 2015; Jullienne et al., 2016; Obenaus, 2015).
Osteopontin (OPN) is a glycoprotein synthesized in a variety of tissues such as the heart, bone, kidney, smooth muscle, placenta and brain. It exists in two different forms: immobilized as an extracellular matrix protein, and as a cytokine in body fluids (Denhardt, Noda, O'Regan, Pavlin, & Berman, 2001). OPN is implicated in multiple functions, including bone remodeling (Jono, Peinado, & Giachelli, 2000), tumor cell metastasis (Wai & Kuo, 2004), and immune function (O'Regan & Berman, 2000). In the central nervous system, OPN has been shown to have proinflammatory roles in a rat model of experimental autoimmune encephalomyelitis (Kim, Cho, & Shin, 2004), in neurodegeneration in Alzheimer’s disease (Wung et al., 2007) and in Parkinson’s disease (Maetzler et al., 2007), but has also been shown to have neuroprotective roles in a rat model focal cerebral ischemia (Yan, Lang, Vemuganti, & Dempsey, 2009). See (Shin, 2012) for a review.
OPN treatment has had inconsistent results in a variety of brain injury models due to its pleiotropic function. OPN has neuroprotective effects in intracerebral hemorrhage at one to three days post injury (Gong et al., 2018; W. Zhang et al., 2018), in subarachnoid hemorrhage at one to three days post injury (Topkoru et al., 2013; Wu et al., 2016), and in focal cerebral ischemia at one day post injury (Doyle et al., 2008). In contrast, OPN has no or even deleterious effects in a model of neonatal hypoxia-ischemia injury seven days post injury (Albertsson et al., 2014). To our knowledge, OPN treatment has not been tested in a model of TBI.
The goal of the present study was to evaluate the effectiveness of intranasal administration of OPN in ameliorating outcomes one day after a moderate-to-severe TBI. Since we previously showed a neuroprotective effect of OPN in a model of intracerebral and subarachnoid hemorrhage at 1 day, we undertook experiments to evaluate OPN treatment at the same dose and time point in a model of TBI. This approach would allow future comparisons between all three acquired brain injury models as to the effectiveness of OPN as a potential treatment avenue. We used male Sprague-Dawley rats in a controlled cortical impact (CCI) model and assessed neurological score, lesion volume, tissue characteristics, BBB alteration, neuroinflammation, and vessel characteristics. At this early time point after injury, we describe a relationship between HO-1 expression and edema, and we report that OPN increased the number of activated microglia without overtly minimizing the acute effects of TBI.
Material and methods
Animals
All animal experiments and care complied with federal regulations and were approved by the Loma Linda University Animal Health and Safety Committee. Twenty male Sprague-Dawley rats weighing 275 to 375 g (9 to 12 weeks old) were housed in a temperature controlled animal facility on a 12-hour light-dark cycle, with free access to food and water. Rats were housed by pairs in a regular rat cage (11 dm2 floor area) on standard cob bedding with environmental enrichment. This initial study used male rats, as estrogen hormones are known to enhance behavioral recovery and neurogenesis after ischemic stroke (Li et al., 2011; Tanapat, Hastings, Reeves, & Gould, 1999). Animals were randomly assigned to four groups: Sham, TBI, Sham + osteopontin, TBI + osteopontin, with 5 rats per group. No mortality was observed, all animals were euthanized at one day post-injury (dpi).
Controlled cortical impact
The CCI procedure was performed as previously described (Obenaus et al., 2017). Briefly, rats were anesthetized with isoflurane (3 % induction, 1-2 % maintenance) and placed in a stereotactic frame (Stoelting Co., Wood Dale, IL) to secure the head. A midline incision of the skin was made to expose the skull. A 5 mm craniotomy was performed over the right hemisphere, at 3 mm posterior and 3 mm lateral from Bregma. A moderate-to-severe TBI was delivered to the cortex using an electromagnetically driven piston (3 mm diameter tip, 2.5 mm depth, 5.0 m/s, speed, 200 ms dwell; Leica Microsystems Company, Richmond, IL). The skin was sutured and buprenorphine (0.01 mg/kg, intramuscular) was administered after surgery for pain management. Sham animals underwent the entire procedure except for the impact. All rats survived the surgery.
Osteopontin administration
Intranasal administration of recombinant osteopontin (rOPN, Cat# 441-OP, R&D System, Minneapolis, MN; 5 μg dissolved in 25 μL of sterile 0.9 % NaCl solution) was performed one hour after surgery. The dose and time of OPN administration were chosen based on previous studies by our group (Topkoru et al., 2013; Wu et al., 2016; Gong et al., 2018). Under light isoflurane anesthesia (2 %), rats were placed in a supine position and the rOPN solution was administered alternately into the right and left nares, 5 μL every 2 min by using a 10 μL pipet. In a previous study using intranasal administration of OPN, an increased concentration of OPN was detected in the cerebrospinal fluid of rats from 4 to 24 hours post-treatment (Topkoru et al., 2013), validating the efficacy of the OPN administration.
Behavior testing
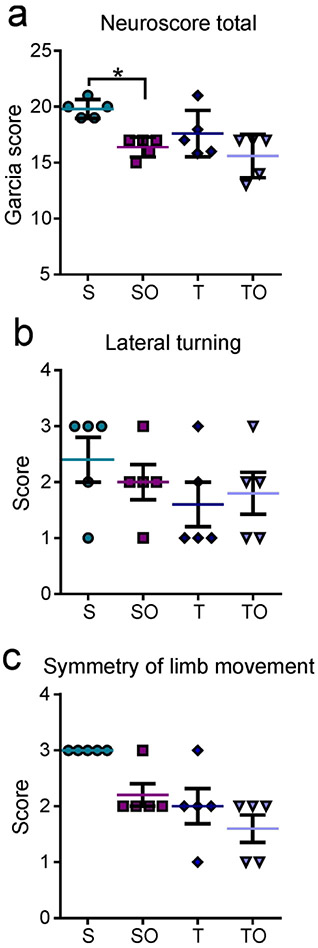
A modified version of the Garcia test battery was used to assess neurological function (Garcia, Wagner, Liu, & Hu, 1995). Rats were tested one day after surgery and given scores for seven individual tests (spontaneous activity, axial sensation, vibrissae proprioception, symmetry of limb movement, lateral turning, forelimb outstretching, climbing), each scored from 1 (worst) to 3 (best; Table 1). The score from each of the seven tests was summed so that a score of 21 represented a complete lack of deficits. Only the symmetry of limb movement and lateral turning tests differed between sham rats and TBI rats (with TBI rats performing worse than the sham), so these tests were analyzed separately.
Table 1: Modified Garcia neurological test.
Table explaining the scoring system for the modified Garcia neurological test.
| Test | Score: 3 | Score: 2 | Score: 1 | Deficits? |
|---|---|---|---|---|
| Symmetry of limb movement (suspended by tail) | All limbs extended symmetrically | Limbs on one side were outstretched less than the other | Unable to hang | Yes |
| Lateral turning | Responded to stimulus on both sides | Responded to stimulus on one side only | Did not respond to stimulus on either side | Yes |
| Climbing (45° angle on gripping surface) | Climbed to the top easily with a firm grip | Asymmetric or paired climbing or slipped | Failed to climb or fell off apparatus | No |
| Spontaneous activity during 5 min in typical cage | Moved around, explored environment and reached the upper rim ≥3 sides of cage | Moved hesitatingly around, explored, and reached the upper rim < 3 sides of cage | Severely affected rat did not rise-up at all, and barely moved in the cage | No |
| Forelimb outstretching (suspended by tail, forepaws to table) | Both forelimbs outstretched, walking symmetrically on forepaws | Impaired forepaw walking with asymmetric outstretch | Limbs on one side showed minimal movement | No |
| Axial sensation (mild stimulus to the trunk from behind) | Equally startled to the stimulus on both sides of trunk | Reacted more slowly on one side compared to other | Did not respond to stimulus on one side | No |
| Vibrissae proprioception (gentle touch from behind) | Equally turned head to cotton-wisp on both sides | Reacted to one side only | Did not respond to stimulus on either side | No |
Perfusion
After final neurological testing, rats were euthanized via transcardial perfusion. Briefly, rats were anesthetized with an intraperitoneal injection of ketamine (90 mg/kg) and xylazine (10 mg/kg) and then perfused with 1X phosphate buffered saline (PBS, 150 mL) and 4 % paraformaldehyde (PFA, 1 mL/g of body weight) using a peristaltic pump (10 mL/min). Brains were then extracted, post-fixed in 4 % PFA for 24 h, washed, and stored in PBS at 4°C until imaging.
Magnetic resonance imaging (MRI) acquisition and analysis
High resolution MRI was undertaken using an 11.7T Bruker Avance instrument (Bruker Biospin, Billerica, MA, USA) running with the Paravision software (version 5.1, Bruker Biospin) to assess brain injury volumes. T2-weighted images (T2WI; repetition time [TR]/echo time [TE]: 2395 ms/10 ms, 20 × 1 mm slices) were acquired and collected on a 256 × 256 matrix with a 2 cm field of view to quantitate edema and extravascular blood.
Quantitative lesion analysis
TBI lesion volumes were evaluated by personnel blinded to the groups. The total lesion volumes (comprising edema and hemorrhage) were determined using the Cheshire image processing software (version 4.3, Parexel, Waltham, MA). Regions of interest (ROIs) were drawn on T2 maps after confirming presence of edema and hemorrhage with T2 relaxation times (>70 msec and 35-45 msec, respectively). Hemorrhage volumes were identified by using the Hierarchical Regional Splitting (HRS) computational method (U.S. patent: 8731261; European patent: 11748009.5-1265, RRID: SCR_016398), based on T2 relaxation times (Ghosh et al., 2011; Ghosh, Sun, Bhanu, Ashwal, & Obenaus, 2014), in which a T2 value of <45 msec was considered hemorrhage. Edema volumes were determined by subtracting hemorrhage volumes from total lesion volumes.
Whole brain T2 mapping
Quantitative T2 maps using all 10 echos were generated using JIM software (RRID: SCR_009589, Xinapse Systems Ltd; West Bergholt, Essex; United Kingdom). The second echo of the T2WI underwent N4 bias field correction (Tustison et al., 2010), which was used for subsequent registration steps. ITK-SNAP’s active contour segmentation (Yushkevich et al., 2006) was used to segment a lesion mask and then subsequently used as an exclusion region in ANTs (Advanced Normalization Tools) deformable b-spline symmetric normalization registration (Tustison & Avants, 2013). The Waxholm MRI atlas (Papp, Leergaard, Calabrese, Johnson, & Bjaalie, 2014) was registered to each individual’s T2WI, and the Waxholm label atlas (separated by hemisphere) was transformed to this resulting image using ANTs (Avants et al., 2011). Native-space T2 values were then extracted using the transformed Waxholm anatomical labels and summarized using GraphPad Prism 7 software (GraphPad Prism, RRID: SCR_002798, San Diego, CA). Some brain regions were excluded from the analysis due to misregistration (see supplemental table 1).
Brain sectioning and immunohistochemistry
After MR imaging, brains were cryoprotected in 30 % sucrose prior to freezing in Tissue-Tek O.C.T. Compound (Sakura Finetek, Torrance, CA). Brains were coronally cryosectioned at a 40 μm thickness, and the slices were stored in cryoprotectant solution at 4°C until immunohistochemistry.
For immunostaining, free-floating tissue sections were first washed in PBS+0.04 % TritonX (wash buffer) for 3×10 min. They were then blocked with a PBS + 2% bovine serum albumin (BSA; Sigma Aldrich, St. Louis, MO) solution for 1.5 h. Primary antibodies used are as follows: anti-heme oxygenase 1 (HO-1) 1:200, Enzo Life Sciences Cat# ADI-SPA-895 RRID: AB_10618757, Farmingdale, NY), anti-glial fibrillary acidic protein (GFAP; 1:1000, Millipore Cat# MAB3402 RRID: AB_94844, Billerica, MA), anti-rabbit ionized calcium-binding adapter molecule 1 (Iba1, 1:400, Wako Cat# 019-19741 RRID: AB_839504, Richmond, VA) and anti-rat immunoglobulin G (IgG; 1:1000, Rockland Cat# 112-4102 RRID: AB_220030, Gilbertsville, PA). DyLight 594-labeled tomato-lectin (T-lectin; 1:200, Vector Laboratories Cat# DL-1177, RRID: AB_2336416, Burlingame, CA) was used to label the blood vessels. Primary antibodies or markers were incubated in antibody solution (0.5 % BSA +0.5 % Triton X in PBS) overnight. Appropriate secondary antibodies (goat anti-mouse Alexa Fluor 488 and goat anti-rabbit Alexa Fluor 594, 1:1000, Thermofisher, Eugene, OR) were incubated in antibody solution for 1.5 h and washed 3×10 min in wash buffer. Tissue sections were mounted on slides and coverslipped with Vectashield mounting medium containing DAPI (Vector Laboratories Cat# H-1200 RRID: AB_2336790, Burlingame, CA) for nuclear counterstaining. See table 2 for more details about the antibodies.
Table 2: Antibody reporting.
| Antibody name | Immunogen structure |
Origin | Type | Dilution |
|---|---|---|---|---|
| Mouse anti-GFAP | Purified glial filament | Millipore Cat# MAB3402 RRID: AB_94844 | Primary, monoclonal | 1:1000 |
| Rabbit anti-HO-1 | Recombinant rat HO-1 lacking the membrane spanning region | Enzo Life Sciences Cat# ADI-SPA-895 RRID: AB_10618757 | Primary, polyclonal | 1:200 |
| Rabbit anti-Iba1 | Synthetic peptide corresponding to C-terminus of Iba1 | Wako Cat# 019-19741 RRID:AB_839504 | Primary, polyclonal | 1:400 |
| Rabbit anti-rat IgG | Rat IgG whole molecule | Rockland Cat# 112-4102 RRID: AB_220030 | Primary, polyclonal | 1:1000 |
| Goat anti-mouse, Alexa Fluor 488 conjugated | Gamma Immunoglobins heavy and light chains | Thermofisher Cat# A-11029, RRID: AB_2534088 | Secondary, polyclonal | 1:1000 |
| Goat anti-rabbit, Alexa Fluor 594 conjugated | Gamma Immunoglobins heavy and light chains | Thermofisher Cat# A-11012, RRID: AB_2534079 | Secondary, polyclonal | 1:1000 |
Image acquisition and analysis
Immunostained brain slices (between Bregma −2.5 and −3.6 mm) were imaged using a fluorescence microscope (Keyence BZ-X700; Keyence Corp., Osaka, Japan). Whole coronal images were captured by a blinded experimenter at 2X magnification. All image analysis was performed by a blinded experimenter using Fiji software (Fiji, RRID: SCR_002285). For IgG and GFAP quantification6, integrated density measures were performed on the top right quarter of the brain (containing the lesion site, see dotted line in Figure 5a and 6a). For HO-1 quantification, integrated density measurements were performed on the whole ipsilateral hemisphere, because we noted that HO-1 staining extended to the entorhinal cortex (see dotted line in Figure 8a). Areas of IgG and HO-1 staining were also measured using Fiji and normalized to the whole brain area for each section. For Iba1 quantification, activated microglia were counted by using the “analyze particles” function in Fiji. Briefly, Iba1 images were converted to binary, an ROI was drawn around the ipsilateral hemisphere, and 75-150 μm2 “particles” were counted as activated microglia. To analyze vessel characteristics, ROIs were drawn around the ipsilateral and contralateral cortices (see dotted line in Figure 9a) on T-lectin stained tissue sections, and the resulting images were analyzed for vessel density, junction density, and vessel length using Angiotool software (AngioTool, RRID: SCR_016393; (Zudaire, Gambardella, Kurcz, & Vermeren, 2011).
Statistical analysis
All statistical analyses were performed using GraphPad Prism 6 software (GraphPad Prism, RRID: SCR_002798, San Diego, CA). For lesion volumes, immunohistochemistry and vessel analysis, Kruskal-Wallis and post hoc Dunn’s tests were performed when data did not pass the normality test. One-way ANOVA and post hoc Holm-Sidak tests were performed when data passed the normality test. For the post hoc multiple comparison tests, we only compared S vs T, SO vs TO, S vs SO and T vs TO. Correlation data were analyzed by linear regression in GraphPad. For the T2 mapping analysis, MANOVA testing of all selected regions was conducted in RStudio (RRID: SCR_000432), and a one-way ANOVA analysis was subsequently performed using GraphPad. Graphs are presented as box and whiskers plots or dot plots with statistical significance noted as *P<0.05, **P<0.01, ***P<0.001, or **** P<0.0001. In the results, data are presented as mean ± SD. We opted to use a post hoc power analysis (using G*Power, RRID: SCR_013726) to determine the absolute effect size for the behavioral assessments using Garcia neurological scores. The results show that the effect size for this experiment was f=1.099 (with α=0.05, power=0.966), implying that when P>0.05, the effect size is smaller than f=1.099.
Results
OPN did not change neurological performance after TBI
Interestingly, the neurological battery tests revealed that OPN-treated sham animals performed worse than the non-treated sham animals (sham vs. sham + OPN: 19.8 ± 0.84 vs. 16.4 ± 0.89, *P=0.0371; Figure 1a). However, there was no significant difference between TBI and TBI + OPN (17.6 ± 2.07 vs. 15.6 ± 1.95, P>0.05).
Figure 1.
(a) Neurological outcome assessed one day after injury by a modified Garcia test battery showed that sham + OPN (SO), TBI (T) and TBI + OPN (TO) rats performed worse than the sham (S) group. The lateral turning test (b) and the symmetry of limb movement test (c) were the only tests that distinguished between sham and TBI animals. In both tests, sham rats performed better than all other groups.
Statistics: *=P<0.05, **=P<0.01; Garcia score: Kruskal-Wallis test χ2 (3)=10.08, n=5 per group, *P=0.0179; Symmetric limb movement: Kruskal-Wallis test χ2 (3)=11.36, n=5 per group, **P=0.0099; Lateral turning: Kruskal-Wallis test χ2 (3)=2.557, n=20, P=0.4651.
Of the 7 tests in the neurological battery, lateral turning and symmetry of limb movement were the only tests that showed TBI rats performing worse, on average, compared to sham only rats, but not significantly. Analyses of these two tests separately also showed that TBI, TBI + OPN, and sham + OPN groups seemed to perform worse than the sham group (Figures 1b and 1c) but there was no significant differences between groups.
Lesion volume was not affected by OPN
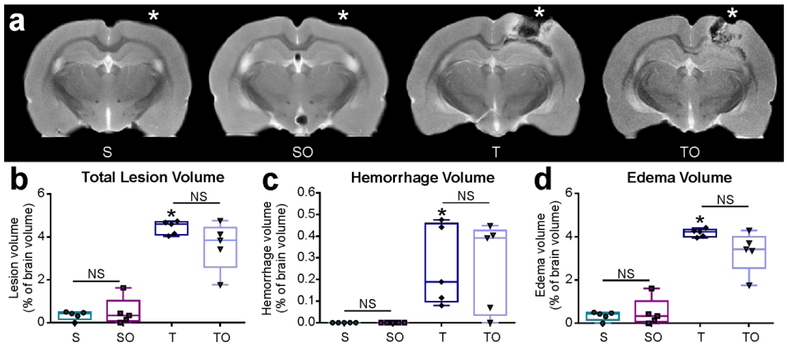
Total lesion volume, including edema and hemorrhage, was assessed using T2WI MRI. Total brain volume did not significantly differ among the groups (data not shown). As shown in Figure 2a, both edema and hemorrhage were present at the lesion site 1 dpi (* impact site, Bregma ~ −3.5mm). Although small lesions were detected in the sham rats, they consisted entirely of edema (likely due to the craniotomy). No hemorrhage was detected in sham animals. Total lesion volumes (edema + hemorrhage) did not differ significantly between sham and sham + OPN animals (0.35 ± 0.21 % and 0.50 ± 0.64 % of brain volume, P>0.05), nor between TBI and TBI + OPN rats (4.44 ± 0.32 % and 3.56 ± 1.12 % of brain volume, P>0.05; Figure 2b). TBI and TBI + OPN rats did not differ significantly in hemorrhage volumes (0.26 ± 0.19 % and 0.26 ± 0.21 % of brain volume, P>0.05; Figure 2c) nor edema volumes (4.18 ± 0.18 % and 3.30 ± 0.94 % of brain volume, P>0.05; Figure 2d).
Figure 2.
(a) T2-weighted images representing lesion location (Bregma: −3.5 mm, * represents the craniotomy or impact site). One day after injury, TBI (T) and TBI + OPN (TO) tissue exhibited edema and hemorrhage visible around lesion site, in contrast to little to no change in sham (S) and sham + OPN (SO) tissue, (b) Lesion volume was assessed by measuring edema + hemorrhage volumes. Both T and TO rats demonstrated increased lesion volumes compared to S and SO rats, however OPN treatment induced no difference, (c) Hemorrhage was absent in both sham groups, present in the injured rats, and not significantly altered by OPN treatment. (d) Edema was negligible in the sham groups, but highly increased in the injured rats, with no significant difference due to the OPN treatment.
Statistics: *=significant vs. S; Total lesion volume: Kruskal-Wallis test χ2 (3)=13.52, n=18, ****P<0.0001; Hemorrhage volume: Kruskal-Wallis test χ2 (3)=14.21, n=5 per group, **P=0.0026; Edema volume: Kruskal-Wallis test χ2 (3)=15.13, n=5 per group, **P=0.0017.
Tissue characteristics
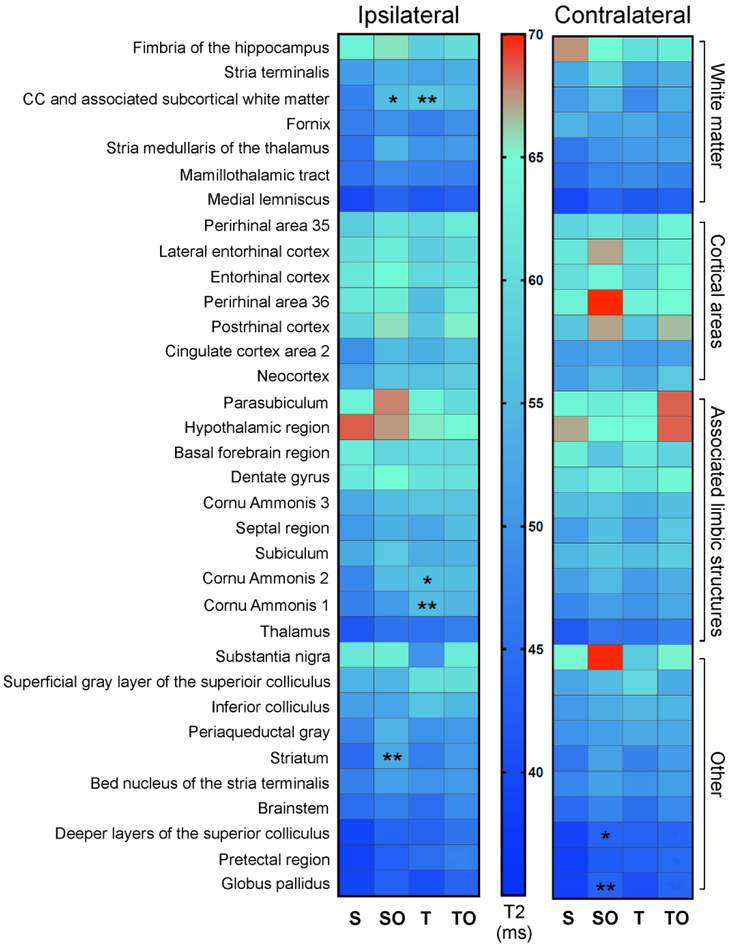
Although lesion characteristics were not modified by OPN at 1 dpi, we wished to determine whether other brain regions might be protected by OPN. Quantitative T2 values were examined across the entire brain using an automated approach using the Sprague Dawley rat Waxholm MRI atlas (Papp et al., 2014). As revealed by the heat map in Figure 3, TBI and OPN treatment resulted in modified T2 values in groups of tissue types (e.g., white matter, cortex, limbic structures, etc).
Figure 3:
Heat map representing T2 values in brain regions compartmentalized by region type (white matter, cortical areas, associated limbic structures, other) in the ipsilateral and contralateral hemispheres, revealing OPN- and TBI-induced modification of T2 values in groups of tissue type. *=significantly different compared with sham group, *P<0.05, **P<0.01.
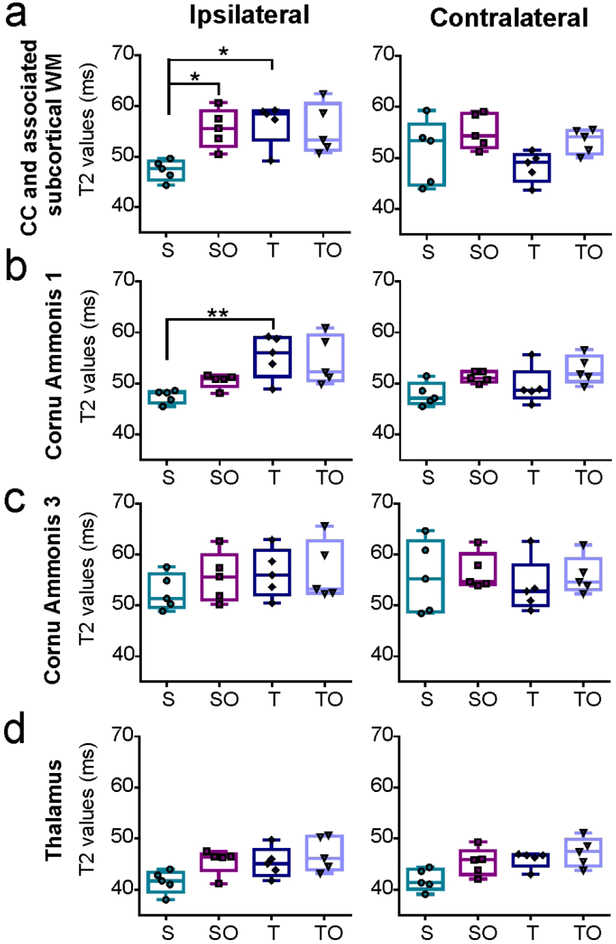
A closer examination of the corpus callosum (CC) and associated white matter revealed that OPN treatment significantly increased T2 values in the ipsilateral side of sham animals (47.32 ± 2.5 ms vs. 55.55 ± 3.85 ms, *P=0.048; Figure 4a). Moreover, TBI significantly increased T2 values on the injured side of the CC and associated white matter when compared to sham (56.62 ± 4.21 ms vs. 47.32 ± 2.05 ms, *P=0.033; Figure 4a). Similarly, TBI significantly increased T2 values within the injured side’s hippocampal CA1 field (sham=47.49 ± 1.30 ms, TBI=55.36 ± 4.21, *P=0.014; Figure 4b). Interestingly, in contrast to the CA1 region, the CA3 region of the hippocampus had no overt T2 changes (Figure 4c), nor had the thalamus (Figure 4d). In general, TBI + OPN treatment did not significantly modify T2 values relative to TBI only.
Figure 4:
T2 values in each group for different brain regions: Corpus callosum and associated subcortical white matter (a), CA1 (b), CA 3 (c), and thalamus (d) in ipsilateral and contralateral hemispheres. S=sham, SO=sham + OPN, T=TBI, TO=TBI + OPN.
Statistics: *=P<0.05; T2 values ipsilateral CC and associated subcortical WM: Kruskal-Wallis test χ2 (3)=10.25, n=5 per group, *P=0.0166; T2 values contralateral CC and associated subcortical WM: Kruskal-Wallis test χ2 (3)=6.634, n=5 per group, P=0.0845; T2 values ipsilateral CA1: Kruskal-Wallis test χ2 (3)=11.89, n=5 per group, **P=0.0078; T2 values contralateral CA1: Kruskal-Wallis test χ2 (3)=8.12, n=5 per group, *P=0.0436; T2 values ipsilateral CA3: Kruskal-Wallis test χ2 (3)=2.68, n=5 per group, P=0.4436; T2 values contralateral CA3: Kruskal-Wallis test χ2 (3)=1.994, n=5 per group, P=0.5736; T2 values ipsilateral thalamus: Kruskal-Wallis test χ2 (3)=7.777, n=5 per group, P=0.0508; T2 values contralateral thalamus: Kruskal-Wallis test χ2 (3)=8.486, n=5 per group, P=0.037.
OPN did not ameliorate BBB disruption
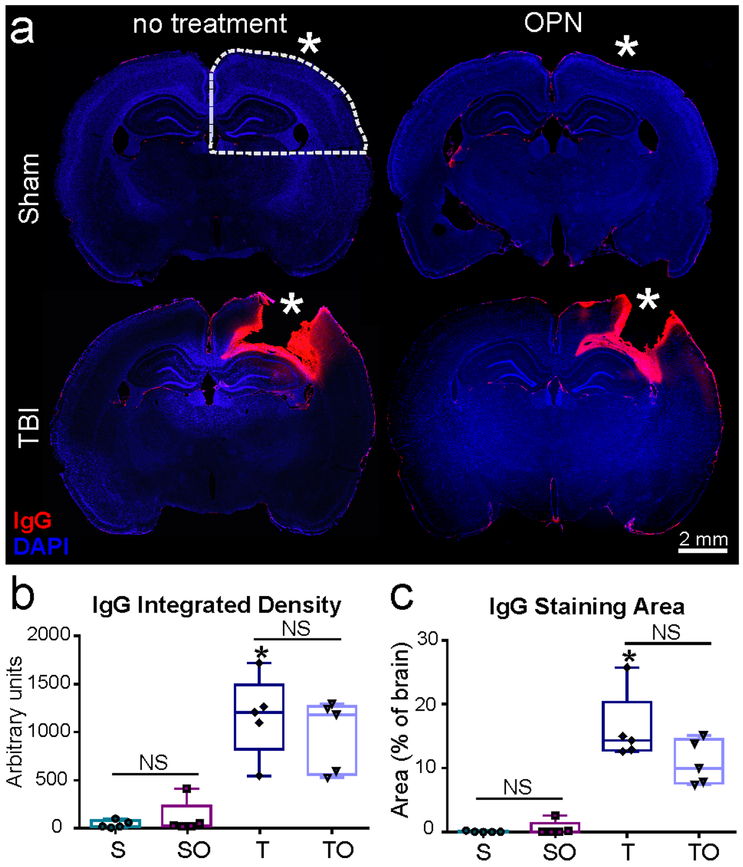
IgG extravasation was analyzed to assess alterations in BBB permeability in the four experimental groups. No IgG staining was visible in the brains of sham or sham + OPN rats (Figure 5a), suggesting an intact BBB. In contrast, IgG staining was present at the lesion site (*) in both TBI groups (Figure 5a), suggesting BBB disruption. TBI and TBI + OPN brains did not differ with regard to IgG staining density (1162 ± 418.4 vs. 968.1 ± 375.3 AU, P>0.05; Figure 5b) nor stained area (16.11 ± 5.483 vs. 10.83 ± 3.502 % of slice area, P>0.05; Figure 5c).
Figure 5.
(a) Representative images of immunoglobulin G (IgG) staining demonstrating extravasation at the injury site on TBI animals, but absent in shams, (b) Integrated density was measured in ipsilateral hemisphere quadrant (see dotted line in a) and verifies a significant difference between TBI and Sham, but no effect of OPN treatment, (c) Staining area also showed significant increase in IgG between injured animals (T, TO) and shams (S, SO) but no effect of OPN (* craniotomy or lesion site, scale bar 2mm).
Statistics: *=significant vs. S, P<0.05; IgG integrated density: Kruskal-Wallis test χ2 (3)=14.59, n=5 per group, **P=0.0022; IgG staining area: Kruskal-Wallis test χ2 (3)=14.79, n=5 per group, **P=0.0020.
OPN and inflammatory markers
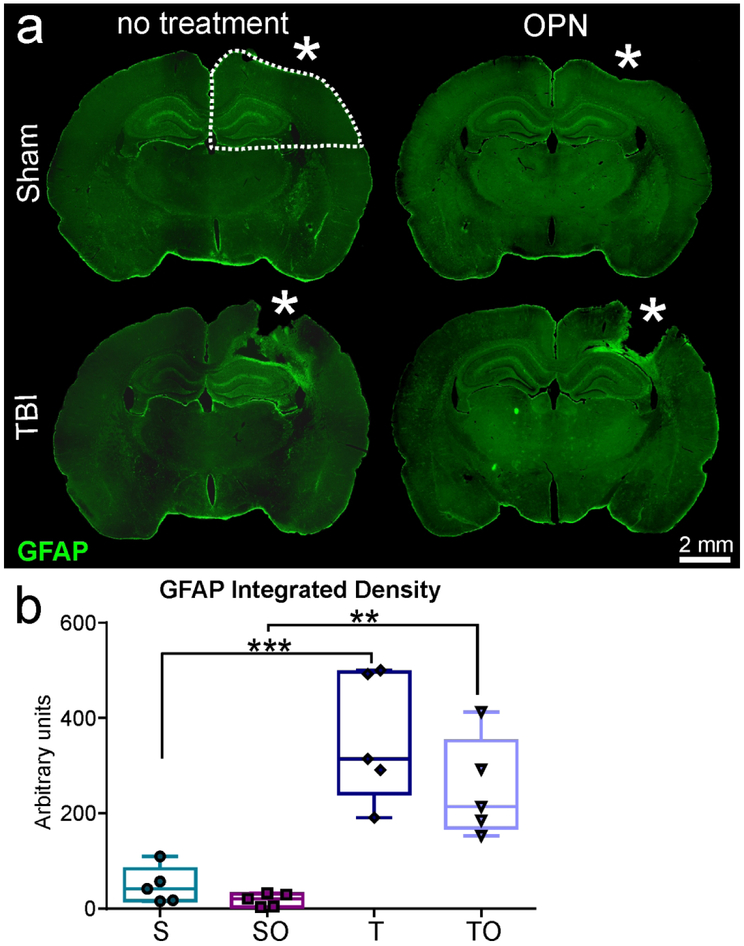
The effect of OPN on inflammatory responses was assessed by analyzing astrocytes, microglia, and heme oxygenase-1 induction using immunohistochemistry (GFAP, Iba1, and HO-1, respectively). GFAP staining in the ipsilateral quarter (see dotted line in Figure 6a) revealed reactive astrocytes in TBI, but not in sham rats (Figure 6a). GFAP was increased in tissues adjacent to the lesion site (*) including structures under the impact zone (i.e., hippocampus and CC). Gliosis was significantly increased in TBI animals relative to shams (Figure 6b), where OPN treatment resulted in no significant change in GFAP density (358 ± 134.7 vs 251.4 ± 104 AU, P>0.05, Figure 6b).
Figure 6.
(a) Representative images of glial fibrillary acidic protein (GFAP) staining showing astrocytic reactivity at the lesion site for TBI animals but absent in Sham, (b) Integrated density measurements demonstrating significant astrogliosis in injured rats compared to shams, but no significant difference between TBI (T) and TBI + OPN (TO). Region of analysis on ipsilateral hemisphere is delineated by the dotted white line in a (* craniotomy or lesion site, scale bar 2mm).
Statistics: **=P<0.01, ***=P<0.001; GFAP integrated density: One-way ANOVA F3,16=17.37, n=5 per group, ****P<0.0001.
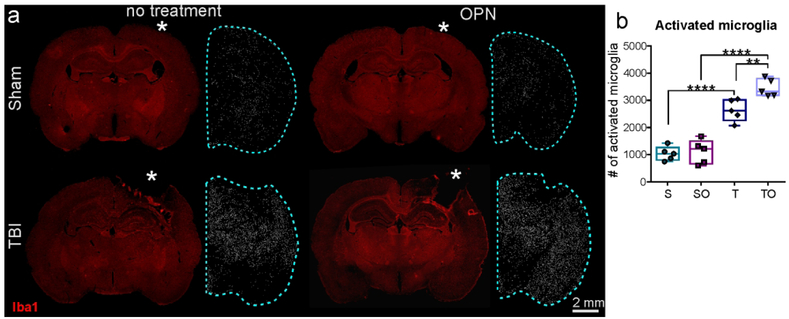
Activated microglia (larger size than resting microglia) were counted within the ipsilateral hemisphere to incorporate the more global response of microglia. Results showed a large increase between sham and TBI groups. No significant differences due to OPN treatment were observed in shams (sham vs sham + OPN: 1038 ± 260.7 vs 1109 ± 444.1, P>0.05). However, OPN induced a significant increase in activated microglia in the injured rats (TBI vs. TBI + OPN: 2838 ± 402.1 vs. 3461 ± 322.8, **P=0.0051; Figure 7b).
Figure 7.
(a) Representative images of Iba1 staining and activated microglia counts showing a large microglial activation in injured animals (T, TO) compared to sham animals (S, SO) (* craniotomy or lesion site, scale bar 2mm). (b) Activated microglia counts in ipsilateral hemisphere (see blue dotted line in a) showed that OPN treatment in TBI rats generated a significant increase in microglia activation.
Statistics: ****=P<0.0001, **=P<0.01. Activated microglia count: One-way ANOVA F3,16=53.30, n=5 per group, ****P<0.0001.
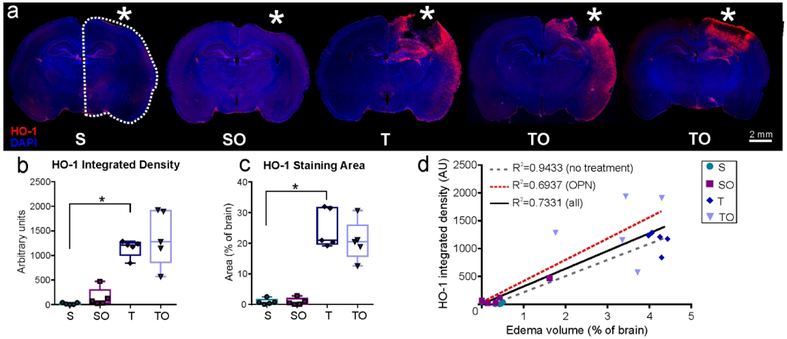
HO-1 expression was analyzed on the ipsilateral hemisphere (dotted line in Figure 8a). Sham animals showed negligible HO-1 staining on the cortical surface at the craniotomy site, whereas TBI animals exhibited an increased expression that extended to the entorhinal cortex (Figure 8a). No significant differences in staining density were found between TBI and TBI + OPN (1150 ± 176.2 vs. 1366 ± 567.9 AU, P>0.05) nor between sham and sham + OPN (19.35 ± 19.43 vs. 143.3 ± 187.9 AU, P>0.05; Figure 8b). Similarly, no differences were found in HO-1 staining area between sham and sham + OPN (0.867 ± 0.949 vs. 0.903 ± 1.136 AU, P>0.05), or between TBI and TBI + OPN (24.74 ± 6.34 vs. 20.73 ± 6.51 % of brain area, P>0.05: Figure 8c). However, there was an increased variability in the TBI + OPN group compared with the TBI group alone which prompted us to investigate the relationship between HO-1 expression and lesion volumes. We found a strong correlation between the lesion volume and HO-1 levels (integrated density and staining area), as noted in Table 3. The strength of the correlation appears to be driven by lesional edema, as the R2 values were considerably lower when we examined hemorrhage volumes. Moreover, the correlation was reduced in animals treated with OPN (HO-1 integrated density and edema: R2=0.94 for OPN-treated animals vs. R2=0.69 for the no-treatment groups; Figure 8d and Table 3). Interestingly, the same trend was present for the number of activated microglia which positively correlated with the edema volume, whereas, the correlation was weaker in the OPN-treated rats compared to the non-treated ones (R2=0.66 for all groups, R2=0.87 for non-treated rats, R2=0.74 for OPN-treated rats). The same trend was also present for IgG: the correlation with edema was weaker in the OPN-treated groups compared to the non-treated groups (R2=0.76 for all groups, R2=0.78 for non-treated rats, R2=0.72 for OPN-treated rats). However, GFAP integrated density correlations with edema did not follow the same trend: the correlation is weaker in the non-treated rats (R2=0.77) compared to the OPN-treated ones (R2=0.81).
Figure 8.
(a) Representative images of Heme Oxygenase-1 (HO-1) and DAPI staining for the four study groups. The TBI + OPN (TO) group demonstrated more HO-1 variability as indicated by the two images (* craniotomy or lesion site, scale bar 2mm). (b) HO-1 integrated density measured in the ipsilateral hemisphere indicated HO-1 induction in injured rats (T, TO) but no clear effect of OPN. (c) HO-1 staining area measurements also showed HO-1 induction in the TBI (T, TO) groups, but no significance due to OPN treatment, (d) Graph showing correlations between HO-1 integrated density and edema volumes. OPN-treated rats presented a weaker correlation between HO-1 and edema volumes compared to non-treated rats.
Statistics: *=P<0.05; HO-1 integrated density: Kruskal-Wallis test χ2 (3)=15.18, n=5 per group, **P=0.0017; HO-1 staining area: Kruskal-Wallis test χ2 (3)=14.52, n=5 per group, **P=0.0023.
Table 3: R2 values for correlations between HO-1 expression and lesion volumes.
Table showing the different R2 values obtained for the correlation tests between the different lesion volume components (total, edema, and hemorrhage) and the HO-1 expression (integrated density and staining area). The P value of the linear regression associated with each correlation is noted under the R2 value.
| All groups | NON-treated animals | OPN-treated animals | ||||
|---|---|---|---|---|---|---|
| Integrated density |
Staining area |
Integrated density |
Staining area |
Integrated density |
Staining area |
|
| Total lesion volume | R2=0.7295 P<0.0001 |
R2=0.8537 P<0.0001 |
R2=0.9238 P<0.0001 |
R2=0.8726 P<0.0001 |
R2=0.6912 P=0.0029 |
R2=0.8253 P=0.0003 |
| Edema | R2=0.7331 P<0.0001 |
R2=0.8533 P<0.0001 |
R2=0.9433 P<0.0001 |
R2=0.8751 P<0.0001 |
R2=0.6937 P=0.0028 |
R2=0.8211 P=0.0003 |
| Hemorrhage | R2=0.4459 P=0.0013 |
R2=0.5583 P=0.0002 |
R2=0.4065 P=0.0464 |
R2=0.5081 P=0.0207 |
R2=0.4941 P=0.0233 |
R2=0.6419 P=0.0055 |
P<0.0001
P<0.001
P<0.01
P<0.05
OPN did not affect vascular characteristics
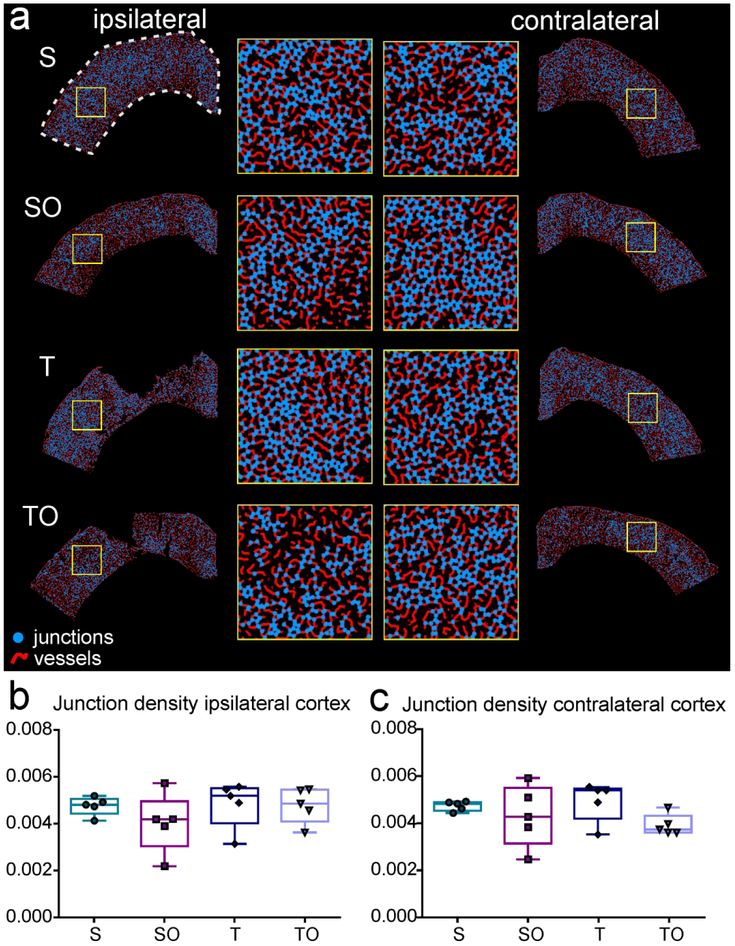
Vascular assessments were undertaken in the cortex (ROI represented by the dotted line in figure 9a) using T-lectin-stained tissue sections (Figure 9a). Quantitative vascular analysis revealed no differences in vessel density, vessel length (data not shown) or junction density (density of branching points, Figure 9b-c).
Figure 9.
Analysis of vessel characteristics in both contralateral and ipsilateral cortex on tomato-lectin stained tissue, the ROI is shown by the white dotted line, (a) Angiotool-processed images representing each experimental group. Junctions are shown in blue and vessels in red. Yellow insets represent enlarged region of cortex, (b-c) OPN treatment in sham (SO) or injury animals (TO) did not induce any significant change in vessel junction density compared to untreated sham (S) or injury (T) group.
Statistics: Ipsilateral junction density: Kruskal-Wallis test χ2 (3)=2.291, n=5 per group, P=0.5142; Contralateral junction density: Kruskal-Wallis test χ2 (3)=4.897, n=5 per group, *P=0.1795.
Discussion
OPN, an extracellular matrix glycoprotein with pleiotropic effects, has shown conflicting results regarding neuroprotection in different brain injury models. Here, we tested the effects of intranasal OPN treatment in a rat model of moderate-to-severe TBI. We assessed the outcome at 1 dpi by using neurological testing, MRI, and immunohistochemistry. We found minimal effects of OPN in minimizing the downstream effects of TBI: there was no significant effect of OPN on the neurological outcome, lesion volumes, tissue and vessel characteristics, BBB permeability, or astrogliosis. However, we found that OPN might induce an increased microglial response early after TBI, as well as an increased variability in the lesion volume and HO-1 response. Correlational analyses found a possible correlation between HO-1 and edema volumes.
The assessment of the neurological score at 1 dpi did not reveal any significant differences between TBI and TBI + OPN (Figure 1). In contrast, treatments with OPN and OPN peptides were shown to improve the neurological score at 1 dpi after different stroke models: SAH in rats (Wu et al., 2016; W. Zhang et al., 2018), ICH in rats (W. Zhang et al., 2018) and in hyperglycemic rats (Gong et al., 2018), and MCAO in mice (Doyle et al., 2008). These differences between our results and these previous studies could be due to the different injury models and the different brain regions affected.
MRI derived lesion volumes were not significantly modified by OPN (Figure 2). OPN did not modify the total lesion, the edema or the hemorrhage components of the lesion. This is in contrast with previous stroke studies showing decreased brain water content (edema) (Gong et al., 2018; Wu et al., 2016; W. Zhang et al., 2018) or infarct volume as assessed by histology (Doyle et al., 2008) at 1 dpi. Another mouse study of neonatal hypoxia-ischemia noted tissue loss in the grey matter after intranasal or intracerebroventricular administration of OPN-derived peptides (Albertsson et al., 2014). However, lesion evolution and mode of injury induction in TBI are dramatically different than the lesion in stroke models, in which the initial injury continues to expand (core and penumbra; (Ghosh et al., 2014). In TBI, the lesion is immediate and does not continue to expand. Thus, OPN treatment in TBI may have altered efficacy at different time points post injury, which we did not explore in the current study.
Whole brain analysis of T2 values further revealed that water content (edema) one day after injury was not significantly altered by OPN. This was interesting in light of stroke studies that showed reduced edema (Gong et al., 2018; Wu et al., 2016; W. Zhang et al., 2018). OPN also increased heterogeneity in TBI treated animals (see CA1 in Figure 4b) where two groups appear. Although there was an insufficient number of animals in the present study to explore these relationships, it suggests that some TBI rats may respond better to OPN treatment than others, a possibility that should be explored in future studies.
BBB integrity, assessed by IgG immunostaining, also was not protected by OPN in our model at 1 dpi (Figure 5). A role for OPN in BBB function has been suggested by Iwanaga and colleagues, when they reported that OPN was the most up-regulated protein in BBB-damaged vessels within the rat hippocampus (Iwanaga et al., 2008). By using OPN siRNA and rOPN, Suzuki and colleagues showed that the BBB was protected by OPN three days after SAH in rats (Suzuki, Hasegawa, Kanamaru, & Zhang, 2010). However, in their study, OPN was administered one hour prior to SAH induction whereas we treated the rats one hour after the injury onset. The different results between this study and ours could be due to the nature of the lesion, the time of the treatment, and/or the time point studied (3 vs.1 dpi).
To our knowledge, our study this is the first assessing vessel characteristics after OPN treatment in a brain injury model. We did not detect any significant changes in vessel density, vessel length or junction density at 1 dpi, but it might be too early to see a potential effect of the treatment.
OPN did not significantly alter the inflammatory profile of reactive astrocytes as assessed by GFAP staining (Figure 6). In ischemic stroke, OPN is upregulated in astrocytes (Choi, Kim, Cha, Choi, & Lee, 2007) but little is known about the effect of OPN treatment on the fate of astrocytes. In our model, analysis of astrogliosis at later time points may shed light on the effect of OPN treatment on astrocytes.
We found that OPN treatment after TBI in rats resulted in increased microglial activation at 1 dpi (Figure 7), consistent with findings reporting that OPN is a proinflammatory cytokine. Several studies have suggested an interaction between OPN and microglia (Yu, Liu, & Zhong, 2017). For example, an in vitro study demonstrated that incubation of recombinant OPN with porcine microglia increased their proliferation and activation (Tambuyzer, Casteleyn, Vergauwen, Van Cruchten, & Van Ginneken, 2012). OPN is also known to be released by microglia/macrophages after inflammatory insult, leading to activation of pro-survival pathways such as Integrin-linked Kinase/Rac-1 (Wu et al., 2016) and mitogen-activated protein kinase phosphatase-1 (Suzuki et al., 2010). OPN can also lead to decreased induction of proinflammatory pathways such as JAK2/Stat1 (Gong et al., 2018) through its various receptors such as several integrins and CD44 (Weber, 2001; Weber, Ashkar, Glimcher, & Cantor, 1996). Thus, this increased early microglial activation could possibly lead to enhanced neuroprotection at later time points.
An interesting result of our study was the positive correlation between the lesion volume (driven by edema) and the expression of HO-1, which was decreased when rats were treated with OPN (Figure 8 and table 3). HO-1 is an anti-oxidant enzyme that converts heme into carbon monoxide, biliverdin and ferrous iron (Tenhunen, Marver, & Schmid, 1968). Its expression is induced by a wide range of stressors such as heme, hypoxia and heat (Sharp, Zhan, & Liu, 2013). To our knowledge, only one study has investigated the effects of OPN on HO-1 expression in the brain: Lu and colleagues showed that OPN induced an increase in HO-1 upregulation in glioma cells (Lu et al., 2012). In our model, we did not observe any significant direct effect of OPN on HO-1 expression levels. It did appear, however, that OPN perturbed the HO-1 response to TBI particularly in relation to edema, as shown by the weaker correlation in OPN-treated rats compared to non-treated rats. As seen for edema/HO-1, edema/activated microglia and edema/IgG, there was a weak correlation between HO-1 and number of activated microglia when rats are treated with OPN (R2=0.73 for all groups, R2=0.83 for non-treated rats, R2=0.68 for OPN-treated rats). This suggests again a disrupted HO-1 response as well as microglial response to injury in presence of OPN. In addition, it highlights a relationship between microglial activation and HO-1 induction, which is not surprising since microglial cells are known to express HO-1 after injury (Z. Zhang et al., 2017).
To conclude, we observed that intranasal OPN administered one hour after TBI induced an increased number of activated microglia and a potential effect on the HO-1 response to injury one day later. Our results clearly point to the need for additional studies to determine whether OPN could be used as a potential treatment for TBI. Although we have not observed any deleterious effects at one day post TBI, additional experiments including more animals and more time points need to be run to determine whether intranasal OPN can indeed activate protective signaling pathways that would limit BBB leakage, edema, and hemorrhage, ultimately leading to improved neurological outcomes.
Supplementary Material
Supplementary Table1: Brain regions excluded from T2 values analysis
Significance statement.
There is currently no treatment available for traumatic brain injury (TBI). Osteopontin (OPN) is a pleiotropic glycoprotein shown to have neuroprotective effects in a variety of preclinical stroke models. We tested the effect of the intranasal OPN administration one hour after TBI in male rats and found that, one day after injury, OPN induced increased the number of activated microglia but did not influence the neurological outcome, the lesion characteristics, or the astroglial response. We also demonstrated a correlation between edema volume and expression of the heme degrading enzyme HO-1.
Acknowledgments
Support information: NIH Program Project Grant from NINDS 1PO1NS082184, Project 3)
Footnotes
Conflict of Interest Statement
The authors declare no conflict of interest.
Data accessibility statement
The datasets generated and analyzed during the current study are available from the corresponding author on reasonable request.
References
- Albertsson AM, Zhang X, Leavenworth J, Bi D, Nair S, Qiao L, … Wang X (2014). The effect of osteopontin and osteopontin-derived peptides on preterm brain injury. J Neuroinflammation, 11, 197. doi: 10.1186/s12974-014-0197-0 [DOI] [PMC free article] [PubMed] [Google Scholar]
- Avants BB, Tustison NJ, Song G, Cook PA, Klein A, & Gee JC (2011). A reproducible evaluation of ANTs similarity metric performance in brain image registration. Neuroimage, 54(3), 2033–2044. doi: 10.1016/j.neuroimage.2010.09.025 [DOI] [PMC free article] [PubMed] [Google Scholar]
- Bramlett HM, & Dietrich WD (2015). Long-Term Consequences of Traumatic Brain Injury: Current Status of Potential Mechanisms of Injury and Neurological Outcomes. J Neurotrauma, 32(23), 1834–1848. doi: 10.1089/neu.2014.3352 [DOI] [PMC free article] [PubMed] [Google Scholar]
- Choi JS, Kim HY, Cha JH, Choi JY, & Lee MY (2007). Transient microglial and prolonged astroglial upregulation of osteopontin following transient forebrain ischemia in rats. Brain Res, 1151, 195–202. doi: 10.1016/j.brainres.2007.03.016 [DOI] [PubMed] [Google Scholar]
- Denhardt DT, Noda M, O'Regan AW, Pavlin D, & Berman JS (2001). Osteopontin as a means to cope with environmental insults: regulation of inflammation, tissue remodeling, and cell survival. J Clin Invest, 107(9), 1055–1061. doi: 10.1172/JCI12980 [DOI] [PMC free article] [PubMed] [Google Scholar]
- Doyle KP, Yang T, Lessov NS, Ciesielski TM, Stevens SL, Simon RP, … Stenzel-Poore MP (2008). Nasal administration of osteopontin peptide mimetics confers neuroprotection in stroke. J Cereb Blood Flow Metab, 28(6), 1235–1248. doi: 10.1038/jcbfm.2008.17 [DOI] [PMC free article] [PubMed] [Google Scholar]
- Faul M, Xu L, Wald MM, & Coronado V (2010). Traumatic brain injury in the United States: emergency department visits, hospitalizations, and deaths, 2002–2006 National Center for Injury Prevention and Control, Atlanta, GA: CDC. [Google Scholar]
- Garcia JH, Wagner S, Liu KF, & Hu XJ (1995). Neurological deficit and extent of neuronal necrosis attributable to middle cerebral artery occlusion in rats. Statistical validation. Stroke, 26(4), 627–634; discussion 635. [DOI] [PubMed] [Google Scholar]
- Ghosh N, Recker R, Shah A, Bhanu B, Ashwal S, & Obenaus A (2011). Automated ischemic lesion detection in a neonatal model of hypoxic ischemic injury. J Magn Reson Imaging, 33(4), 772–781. doi: 10.1002/jmri.22488 [DOI] [PubMed] [Google Scholar]
- Ghosh N, Sun Y, Bhanu B, Ashwal S, & Obenaus A (2014). Automated detection of brain abnormalities in neonatal hypoxia ischemic injury from MR images. Med Image Anal, 18(7), 1059–1069. doi: 10.1016/j.media.2014.05.002 [DOI] [PMC free article] [PubMed] [Google Scholar]
- Gong L, Manaenko A, Fan R, Huang L, Enkhjargal B, McBride D, … Zhang JH (2018). Osteopontin attenuates inflammation via JAK2/STAT1 pathway in hyperglycemic rats after intracerebral hemorrhage. Neuropharmacology, 138, 160–169. doi: 10.1016/j.neuropharm.2018.06.009 [DOI] [PMC free article] [PubMed] [Google Scholar]
- Iwanaga Y, Ueno M, Ueki M, Huang CL, Tomita S, Okamoto Y, … Sakamoto H (2008). The expression of osteopontin is increased in vessels with blood-brain barrier impairment. Neuropathol Appl Neurobiol, 34(2), 145–154. doi: 10.1111/j.1365-2990.2007.00877.x [DOI] [PubMed] [Google Scholar]
- Jono S, Peinado C, & Giachelli CM (2000). Phosphorylation of osteopontin is required for inhibition of vascular smooth muscle cell calcification. J Biol Chem, 275(26), 20197–20203. doi: 10.1074/jbc.M909174199 [DOI] [PubMed] [Google Scholar]
- Jullienne A, Obenaus A, Ichkova A, Savona-Baron C, Pearce WJ, & Badaut J (2016). Chronic cerebrovascular dysfunction after traumatic brain injury. J Neurosci Res, 94(7), 609–622. doi: 10.1002/jnr.23732 [DOI] [PMC free article] [PubMed] [Google Scholar]
- Kim MD, Cho HJ, & Shin T (2004). Expression of osteopontin and its ligand, CD44, in the spinal cords of Lewis rats with experimental autoimmune encephalomyelitis. J Neuroimmunol, 151(1–2), 78–84. doi: 10.1016/j.jneuroim.2004.02.014 [DOI] [PubMed] [Google Scholar]
- Li J, Siegel M, Yuan M, Zeng Z, Finnucan L, Persky R, … McCullough LD (2011). Estrogen enhances neurogenesis and behavioral recovery after stroke. J Cereb Blood Flow Metab, 31(2), 413–425. doi: 10.1038/jcbfm.2010.181 [DOI] [PMC free article] [PubMed] [Google Scholar]
- Lu DY, Yeh WL, Huang SM, Tang CH, Lin HY, & Chou SJ (2012). Osteopontin increases heme oxygenase-1 expression and subsequently induces cell migration and invasion in glioma cells. Neuro Oncol, 14(11), 1367–1378. doi: 10.1093/neuonc/nos262 [DOI] [PMC free article] [PubMed] [Google Scholar]
- Maetzler W, Berg D, Schalamberidze N, Melms A, Schott K, Mueller JC, … Nitsch C (2007). Osteopontin is elevated in Parkinson's disease and its absence leads to reduced neurodegeneration in the MPTP model. Neurobiol Dis, 25(3), 473–482. doi: 10.1016/j.nbd.2006.10.020 [DOI] [PubMed] [Google Scholar]
- Menon DK, Schwab K, Wright DW, Maas AI, Demographics, Clinical Assessment Working Group of the, I., … Psychological, H. (2010). Position statement: definition of traumatic brain injury. Arch Phys Med Rehabil, 91(11), 1637–1640. doi: 10.1016/j.apmr.2010.05.017 [DOI] [PubMed] [Google Scholar]
- O'Regan A, & Berman JS (2000). Osteopontin: a key cytokine in cell-mediated and granulomatous inflammation. Int J Exp Pathol, 81(6), 373–390. [DOI] [PMC free article] [PubMed] [Google Scholar]
- Obenaus A (2015). Traumatic Brain Injury In Friedman H (Ed.), Encyclopedia of mental health (2nd ed., pp. 329–340). Waltham, MA: Academic Press. [Google Scholar]
- Obenaus A, Ng M, Orantes AM, Kinney-Lang E, Rashid F, Hamer M, … Pearce WJ (2017). Traumatic brain injury results in acute rarefication of the vascular network. Sci Rep, 7(1), 239. doi: 10.1038/s41598-017-00161-4 [DOI] [PMC free article] [PubMed] [Google Scholar]
- Papp EA, Leergaard TB, Calabrese E, Johnson GA, & Bjaalie JG (2014). Waxholm Space atlas of the Sprague Dawley rat brain. Neuroimage, 97, 374–386. doi: 10.1016/j.neuroimage.2014.04.001 [DOI] [PMC free article] [PubMed] [Google Scholar]
- Peeters W, van den Brande R, Polinder S, Brazinova A, Steyerberg EW, Lingsma HF, & Maas AI (2015). Epidemiology of traumatic brain injury in Europe. Acta Neurochir (Wien), 157(10), 1683–1696. doi: 10.1007/s00701-015-2512-7 [DOI] [PMC free article] [PubMed] [Google Scholar]
- Sharp FR, Zhan X, & Liu DZ (2013). Heat shock proteins in the brain: role of Hsp70, Hsp 27, and HO-1 (Hsp32) and their therapeutic potential. Transl Stroke Res, 4(6), 685–692. doi: 10.1007/s12975-013-0271-4 [DOI] [PMC free article] [PubMed] [Google Scholar]
- Shin T (2012). Osteopontin as a two-sided mediator in acute neuroinflammation in rat models. Acta Histochem, 114(8), 749–754. doi: 10.1016/j.acthis.2012.08.004 [DOI] [PubMed] [Google Scholar]
- Suzuki H, Hasegawa Y, Kanamaru K, & Zhang JH (2010). Mechanisms of osteopontin-induced stabilization of blood-brain barrier disruption after subarachnoid hemorrhage in rats. Stroke, 41(8), 1783–1790. doi: 10.1161/STROKEAHA.110.586537 [DOI] [PMC free article] [PubMed] [Google Scholar]
- Tambuyzer BR, Casteleyn C, Vergauwen H, Van Cruchten S, & Van Ginneken C (2012). Osteopontin alters the functional profile of porcine microglia in vitro. Cell Biol Int, 36(12), 1233–1238. doi: 10.1042/CBI20120172 [DOI] [PubMed] [Google Scholar]
- Tanapat P, Hastings NB, Reeves AJ, & Gould E (1999). Estrogen stimulates a transient increase in the number of new neurons in the dentate gyrus of the adult female rat. J Neurosci, 19(14), 5792–5801. [DOI] [PMC free article] [PubMed] [Google Scholar]
- Tenhunen R, Marver HS, & Schmid R (1968). The enzymatic conversion of heme to bilirubin by microsomal heme oxygenase. Proc Natl Acad Sci U S A, 61(2), 748–755. [DOI] [PMC free article] [PubMed] [Google Scholar]
- Topkoru BC, Altay O, Duris K, Krafft PR, Yan J, & Zhang JH (2013). Nasal administration of recombinant osteopontin attenuates early brain injury after subarachnoid hemorrhage. Stroke, 44(11), 3189–3194. doi: 10.1161/STROKEAHA.113.001574 [DOI] [PMC free article] [PubMed] [Google Scholar]
- Tustison NJ, & Avants BB (2013). Explicit B-spline regularization in diffeomorphic image registration. Front Neuroinform, 7, 39. doi: 10.3389/fninf.2013.00039 [DOI] [PMC free article] [PubMed] [Google Scholar]
- Tustison NJ, Avants BB, Cook PA, Zheng Y, Egan A, Yushkevich PA, & Gee JC (2010). N4ITK: improved N3 bias correction. IEEE Trans Med Imaging, 29(6), 1310–1320. doi: 10.1109/TMI.2010.2046908 [DOI] [PMC free article] [PubMed] [Google Scholar]
- Wai PY, & Kuo PC (2004). The role of Osteopontin in tumor metastasis. J Surg Res, 121(2), 228–241. doi: 10.1016/j.jss.2004.03.028 [DOI] [PubMed] [Google Scholar]
- Weber GF (2001). The metastasis gene osteopontin: a candidate target for cancer therapy. Biochim Biophys Acta, 1552(2), 61–85. [DOI] [PubMed] [Google Scholar]
- Weber GF, Ashkar S, Glimcher MJ, & Cantor H (1996). Receptor-ligand interaction between CD44 and osteopontin (Eta-1). Science, 271(5248), 509–512. [DOI] [PubMed] [Google Scholar]
- Wu J, Zhang Y, Yang P, Enkhjargal B, Manaenko A, Tang J, … Zhang JH (2016). Recombinant Osteopontin Stabilizes Smooth Muscle Cell Phenotype via Integrin Receptor/Integrin-Linked Kinase/Rac-1 Pathway After Subarachnoid Hemorrhage in Rats. Stroke, 47(5), 1319–1327. doi: 10.1161/STROKEAHA.115.011552 [DOI] [PMC free article] [PubMed] [Google Scholar]
- Wung JK, Perry G, Kowalski A, Harris PL, Bishop GM, Trivedi MA, … Atwood CS (2007). Increased expression of the remodeling- and tumorigenic-associated factor osteopontin in pyramidal neurons of the Alzheimer's disease brain. Curr Alzheimer Res, 4(1), 67–72. [DOI] [PubMed] [Google Scholar]
- Yan YP, Lang BT, Vemuganti R, & Dempsey RJ (2009). Osteopontin is a mediator of the lateral migration of neuroblasts from the subventricular zone after focal cerebral ischemia. Neurochem Int, 55(8), 826–832. doi: 10.1016/j.neuint.2009.08.007 [DOI] [PubMed] [Google Scholar]
- Yu H, Liu X, & Zhong Y (2017). The Effect of Osteopontin on Microglia. Biomed Res Int, 2017, 1879437. doi: 10.1155/2017/1879437 [DOI] [PMC free article] [PubMed] [Google Scholar]
- Yushkevich PA, Piven J, Hazlett HC, Smith RG, Ho S, Gee JC, & Gerig G (2006). User-guided 3D active contour segmentation of anatomical structures: significantly improved efficiency and reliability. Neuroimage, 31(3), 1116–1128. doi: 10.1016/j.neuroimage.2006.01.015 [DOI] [PubMed] [Google Scholar]
- Zhang W, Cui Y, Gao J, Li R, Jiang X, Tian Y, … Cui J (2018). Recombinant Osteopontin Improves Neurological Functional Recovery and Protects Against Apoptosis via PI3K/Akt/GSK-3beta Pathway Following Intracerebral Hemorrhage. Med Sci Monit, 24, 1588–1596. [DOI] [PMC free article] [PubMed] [Google Scholar]
- Zhang Z, Song Y, Zhang Z, Li D, Zhu H, Liang R, … Wang J (2017). Distinct role of heme oxygenase-1 in early- and late-stage intracerebral hemorrhage in 12-month-old mice. J Cereb Blood Flow Metab, 37(1), 25–38. doi: 10.1177/0271678X16655814 [DOI] [PMC free article] [PubMed] [Google Scholar]
- Zudaire E, Gambardella L, Kurcz C, & Vermeren S (2011). A computational tool for quantitative analysis of vascular networks. PLoS One, 6(11), e27385. doi: 10.1371/journal.pone.0027385 [DOI] [PMC free article] [PubMed] [Google Scholar]
Associated Data
This section collects any data citations, data availability statements, or supplementary materials included in this article.
Supplementary Materials
Supplementary Table1: Brain regions excluded from T2 values analysis


