Significance
One of the greatest challenges in projecting the sea-level contributions of ice sheets over the next century is the lack of observations of conditions within and underneath the ice sheet that span more than a decade or two. By digitizing archival ice-penetrating radar data recorded in the 1970s on 35-mm optical film, we can compare modern and archival radar-sounding data at their full resolution in order to observe changes in the Antarctic ice sheet over more than 40 y. This makes it possible to investigate and model subsurface processes over both large scales and several decades for the first time.
Keywords: Antarctica, radio echo sounding, glaciology, remote sensing, archival data
Abstract
Airborne radar sounding can measure conditions within and beneath polar ice sheets. In Antarctica, most digital radar-sounding data have been collected in the last 2 decades, limiting our ability to understand processes that govern longer-term ice-sheet behavior. Here, we demonstrate how analog radar data collected over 40 y ago in Antarctica can be combined with modern records to quantify multidecadal changes. Specifically, we digitize over 400,000 line kilometers of exploratory Antarctic radar data originally recorded on 35-mm optical film between 1971 and 1979. We leverage the increased geometric and radiometric resolution of our digitization process to show how these data can be used to identify and investigate hydrologic, geologic, and topographic features beneath and within the ice sheet. To highlight their scientific potential, we compare the digitized data with contemporary radar measurements to reveal that the remnant eastern ice shelf of Thwaites Glacier in West Antarctica had thinned between 10 and 33% between 1978 and 2009. We also release the collection of scanned radargrams in their entirety in a persistent public archive along with updated geolocation data for a subset of the data that reduces the mean positioning error from 5 to 2.5 km. Together, these data represent a unique and renewed extensive, multidecadal historical baseline, critical for observing and modeling ice-sheet change on societally relevant timescales.
The greatest source of uncertainty in estimates of future sea-level rise is the contribution of continental ice sheets (1). A fundamental obstacle to providing robust sea-level projections on the decadal-to-century timescales used in assessment and planning is our poor understanding of subsurface and ice-shelf processes in the potentially unstable marine sectors of Antarctica where retreating ice would encounter deepening water (2). However, unlike surface-elevation and ice-velocity data, which can be derived from satellites to produce long-spanning, continent-scale, and repeat time series (3, 4), direct observations of ice thickness and subsurface conditions at the glacier-catchment to ice-sheet scales are only possible from airborne ice-penetrating radar-sounding surveys (5). Unfortunately, the cost and logistics involved in these surveys have resulted in much of the Antarctic subsurface being observed on only a single occasion (6). An extensive, early ice-penetrating radar survey, collected in the 1970s by an international collaboration between the Scott Polar Research Institute (SPRI) at the University of Cambridge, the National Science Foundation (NSF), and the Technical University of Denmark (TUD) was recorded on optical film reels, which were physically stored at the SPRI in Cambridge (7, 8) (Fig. 1). These data provide a benchmark against which more recent data can be compared to assess changes in ice thickness and subsurface conditions. However, even in regions where repeat observations do exist (9–11), most of the airborne sounding data have been collected in the last 2 decades and have yet to be used for longer timescale analysis due to the limited availability and fidelity of the archival film data. In this paper, we address this challenge by scanning and releasing the entire film record along with updated posting for a subset of the data. We illustrate the range of ice-sheet subsurface features captured in these records and demonstrate how they can be used to investigate temporal change even in regions with relatively poor initial or updated geolocation.
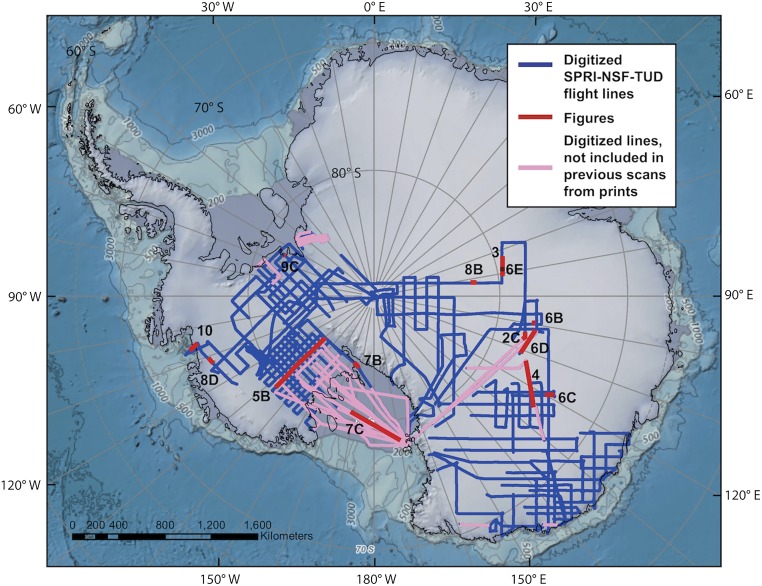
Fig. 1.
Film scanning coverage improvement. Scanned radar-sounding film records span both the East and West Antarctic ice sheets. Flight lines of the high-resolution scanned radar film, including 25% never scanned previously at any resolution (pink lines) (12).
The SPRI/NSF/TUD radar-sounding survey, collected from 1971 to 1979, produced over 400,000 line-km of subsurface profiles (7, 8, 12, 13). The radar system operated at center frequencies of 60 MHz and/or 300 MHz with aircraft positioning calculated using an inertial navigation system with a reported accuracy of 5 km (8) registered to an internal Coded Binary Decimal (CBD) clock/counter. Radar traces were processed onboard using an analog implementation of pulse compression and unfocused synthetic aperture radar processing. The resulting fast-time gradient in returned power was log-detected and recorded on 35-mm optical film as “Z-scope” radargram profiles. These original analog radar profiles and their interpretation at the time were instrumental in the discovery and early understanding of, for example, subglacial lakes (14, 15), ice-shelf processes (16, 17), ice-core climate records (18), and the topography of the underlying continent (6, 19). Since then, modern digital descendants of this system have also been used to investigate regional volcanism (20), englacial structures including ice-sheet stratigraphy and freeze-on features (21), and subsurface melting (9). However, the complete, digitized, high resolution data set has not been released to a persistent public archive, despite its foundational role in Antarctic glaciology and a previous effort that scanned photographic prints from a subset of the survey (12, 22).
Our goals are to describe and demonstrate the utility of the SPRI/NSF/TUD radar records in multidecadal analyses and to produce high-resolution scans of the entire 35-mm-film archive fully available to enable systematic continent-scale syntheses of high-quality archival and modern radar-sounding data. This dataset improves the coverage, resolution, and geolocation of radar profiles available for inclusion in interpolated bed-topography maps of Antarctica and for the interpretation of subglacial and englacial features in the radargrams. A principal challenge for any quantitative or multitemporal analysis using this dataset is the accuracy of its geolocation, which had an estimated mean error of <5 km from inertial navigation when collected (8) and which hampers temporal change detection if uncorrected. We have reduced that error to an average of 2.5 km through cross-correlation with contemporary sounding data for a subset of the survey (6) (Methods). This will continue to improve as additional data are collected and the radargrams and thickness profiles that make up gridded datasets (e.g., ref. 6) are released. However, even with the existing geolocation, finer-scale registration and interpretation are possible at or near the inherent range (meters) and azimuth resolution of the radargrams (10s of meters) if distinct features can be identified. We demonstrate this type of long-baseline, profile-based, geolocation-insensitive comparison with contemporary glaciological observations by investigation of ocean-driven processes beneath 2 West Antarctic ice shelves.
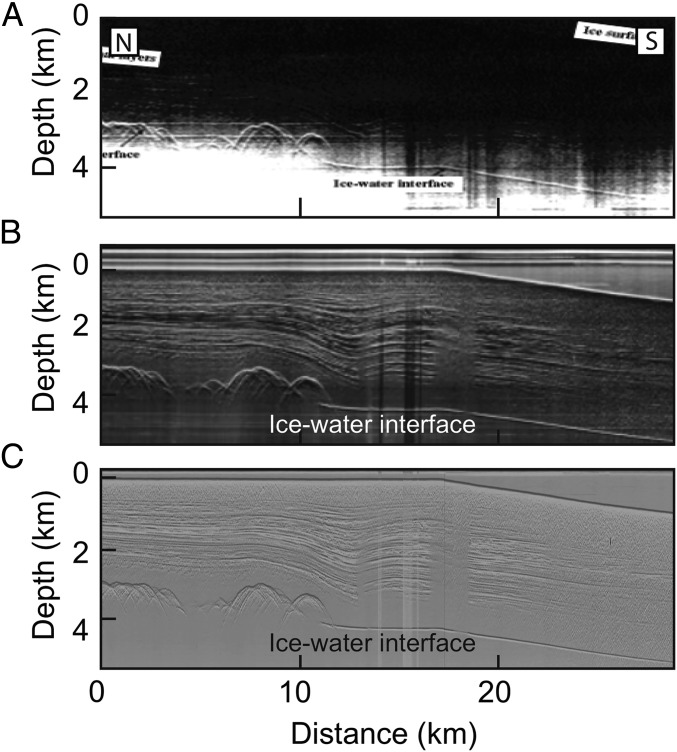
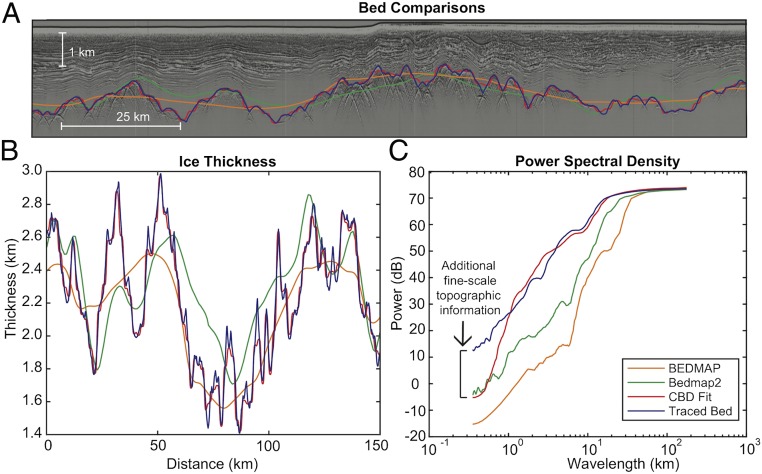
The improved coverage (Fig. 1), georectification, spatial resolution, and radiometric sensitivity (Fig. 2) of the scanned film record highlights the greater fine-scale (<1 km) topographic information (Fig. 3) available from our scans of the same SPRI/NSF/TUD data (blue line in Fig. 3) when compared with those included in existing bed-topography datasets (6, 19); this includes both the smoothed topography in the gridded products (orange and green lines in Fig. 3) and in the presmoothed A-scope or “CBD-spaced” (Methods) profiles used in those products (red line in Fig. 3). This topographic information will enable both retrospective and prognostic ice-sheet modeling aimed at improved understanding of basal motion, grounding-line stability, and other processes that are sensitive to basal roughness and fine-scale topography (23).
Fig. 2.
Film scanning resolution improvement. (A) Published radar film print of the Lake Vostok region originally acquired in 1974 (15). (B) Intermediate resolution scan of radar film print of the same portion of film (12). (C) High-resolution direct scan of the same portion of film in greater resolution––this report.
Fig. 3.
Example of improved-resolution bed topography from digitized historic radar film. (A) A 60-MHz 1978 Z-scope radar profile in the Gamburtsev Mountains with topography from BEDMAP (19) (orange), Bedmap2 (6) (green), interpolation of thickness measurements at the spacing of A-scope traces (cubic interpolation based on CBD clock/counter 2.5 km spacing) (19) (red) and tracing the bed in the Z-scope radargram (blue). (B) The resulting ice-thickness profiles. (C) The power spectra of these basal profiles.
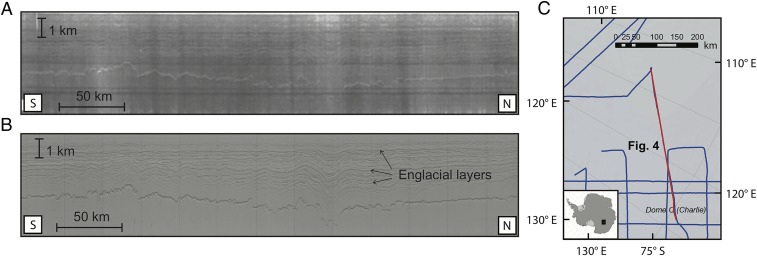
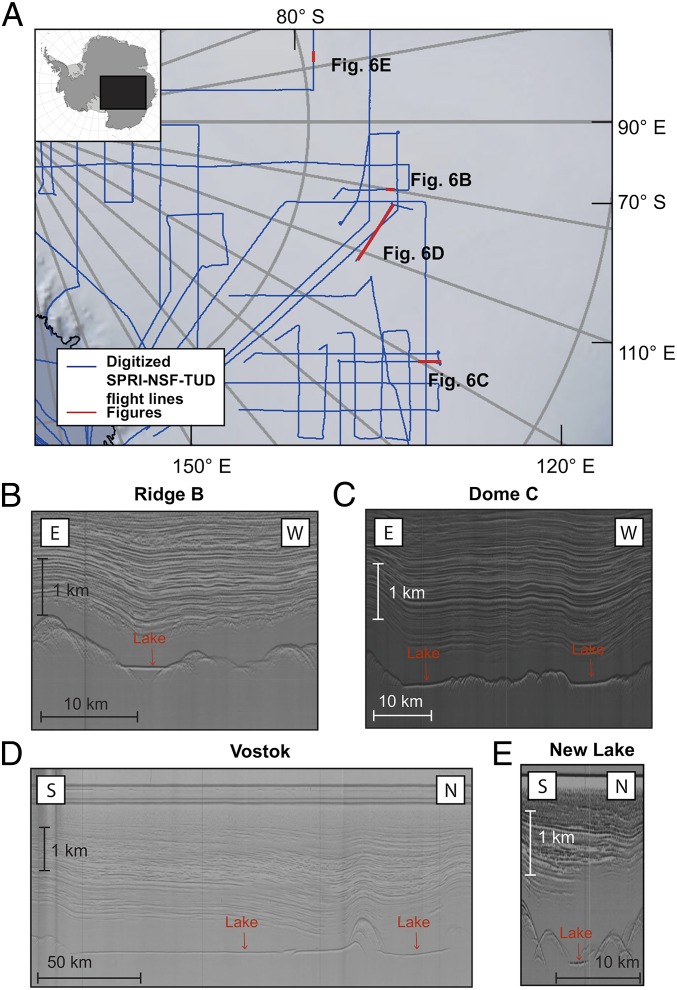
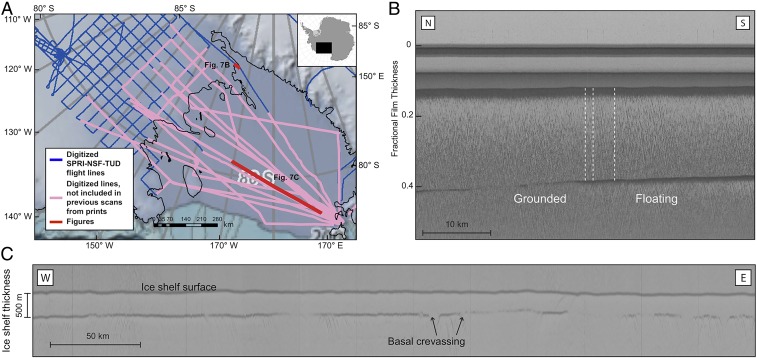
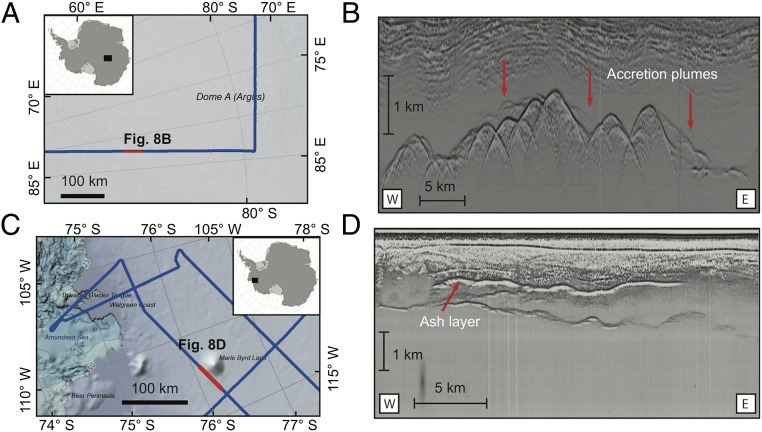
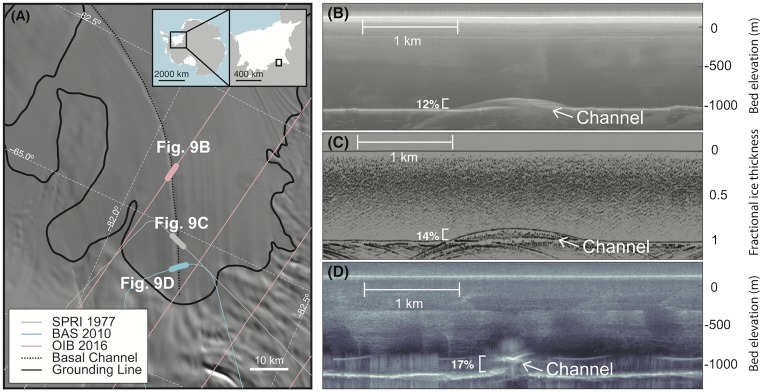
The improved geometric and radiometric resolution of the scans also enhances the interpretability of a wide range of englacial and basal ice-sheet features. This includes profiles with englacial layers that connect ice core age–depth relationships (e.g., ref. 18) with the enhanced range resolution (Fig. 4). Additionally, the improved resolution and coverage of the scans also enable the construction of contiguous cross-sections of the Siple Coast ice streams (Fig. 5), among others, and the expansion of subglacial lake inventories (e.g., ref. 22) to include smaller lakes that have previously been difficult to resolve (Fig. 6). Much of the film record that has been scanned (Fig. 1) was recorded over ice shelves and their grounding zones, particularly the Ross Ice Shelf (Fig. 7). Ice shelves can evolve dramatically over decadal timescales (e.g., ref. 9) and can now be investigated by comparison with contemporary surveys (24). The scans also reveal unique features that have been identified in modern radar-sounding data but were previously unidentified in the SPRI film record, such as accretion bodies (21) and englacial ash layers (20) (Fig. 8), or ice-shelf basal channels (25) (Fig. 9).
Fig. 4.
Enhanced englacial layer record. (A) A 1974 60-MHz profile of englacial radar layers used to connect the englacial stratigraphy to ice core age records from the Dome C and Vostok Ice Cores (18). (B) The same profile scanned with the greater geometric and radiometric resolution provided by our study, revealing deeper and more continuous layers. (C) Map of profile location.
Fig. 5.
Contiguous cross-section of the Siple Coast ice streams. (A) A 1974 60-MHz cross-section of the Siple Coast ice streams from paper scans of the SPRI/NSF/TUD archive (12). (B) A similar cross-section with improved resolution and with greater spatial continuity. The shear margins and bed across the ice streams are visible across the profile as well as internal layering within the MacAyeal and Bindschadler ice streams, which was not the case in previously scanned data. (C) Map of profile location for Fig. 5B.
Fig. 6.
Expanded subglacial lake mapping. (A) A selection of subglacial lakes profiles at 60 MHz in East Antarctica including lakes that have been previously identified (22, 39, 40) (B–D) and a lake identified from our high-resolution scan of a 1978 film profile (E).
Fig. 7.
Expanded coverage of the Ross Ice Shelf and the Siple Coast. (A) Previously unscanned profiles (light red) dramatically expand the available data for the Siple Coast including (B) a 1974 60-MHz profile of the grounding line of Mercer ice stream showing grounded and floating basal topography as well as surface and crevassing, enabling assessment of ocean access (10, 41). Dashed vertical lines indicate where this survey crosses the modern grounding line as measured by satellite observations (4) suggesting that the location of the grounding line in this area has not significantly changed. Most of the radar-sounding profiles of ice shelves, like the Ross Ice Shelf (C), have been scanned and provide a baseline ice thickness and basal geometry from 1974 against which more recent surveys (24) can be compared to observe ice-shelf processes and change.
Fig. 8.
Previously unidentified features. (A) Context map for (B) high-resolution scans of accretional ice bodies (red arrows) from film data acquired at 60-MHz 1978 in the Gamburtsev Subglacial Mountain region, where they were discovered in modern MCoRDs data (21, 42) and (C) context map for (D) an englacial ash layer in the Marie Byrd Land region shown in a 1978 60-MHz sounding profile in the same region as their discovery in modern high-capability radar sounder (HiCaRS) sounding profile (20): The layer was interpreted as evidence for volcanism.
Fig. 9.
Forty years of stability for an ice-shelf basal channel. (A) Location of radar-sounding observations of a channel in the base of the FRIS in 1977, 2010 (25), and 2016 (Methods) across the channel (dashed black line) identified by its surface expression visible in satellite imagery (43). (B) The 2016 MCoRDS observation (Methods) shows its height (12% of shelf thickness) (26) is consistent with (C) the 1977 scanned radar film (14% ± 2%) and (D) the 2010 PASIN (25) observations (17%).
Beyond enhancing radargram interpretation and fine-scale topographic information, the digitized film records provide a powerful historical baseline to compare with modern radar-sounding data. These records enable measurements of changes in ice thickness, englacial features, and basal conditions over time spans approaching or exceeding 40 y. For example, our scans include a profile from 1978 data (Fig. 9) over an ice-shelf basal channel, first discovered beneath the Filchner–Ronne Ice Shelf (FRIS) using 2010 British Antarctic Survey Polarimetric radar Airborne Sounding INstrument (PASIN) data (25). The channel was surveyed again using the Center for Remote Sensing of Ice Sheets (CReSIS) Multichannel Coherent Radar Depth Sounder (MCoRDS) as part of the Operation IceBridge 2016 campaign (26). Because this channel is an isolated and easily recognizable feature within the geolocation window (even with the original inertial positioning), we are able to precisely register the profiles in the along-track direction and estimate its height with respect to the percentage of the ice-shelf thickness (Methods). Together, these 3 measurements suggest that the channel height has been relatively stable over the 39-y period, occupying between 12 and 17% of the ice-shelf thickness. The long temporal baseline of these measurements provide subsurface observational evidence of ice-shelf channel geometry on a multidecadal timescale.
In contrast to the stability of the FRIS basal channel, a similar comparison between a 1978 SPRI profile from the Amundsen Sea Embayment (ASE) of West Antarctica with 2 2009 Operation Ice Bridge (OIB) radar-sounding profiles (27) reveals dramatic changes in the subsurface geometry of the remnant eastern ice shelf of Thwaites Glacier, West Antarctica (Fig. 10), which we refer to hereafter as the Thwaites Eastern Ice Shelf (TEIS). In general, the TEIS begins to float seaward of a potentially stabilizing inland ridge and regrounds on an offshore ridge (28) (Fig. 10). The TEIS currently buttresses a portion of the ASE grounding zone along the Walgreen Coast, which is the boundary between Thwaites Glacier and Pine Island Glacier, 2 of the most rapidly changing and potentially unstable glaciers in Antarctica (2, 29). This ice shelf was previously dynamically coupled to the faster-flowing tongue of Thwaites Glacier. However, after 2006, the section connecting the ice shelves collapsed, leading to divergent flow histories (29, 30). This dynamic event caused TEIS to become the only portion of the ASE with decelerating ice flow, in part due to the portion grounded on an offshore ridge (28). Although the potential importance of a stable TEIS to the overall dynamics of Thwaites Glacier has been suggested (29), the lack of direct, long-term observations of subsurface ice-shelf geometry (31) and evolution (9) has made its role challenging to assess until now.
Fig. 10.
Three decades of change beneath the eastern ice shelf of Thwaites Glacier. (A) Map showing the locations of the 2009 OIB (purple lines) and 300-MHz 1978 SPRI radar profiles (orange line) with colored dots showing intersection locations. Black line shows the contemporary grounding line. (B) The SPRI sounding profile scanned from 1978 analog data. (C) An OIB radar-sounding profile from 2009, which crosses the 1978 line near the grounding line (green square). (D) An additional OIB radar-sounding profile from 2009, which crosses the 1978 line near the regrounding point (yellow square). Widths of the colored squares correspond to the uncertainty in intersection locations. All 3 profiles show a grounded inland ridge, the inland extent of basal crevassing, and the regrounding of the ice shelf on an offshore ridge (28). (E) The floating portion of the ice shelf (seaward of basal crevassing as indicated by the red bars) thinned from 527 ± 43 m to 412 ± 45 m in 30 y. (F) In the same period, the regrounded portion of the ice shelf remained relatively stable, thickening by 19 ± 43 m.
By comparing the 1978 (Fig. 10B) and 2009 profiles (Fig. 10 C and D), we place broad observational constraints on the evolution of the ice shelf over a 30-y period. By comparing the thickness of the floating and the regrounded portions of the ice shelf interpreted in the radargrams (Fig. 10), we estimate that TEIS lost ∼115 ± 62 m of ice thickness (∼10–33%) from 1978 to 2009 (Fig. 10E) (Methods). This contrasts with the regrounded portion of the shelf, which appears stable within our uncertainty estimate (∼19 ± 43 m) (Fig. 10F) over the same period (Methods), suggesting that basal melting rather than dynamic thinning may be the primary cause of the observed thickness change in the floating portion of TEIS. Through this comparison of archival and modern data, we estimate a thinning rate of ∼40 m per decade, higher than the thinning rate of 25 m per decade based on ice-shelf surface altimetry acquired from 1994 to 2012 (3, 32, 33). One possible explanation for the differences in these estimates is that submarine melting slowed from the 1978–1994 period to the 1994–2009 period. However, given the cooler ocean temperatures in the earlier period (34), it is more likely that the ice-shelf-scale altimetry, which estimates a single value for both TEIS and Thwaites Ice Tongue, does not capture the finer-scale local thinning apparent in radar-sounding data. These results suggest that the reduced ice velocities of TEIS during the past decade will not serve to stabilize the Walgreen Coast (29), but instead the TEIS will undergo further thinning and unpinning (28) that could act to destabilize the rest of the ice shelf in the coming decades.
The contrasting stability of the FRIS basal channel and the rapid melting of eastern ice shelf of Thwaites Glacier are 2 examples of multidecadal analyses made possible by high-resolution scans of archival radar data. As a collection, the scanned SPRI/NSF/TUD analog film archive provides a wealth of detailed and extensive topographic information from one of the largest Antarctic radar-sounding surveys and facilitates enhanced interpretation of englacial and subglacial features, including those previously identified only in modern digital data. These scans extend the time period of radar-sounding observations on englacial and subglacial conditions by 25 y or more across more than 40% of East and West Antarctica. This multidecadal record allows for direct observation and modeling of dynamic processes on the timescales needed for the long-term projections used in climate assessments and planning (1), especially in more slowly changing, although still potentially unstable regions of Antarctica.
Methods
In this paper, we scan and release the entire NSF/SPRI/TUD film archive held at the SPRI at the University of Cambridge using a LaserGraphics 35-mm optical film digitization system. This resulted in over 750,000 35-mm frames at 1,800 × 2,400 resolution with 16 bits per sample, which were stitched together using OpenCV to form over 38,000 20-frame-wide Z-Scope radargrams. The film also included 5 distinct integer metadata fields (Date, Time, Flight, Mode, and CBD) which were extracted using the Tesseract optical character recognition (OCR) engine and, where available, are documented and released for permanent public access along with the corresponding 20-frame images through the Stanford Digital Repository (SDR). This state-of-the-art digitization process provides a significant improvement over the radar-sounding profiles available in existing publications and previous print-scanning efforts (12) in terms of coverage (Fig. 1) (with >25% more of the original survey included compared to the previous print-based scans), radiometric sensitivity (Fig. 2), and resolution (film scans have over twice the resolution than previously available) (Fig. 3). The scans are not radiometrically calibrated (35).
The positions recorded during the original SPRI/NSF/TUD surveys (8, 12, 13, 36–38) were collected from an inertial navigation system and registered to an internal system counter, resulting in positions with reported accuracies of <5–8 km (8, 22). As part of our initial scanning and data-release effort, we used gridded ice-thickness values from modern radar-sounding data (6) to coregister film-derived thickness and positioning values, where available, by updating the heading and velocity for each linear flight subsegment to minimize the thickness misfit. This analysis was applied to every scanned survey line with extant positioning data and produced improved positioning for subsegments of 38 out of the 54 scanned survey lines with positioning data, spanning a total of ∼22,000 line-km. Positions were updated with a mean of 1.5 km, SD of 1.9 km, and maximum of 5.0 km, with larger updates and positioning uncertainty toward the ends of each fitted linear subsegment. Overall, for the segments with updated positioning, this resulted in a estimated mean accuracy of <2.5 km, which was determined based on the maximum positing change (from heading, velocity, or offset uncertainty) within the 10% misfit minimum between the scanned and modern (6) thickness data. The strength of this constraint is largely a function of ice-thickness relief within subsegment. Therefore, we note that greater positioning accuracies could be attainable using radargram misfits that exploit both bed and englacial layer geometries as more profile-based sounding data are collected or released. This release of archival radar scans includes both the original and updated positioning.
The absolute positioning of the film record can be further enhanced in the multitemporal comparison of specific ice-sheet features in one or more radar-sounding profile by identifying and analyzing distinctly interpretable features in the profiles. In these cases, the recorded SPRI navigation (or improved positioning) can be treated as an initial coarse location envelope within which specific features in the archival radargrams can be identified and analyzed at the inherent resolution of the profile (meters in range and 10s of meters in azimuth).
We demonstrate this approach with a FRIS basal channel (Fig. 9), which is a distinct feature, and can therefore be located precisely in the along-profile direction. As a result, the remaining cross-profile (along-channel) positioning error of 8 km (±4 km) would lead to a channel height estimate error of <∼2% if the apparent contemporary local along-flow height gradient of ∼0.5% km−1 inferred from surface altimetry was stable over the 40 y period of observation (25).
Similarly, for the TEIS (Fig. 10), we can overcome the fact that the 2009 radar-sounding profiles are not direct refights of the 1979 SPRI line by analyzing the distribution of ice thicknesses in the portion of the shelf that is interpreted to be floating (identified by basal crevassing and regrounding signatures in the sounding profiles and therefore insensitive to positioning uncertainty) rather than directly differencing profiles. We also use 2 profiles from 2009 (one of which crosses the SPRI survey near the grounding line and the other which crosses it near the regrounding point) to bound the lateral variability in ice-shelf thickness. This lateral variability results in an estimated uncertainty of 2–20 m between lines on a thinning signal of 115 m. In the future, direct refights of the SPRI lines (e.g., ref. 9) could result in much richer, less ambiguous observations of subsurface change.
The L1B OIB MCoRDS radargrams were obtained from the CReSIS, University of Kansas (26, 27) available for download from https://data.cresis.ku.edu/data/rds/.
Acknowledgments
The authors would like to thank the staff of the SPRI, University of Cambridge, especially Naomi Boneham, Lucy Martin, and Toby Benham as well as Jessica Daniel and Matthew Chalker for their assistance in accessing, scanning, and rearchiving the radar films. We also thank David Drewry for helping uncover the meaning of the CBD acronym. D.M.S. and E.J.M. were supported, in part, by an NSF CAREER Award. W.C. was supported, in part, by a grant from the NASA Cryospheric Sciences Program. M.R.S. was supported by the George Thompson Fellowship at Stanford University, a grant from the NASA Cryospheric Sciences Program.
Footnotes
The authors declare no conflict of interest.
This article is a PNAS Direct Submission.
Data deposition: All of the radargrams reported in the paper as well as the entire collection of the scanned radargrams are available on the persistent public Stanford Digital Repository (SDR) at doi.org/10.25740/ykq4-9345. This includes the original Scott Polar Research Institute (SPRI) flight-based metadata for latitude, longitude, ice thickness, and surface elevation––registered to Coded Binary Decimal (CBD) counter––where available with a reported 5-km positioning accuracy. This archive also includes our flight-based updated cross-correlation–based positioning––also registered to CBD––with estimated <2.5-km positioning accuracy. A more user-friendly interface to the scans and positioning data are also available at https://exhibits.stanford.edu/radarfilm.
This article contains supporting information online at www.pnas.org/lookup/suppl/doi:10.1073/pnas.1821646116/-/DCSupplemental.
References
- 1.Stocker T. F., et al. , Eds., IPCC, 2013: Climate Change 2013: The Physical Science Basis. Contribution of Working Group I to the Fifth Assessment Report of the Intergovernmental Panel on Climate Change (Cambridge University Press, Cambridge, United Kingdom and New York, NY, USA, 2013). [Google Scholar]
- 2.Scambos T. A., et al. , How much, how fast?: A science review and outlook for research on the instability of Antarctica’s Thwaites Glacier in the 21st century. Global Planet. Change 153, 16–34 (2017). [Google Scholar]
- 3.Paolo F. S., Fricker H. A., Padman L., Ice sheets. Volume loss from Antarctic ice shelves is accelerating. Science 348, 327–331 (2015). [DOI] [PubMed] [Google Scholar]
- 4.Rignot E., et al. , Four decades of Antarctic ice sheet mass balance from 1979-2017. Proc. Natl. Acad. Sci. U.S.A. 116, 1095–1103 (2019). [DOI] [PMC free article] [PubMed] [Google Scholar]
- 5.Dowdeswell J. A., Evans S., Investigations of the form and flow of ice sheets and glaciers using radio-echo sounding. Rep. Prog. Phys. 67, 1821–1861 (2004). [Google Scholar]
- 6.Fretwell P., et al. , Bedmap2: Improved ice bed, surface and thickness datasets for Antarctica. Cryosphere 6, 4305–4361 (2013). [Google Scholar]
- 7.Robin G. de Q., Drewry D. J., Meldrum D. T., International studies of ice sheet and bedrock. Philos. Trans. R. Soc. Lond. B Biol. Sci. 279, 185–196 (1977). [Google Scholar]
- 8.Drewry D. J., Jordan S. R., Jankowski E., Measured properties of the Antarctic ice sheet: Surface configuration, ice thickness, volume and bedrock characteristics. Ann. Glaciol. 3, 83–91 (1982). [Google Scholar]
- 9.Khazendar A., et al. , Rapid submarine ice melting in the grounding zones of ice shelves in West Antarctica. Nat. Commun. 7, 13243 (2016). [DOI] [PMC free article] [PubMed] [Google Scholar]
- 10.Chu W., et al. , Extensive winter subglacial water storage beneath the Greenland ice sheet. Geophys. Res. Lett. 43, 12,484–12,492 (2016). [Google Scholar]
- 11.Schroeder D. M., Hilger A. M., Paden J. D., Young D. A., Corr H. F. J., Ocean access beneath the southwest tributary of Pine Island Glacier, West Antarctica. Ann. Glaciol. 59, 10–15 (2017). [Google Scholar]
- 12.Bingham R. G., Siegert M. J., Radio-echo sounding over polar ice masses. J. Environ. Eng. Geophys. 12, 47–62 (2007). [Google Scholar]
- 13.Drewry D. J., Antarctica: Glaciological and Geophysical Folio (Scott Polar Research Institute, University of Cambridge, 1983). [Google Scholar]
- 14.Oswald G. K. A., Robin G. d. Q., Lakes beneath the Antarctic ice sheet. Nature 245, 251–254 (1973). [Google Scholar]
- 15.Siegert M. J., Ridley J. K., An analysis of the ice-sheet surface and subsurface topography above the Vostok Station subglacial lake, central East Antarctica. J. Geophys. Res. 103, 10195–10207 (1998). [Google Scholar]
- 16.Neil C. S., Radio echo determination of basal roughness characteristics on the Ross Ice Shelf. Ann. Glaciol. 3, 216–221 (1982). [Google Scholar]
- 17.Crabtree R. D., Doake C. S. M., Radio-Echo investigations of Ronne Ice Shelf. Ann. Glaciol. 8, 37–41 (1986). [Google Scholar]
- 18.Siegert M. J., Hodgkins R., Dowdeswell J. A., A chronology for the Dome C deep ice-core site through radio-echo layer correlation with the Vostok Ice Core, Antarctica. Geophys. Res. Lett. 25, 1019–1022 (1998). [Google Scholar]
- 19.Lythe M. B., Vaughan D. G., BEDMAP: A new ice thickness and subglacial topographic model of Antarctica. J. Geophys. Res. Solid Earth 106, 11335–11351 (2001). [Google Scholar]
- 20.Lough A. C., et al. , Seismic detection of an active subglacial magmatic complex in Marie Byrd Land, Antarctica. Nat. Geosci. 6, 1031–1035 (2013). [Google Scholar]
- 21.Bell R. E., et al. , Widespread persistent thickening of the East Antarctic ice sheet by freezing from the base. Science 331, 1592–1595 (2011). [DOI] [PubMed] [Google Scholar]
- 22.Siegert M. J., Dowdeswell J. A., Gorman M., McIntyre N. F., An inventory of Antarctic subglacial lakes. Antarct. Sci. 8, 281–286 (1996). [Google Scholar]
- 23.Durand G., Gagliardini O., Favier L., Zwinger T., le Meur E., Impact of bedrock description on modeling ice sheet dynamics. Geophys. Res. Lett. 38, L20501 (2011). [Google Scholar]
- 24.Tinto K. J., et al. , Ross Ice Shelf response to climate driven by the tectonic imprint on seafloor bathymetry. Nat. Geosci. 12, 441–449 (2019). [Google Scholar]
- 25.Le Brocq A. M., et al. , Evidence from ice shelves for channelized meltwater flow beneath the Antarctic ice sheet. Nat. Geosci. 6, 945–948 (2013). [Google Scholar]
- 26.Leuschen C., updated 2018. IceBridge MCoRDS L1B Geolocated Radar Echo Strength Profiles (Version 2, NASA National Snow and Ice Data Center Distributed Active Archive Center, Boulder, Colorado, 2014). https://nsidc.org/data/IRMCR1B/versions/2. Accessed 5 January 2018.
- 27.Leuschen C., Paden J., Gogineni P., Rodriguez-Morales F., Allen C., IceBridge MCoRDS L1B geolocated radar echo strength profiles, version 1 (NASA National Snow and Ice Data Center, Boulder, CO, 2011), IRMCR1B.
- 28.Tinto K. J., Bell R. E., Progressive unpinning of Thwaites Glacier from newly identified offshore ridge: Constraints from aerogravity. Geophys. Res. Lett. 38, L20503 (2011). [Google Scholar]
- 29.Mouginot J., Rignot E., Scheuchl B., Sustained increase in ice discharge from the Amundsen Sea Embayment, West Antarctica, from 1973 to 2013. Geophys. Res. Lett. 41, 1576–1584 (2014). [Google Scholar]
- 30.MacGregor J. A., Catania G. A., Markowski M. S., Andrews A. G., Widespread rifting and retreat of ice-shelf margins in the eastern Amundsen Sea Embayment between 1972 and 2011. J. Glaciol. 58, 458–466 (2011). [Google Scholar]
- 31.Schodlok M. P., Menemenlis D., Rignot E., Studinger M., Sensitivity of the ice-shelf/ocean system to the sub-ice-shelf cavity shape measured by NASA IceBridge in Pine Island Glacier, West Antarctica. Ann. Glaciol. 53, 156–162 (2012). [Google Scholar]
- 32.Rignot E., Jacobs S., Mouginot J., Scheuchl B., Ice-shelf melting around Antarctica. Science 341, 266–270 (2013). [DOI] [PubMed] [Google Scholar]
- 33.Depoorter M. A., et al. , Calving fluxes and basal melt rates of Antarctic ice shelves. Nature 502, 89–92 (2013). [DOI] [PubMed] [Google Scholar]
- 34.Jenkins A., et al. , West Antarctic ice sheet retreat in the Amundsen Sea driven by decadal oceanic variability. Nat. Geosci. 11, 733–738 (2018). [Google Scholar]
- 35.Schroeder D. M., et al. , Data from “Stanford-Cambridge radar film digitization project.” Stanford Digital Repository. 10.25740/ykq4-9345. Deposited 31 October 2018. [DOI]
- 36.Bailey J. T., Evans S., Robin G. de Q., Radio echo sounding of polar ice sheets. Nature 204, 420–421 (1964). [Google Scholar]
- 37.Evans S., Robin G. d. Q., Glacier depth-sounding from the air. Nature 210, 883–885 (1966). [Google Scholar]
- 38.Gudmandsen P., Layer echoes in polar ice sheets. J. Glaciol. 15, 95–101 (1975). [Google Scholar]
- 39.Dowdeswell J. A., Siegert M. J., The dimensions and topographic setting of Antarctic subglacial lakes and implications for large-scale water storage beneath continental ice sheets. Geol. Soc. Am. Bull. 111, 254–263 (1999). [Google Scholar]
- 40.Dowdeswell J. A., Siegert M. J., The physiography of modern Antarctic subglacial lakes. Global Planet. Change 35, 221–236 (2003). [Google Scholar]
- 41.Greenbaum J. S., et al. , Ocean access to a cavity beneath Totten Glacier in East Antarctica. Nat. Geosci. 8, 294–298 (2015). [Google Scholar]
- 42.Wrona T., et al. , Position and variability of complex structures in the central East Antarctic ice sheet. Geol. Soc. Spec. Publ. 461, 113–129 (2018). [Google Scholar]
- 43.Alley K. E., Scambos T. A., Siegfried M. R., Fricker H. A., Impacts of warm water on Antarctic ice shelf stability through basal channel formation. Nat. Geosci. 9, 290–293 (2016). [Google Scholar]


