

Abstract
Tumor necrosis factor receptor 2 (TNFR2) is a transmembrane receptor that promotes immune modulation and tissue regeneration and is recognized as a potential therapeutic target for multiple sclerosis (MS). However, TNFR2 also contributes to T effector cell function and macrophage-TNFR2 recently was shown to promote disease development in the experimental autoimmune encephalomyelitis (EAE) model of MS. We here demonstrate that systemic administration of a TNFR2 agonist alleviates peripheral and central inflammation, and reduces demyelination and neurodegeneration, indicating that protective signals induced by TNFR2 exceed potential pathogenic TNFR2-dependent responses. Our behavioral data show that systemic treatment of female EAE mice with a TNFR2 agonist is therapeutic on motor symptoms and promotes long-term recovery from neuropathic pain. Mechanistically, our data indicate that TNFR2 agonist treatment follows a dual mode of action and promotes both suppression of CNS autoimmunity and remyelination. Strategies based on the concept of exogenous activation of TNFR2 therefore hold great promise as a new therapeutic approach to treat motor and sensory disease in MS as well as other inflammatory diseases or neuropathic pain conditions.
Introduction
Tumor necrosis factor (TNF) is a master regulator of the immune system that initiates and orchestrates inflammation (Aggarwal, 2003). Elevated TNF levels have been associated with different autoimmune diseases, and deregulation of TNF expression and signaling can lead to chronic inflammation and tissue damage (Fischer and Maier, 2015). Therefore, anti-TNF therapeutics are clinically approved and successfully used to treat autoimmune diseases, such as rheumatoid arthritis, psoriasis, or inflammatory bowel disease (Monaco et al., 2015). Multiple sclerosis (MS) patients also show elevated levels of TNF at the site of active lesions and TNF levels correlate with the severity of the lesion (Hofman et al., 1989; Sharief and Hentges, 1991). However, two patients treated in an open-labeled phase I safety trial showed a transiently increased immune activation and disease activity after infusion of the anti-TNF infliximab (van Oosten et al., 1996). In addition, the “Lenercept” anti-TNF study, a phase II, randomized, multicenter, placebo-controlled study for the treatment of relapsing remitting MS failed (Group, 1999). Symptoms of Lenercept-treated patients were significantly increased compared with patients receiving placebo, and neurologic deficits tended to be more severe in the Lenercept treatment groups, indicating that TNF inhibition is contraindicative in MS. In addition, due to the unspecific immune inhibition, all approved anti-TNF therapeutics may induce severe side-effects such as increased susceptibility to serious infections, development of additional autoimmune or demyelinating diseases (Fischer et al., 2015; Monaco et al., 2015).
The severe side-effects of anti-TNF therapeutics in approved indications and the failure of the MS studies might be explained by the pleiotropic actions of TNF, including both pro- and anti-inflammatory functions as well as other immunoregulatory and regenerative activities. Recent research has revealed that TNF induces antithetic biological responses via its two receptors, TNF receptor (TNFR) 1 and TNFR2. Whereas TNFR1 signaling promotes inflammation and tissue degeneration, TNFR2 contributes to immune suppression as well as tissue homeostasis and neuroprotection (Fischer et al., 2015; Probert, 2015).
In particular, TNFR2 promotes expansion and stability of regulatory T cells (Tregs) (Chen et al., 2007; Chen et al., 2013), a subpopulation of lymphocytes with immune suppressive activity that control the development of autoimmune diseases. Indeed, deletion of Treg-TNFR2 was shown to exacerbate motor disease in experimental autoimmune encephalomyelitis (EAE) mice, indicating a role of Treg-TNFR2 in suppressing CNS autoimmunity (Atretkhany et al., 2018). TNFR2 signaling was also shown to induce protective and regenerative responses in the CNS, i.e. neuronal survival in an in vivo model of retinal ischemia (Fontaine et al., 2002) a nd remyelination in the cuprizone model of toxic demyelination and spontaneous remyelination (Arnett et al., 2001). Further, TNFR2−/− mice develop more severe EAE motor disease than wild type mice (Suvannavejh et al., 2000; Williams et al., 2014), and it was demonstrated that oligodendroglial-TNFR2 mediates remyelination in EAE (Madsen et al., 2016) and that genetic ablation of microglial TNFR2 leads to disease exacerbation (Gao et al., 2017). Therefore, in recent years, TNFR2 has emerged as a novel therapeutic target for MS.
However, next to its potential therapeutic effects via Tregs or CNS cells, TNFR2 can be expressed on activated T effector cells (Teffs) and was shown to act co-stimulatory for TCR-mediated T cell activation and effector function (Mehta et al., 2016; Ye et al., 2018). Other studies showed that monocyte/macrophage-TNFR2 contributes to EAE development (Gao et al., 2017). Therefore, in this study, we investigated the therapeutic potential and safety profile of exogenous TNFR2 activation in the EAE mouse model of MS. We determined that systemic administration of a TNFR2 agonist alleviated sensory and motor deficits in EAE, indicating that protective responses via Tregs and/or CNS-resident cells exceed potential pathogenic responses via Teffs or macrophages.
Materials and Methods
Materials
The production and characterization of the TNFR2 agonist EHD2-sc-mTNFR2 was described previously (Fischer et al., 2018). Fluorescence-labeled antibodies against CD3, CD25, CD68, MHC class II, and FoxP3 were from Miltenyi Biotech (Bergisch-Gladbach, Germany). Other antibodies included APP (Novus Biologicals, Littleton, CO), Iba1 (Wako Pure Chemicals, Osaka, Japan), CD3 (Novus Biologicals, Littleton, CO), FoxP3 (Abeam, Cambridge, UK), Human IgE (Novus Biologicals, NB7456) and TNF (HP8001, Hycult Biotech, The Netherlands). All other chemicals were of analytical grade.
Animals
Female C57BL/6 mice were purchased from the Jackson Laboratory (Bar Harbor, ME). Animals were housed in a virus/antigen free facility with a 12-hour light/dark cycle and unlimited access to water and food. All animal experiments were performed according to guidelines of the Institutional Animal Care and Use Committee (IACUC) of Drexel University under protocol numbers 20271/20617. All studies were conducted in accordance with the United States Public Health Service’s Policy on Humane Care and Use of Laboratory Animals. In all behavior studies animals were randomly assigned to groups. Behavior, tissue and cellular analysis were performed double-blinded with investigators being blinded to treatment and experimental groups.
Induction of experimental autoimmune encephalomyelitis and pharmacological treatment
Active EAE was induced with MOG35–55 peptide (Biosynthesis Inc.) as previously described (Brambilla et al., 2011). Clinical symptoms of EAE were assessed daily using a standard scale of 0–5 as follows: 0, no clinical signs; 1, loss of tail tone; 2, fully flaccid tail; 3, complete hind limb paralysis; 4, complete forelimb paralysis; 5, moribund or dead. Saline or EHD2-sc-mTNFR2 (10 mg/kg body weight) were administered i.p. 6, 9, and 12 (treatment onset of pain) or 16, 19, and 22 (treatment onset of motor disease) days post immunization (dpi). Onset of pain (6 dpi) was defined as the first day, where CFA-induced inflammatory pain was distinguishable from CFA/MOG-induced neuropathic pain. Onset of motor disease (16 dpi) was defined as the first day, when more than 50% of the immunized mice had reached a score of above 1.5 for at least one day.
Mechanical allodynia
Mechanical allodynia was determined using the Von Frey test as described previously with standardized Von Frey filaments ranging from 0.02 to 2 g (Dellarole et al., 2014). Investigations were performed by experimenters blinded to the surgery and the genotype or treatment. Mice were handled daily for at least 1 week prior to any behavioral analysis. To evaluate tactile sensitivity each mouse was placed individually on a wire mesh beneath a transparent plastic jar and habituated for 30 min before starting the behavioral test. Von Frey filaments (Touch-Test Sensory Evaluator) were applied to the plantar surface of each hind paw in a series of ascending forces (ranging between 0.02 g and 2 g) starting from the 0.4 g filament. A single trial of stimuli consisted of 5 applications of Von Frey filaments every minute perpendicularly to the plantar surface of the paw for about 4-5 s. To qualify a response to tactile stimulation as being painful, the mouse had to show cognitive awareness of pain. Therefore, at least one of the following cognitive responses had to coincide with a withdrawal response to a “painful” stimulation before it was considered a painful response and not a reflexive reaction: 1) avoidance behavior, 2) protecting the injured paw and 3) licking and/or looking at the injured paw. Depending on the positive or negative response, subsequent filaments were applied in order of descending or ascending intensity, respectively. If paw withdrawal occurred in response to the minimum 0.02 g filament, the next trial was performed with the same 0.02 g, cut-off filament. In case the maximum 2 g filament was reached with no response, the next trial was performed with the same 2 g, cut-off filament. Each test consisted of 6 trials. Paw movements associated with locomotion or weight-shifting were not counted as a response. The withdrawal threshold was expressed as the tolerance level in grams.
Flow cytometry
Mice were sacrificed at the times indicated in the figure legends, spleens were extracted, dissociated through a 40 μm cell strainer and collected in 10 ml MACS buffer (PBS, 0.5% BSA, 2 mM EDTA). Splenocytes were harvested by centrifugation (300 g, 5 min) and washed once with 10 ml MACS buffer. Then, expression of different immune cell markers was investigated by flow cytometry. Therefore, 106 splenocytes per staining were incubated for 20 min with fluorescence-labeled antibodies against surface antigens. Then cells were washed with MACS buffer by centrifugation (300 g, 5 min) and incubated for 30 minutes in fixation/permeabilization buffer (Miltenyi Biotech, Bergisch-Gladbach). Cells were washed with MACS buffer by centrifugation (300 g, 5 min), followed by another washing step with permeabilization buffer (Miltenyi Biotech, 300 g, 5 min) and incubation with fluorescence-labeled antibodies against intracellular antigens for 30 minutes. Cells were washed in permeabilization buffer (300 g, 5 min) and collected in MACS buffer. Data were acquired using a BD FACS Canto (BD Biosciences, San Jose, CA) and analyzed with FlowJo (TreeStar, Ashland, OR).
Tissue preparation for immunohistochemistry
Animals were perfused with 4% paraformaldehyde in 0.1 M phosphate-buffered saline. The lumbar part of the spinal cord was dehydrated with the Tissue-Tek VIP (Sakura, Nagano, Japan) and stored in paraffin. Paraffinized tissue was cut into 10 μm thick transverse sections with a rotary microtome (Microm HM325, BioTherm). 10 serial sections, taken at regular intervals to cover the whole spinal cord, were used per staining.
Luxol Fast Blue (LFB) staining
Tissue sections were deparaffinized and rehydrated to 95% ethanol with the Gemini AS (Thermo Scientific). Sections were incubated in the Luxol Fast Blue (LFB) staining solution overnight at 56°C in a water bath. Then sections were differentiated by immersion in lithium carbonate solution, dehydrated in ethanol and xylene. Sections were imaged using a light microscope and demyelinated areas were quantified using a scale ranging from 0 to 3 as described earlier (Williams et al., 2014). 0 – no demyelination; 1 – rare foci of demyelination; 2- a few foci of demyelination; and 3 – large (confluent) areas of demyelination.
Immunohistochemistry (IHC) antibody staining
Tissue sections were deparaffinized with the Gemini AS (Thermo Scientific). Then sections were incubated in 10 mM citric acid buffer for 20 minutes at 85°C in a water bath for antigen retrieval, washed three times for 5 minutes with TBS and blocked for 1 hour at room temperature (RT) with blocking buffer (0.05% BSA, 0.03% Triton-X100, TBS). Sections were incubated with primary antibodies diluted in blocking buffer and 5% NGS (normal goat serum) or NHS (normal horse serum) in a humidified chamber overnight at 4°C. The next day, sections were washed with TBS, incubated with secondary antibodies in blocking buffer and 5% NGS or NHS respectively (VECTASTAIN Elite ABC-HRP Kit) for 1 hour at RT and washed with TBS again. Thereafter, sections were incubated with ABC solution (Vector Laboratories) for 1 hour at RT, washed with TBS and then incubated with DAB or VIP solution (Vector Laboratories) for enzyme-mediated visualization of the antibody staining. Finally, the sections were washed with tap water, and dehydrated using the Gemini AS (Thermo Scientific). Sections were imaged using a light microscope and quantified using ImageJ Fiji (Schindelin et al., 2015).
RNA Isolation, cDNA Synthesis
Mice were sacrificed as indicated in the figure’s legend, perfused with PBS and the lumbar spinal cord was dissected. Total RNA was extracted using TRIzol Reagent (Thermo Fisher Scientific, Waltham, MA) according to the manufacturer’s instructions (Thermo Fisher Scientific). The A260/A280 ratio of the RNA was determined using a UV spectrophotometer (Nanodrop, Thermo Fisher Scientific). Equal concentrations of RNA samples with an A260/A280 ratio ranging from 1.8 to 2.0 were used for cDNA synthesis. RNA was retro-transcribed into cDNA with the AffinityScript QPCR cDNA Synthesis Kit and oligo(dT) primers (Agilent, Santa Clara, CA). The cDNA was preserved at −80°C until further use.
Quantitative real-time PCR
Gene expression was quantified by real-time PCR (qPCR; Rotor-Gene Q, Qiagen) using specific primers (ThermoFisher, Table 2) and the Brilliant III Ultra-Fast SYBR Green QPCR Master Mix (Agilent). To determine the expression of distinct genes ΔΔCt values were determined by correlating the obtained values to the house-keeping gene GAPDH. Data are presented relative to naive controls as normalized fold expression.
Table 2.
Overview Oligonucleotides for qPCR
| Gene | forward | reverse |
|---|---|---|
| ARG1 | 5’-TCTCTTCCATCACCTTGCCA-3’ | 5’-GGTGACTCCCTGCATATCTG-3’ |
| CCN3 | 5’-CTGCGAAAAGTGGACCTGTG-3’ | 5’-TTCAACTCCTACGGTGGCTT-3’ |
| CCR1 | 5’-GGGAAATGAGGGCTACAGGT-3’ | 5’-AGGGCCCGAACTGTTACTTT-3’ |
| CD40 | 5’-GACTCAGGCGAATTCTCAGC-3’ | 5’-GTGCAGTGTTGTCCTTCCTT-3’ |
| CSF1 | 5’-GGGTGTTGTCTTTAAAGCGC-3’ | 5’-GACTTCATGCCAGATTGCCT-3’ |
| FOXP3 | 5’-GCCATGGCAATAGTTCCTTC-3’ | 5’-CGAACATGCGAGTAAACCAA-3’ |
| GFAP | 5’-GTAGGTGGCGATCTCGATGT-3’ | 5’-AAGCCAAGCACGAAGCTAAC-3‘ |
| IBA1 | 5’-AGTAGCTGAACGTCTCCTCG-3’ | 5’-CCGTCCAAACTTGAAGCCTT-3’ |
| ICAM1 | 5’-CACGCTACCTCTGCTCCTG-3’ | 5’-AAGGCTTCTCTGGGATGGAT-3’ |
| IFNG | 5’-GCGTCATTGAATCACACCTG-3’ | 5’-CTGGACCTGTGGGTTGTTG-3’ |
| IL10 | 5’-AGAGAGCTCCATCATGCCTG-3’ | 5’-TGGGAAGTGGGTGCAGTTAT-3’ |
| IL17A | 5’-TCCAGAAGGCCCTCAGACTA-3’ | 5’-AGCATCTTCTCGACCCTGAA-3’ |
| IL1A | 5’-GGGCTGGTCTTCTCCTTGAG-3’ | 5’-ATGAAGCTCGTCAGGCAGAA-3’ |
| IL1B | 5’-GGAGCTCCTTAACATGCCCT-3’ | 5’-CCTCACAAGCAGAGCACAAG-3’ |
| IL4 | 5’-GGACTCATTCATGGTGCAGC-3’ | 5’-GTCTGTAGGGCTTCCAAGGT-3’ |
| IL6 | 5’-ACAAAGAAATGATGGATGCTACC-3‘ | 5’-TTCATGTACTCCAGGTAGCTATG-3’ |
| KC | 5’-CTTGACCCTGAAGCTCCCTT-3’ | 5’-GTTGTCAGAAGCCAGCGTTC-3’ |
| LY6G | 5’-CTGCCCCTTCTCTGATGGAT-3’ | 5’-CAGAGTAGTGGGGCAGATGG-3’ |
| MIP2 | 5’-AGACTCCAGCCACACTTCAG-3’ | 5’-GCATTGACAGCGCAGTTCA-3’ |
| MPO | 5’-GCCCGCATTCCTTGTTTTCT-3’ | 5’-GACCATGGCCCCTACAATCT-3’ |
| MRC1 | 5’-TTGTGGAGCAGATGGAAGGT-3’ | 5’-TCGTAGTCAGTGGTGGTTCC-3’ |
| NOS2 | 5’-GGAAGAAATGCAGGAGATGG-3’ | 5’-TGCAGGATGTCCTGAACGTA-3’ |
| TGFB1 | 5’-TGCGCTTGCAGAGATTAAAA-3’ | 5’-CGTCAAAAGACAGCCACTCA-3’ |
| TNF | 5’-CACTTGGTGGTTTGCTACGA-3’ | 5’-CCCCAAAGGGATGAGAAGTT-3’ |
Mouse T cell isolation, culture and flow cytometry
Splenocytes from C57BL/6 mice were isolated as previously described (Fischer et al., 2018). CD3+ T cells were isolated using the FACS Aria III. Purified T cells were activated using plate-bound αCD3 (5 μg/ml, 6 h at 4°C) in combination with soluble αCD28 (2 μg/ml) and IL-2 (100 U/ml) in 96-well (U form) plates with or without EHD2-sc-mTNFR2 in TexMACS medium (Miltenyi Biotech). After 5 days in culture, CD25+FoxP3+ Tregs were quantified by flow cytometry according to manufacturer’s instructions (Miltenyi Biotech, Bergisch-Gladbach). Data were acquired using a MACSQuant Analyzer 10 (Miltenyi) and analyzed with FlowJo (TreeStar, Ashland, OR).
EHD2-sc-mTNFR2-specific ELISA
ELISA plates (Nunc MaxiSorp) were coated with goat anti-Human IgE (Novus Biologicals, NB7456) at 1 μg/ml in PBS and incubated at 4°C overnight. Residual binding sites were blocked with 2% skim milk powder in PBS at RT for 2 hours. Tissue homogenates were diluted in 2% skim milk powder in PBS and incubated for 1 hour at RT. Purified EHD2-sc-mTNFR2 was diluted in 2% skim milk powder and used as a standard. Bound EHD2-sc-mTNFR2 was detected with rabbit polyclonal antibodies to mouse TNF (HP8001; 1 μg/ml; incubation for 1 hour at RT) and HRP-conjugated anti-rabbit IgG antibodies (diluted 1:10000; incubation for 1 hour at RT). Between each step, non-bound proteins were removed by washing 4 times with 0,005% Tween-20 in PBS.
Then, wells were incubated with TMB substrate solution and reaction was stopped by addition of 1 M H2SO4 and the absorbance at 450 nm was determined with an absorbance reader (Multiskan FC, Thermo Scientific, Karlsruhe, Germany) and data were analyzed using the software Microsoft Excel and GraphPad Prism (GraphPad, La Jolla, CA).
Multiplex Inflammation Assay
Blood was withdrawn from mice via heart puncture at the experimental end point described in the figure’s legend. Blood clotting was allowed for 30 min at room temperature and serum was separated by centrifugation for 20 min at 1,000 g. Serum was stored at −80°C until use. Concentration of 12 different cytokines was determined using the LEGENDplex mouse inflammation Panel (Biolegend) according to the manufacturer’s instructions. Samples were acquired using a BD FACS Canto (BD Biosciences) and analyzed using the LEGENDplex Software V8.0. Concentrations are presented relative to naive controls.
Primary oligodendrocyte cultures
Cortices from postnatal day 2-3 pups were isolated and dissociated into single cell suspensions with Papain Neural Tissue Dissociation Kit (Miltenyi Biotec). Platelet-derived growth factor receptor α-positive (PDGFRα+) oligodendrocyte progenitor cells (OPCs) were isolated by MACS separation using MS columns (Miltenyi Biotec) after incubation with CD140 (PDGFRα) magnetic microbeads (Miltenyi Biotec). PDGFRα+ cells were cultured on poly-D-lysine/laminin-coated 60 mm dishes in OPC medium consisting of DMEM/F12 supplemented with 1% N2, 2% B27, 0.01% BSA, 2.1 g/l NaHCO3, 1% penicillin/streptomycin, 20 ng/ml PDGF-AA, and 40 ng/ml FGF2. Purity of cultures was >97%, as determined by staining for PDGFRα.
OPC Proliferation Assay
OPCs were seeded onto poly-D-lysine/laminin-coated coverslips (Neuvitro) in a 24-well plate (19.000 cells/well) and stimulated with saline or EHD2-sc-mTNFR2 (200 ng/ml). Then, 5-ethynyl-2’-deoxyuridine (EdU) was added to the cultures for 8 hours and cells were fixed in 4% paraformaldehyde (PFA) for 15 minutes. EdU was detected using the click-it EdU imaging kit (Thermo Fisher). Nuclei were visualized using Hoechst staining.
Oligodendrocyte Differentiation Assay
OPCs were seeded onto poly-D-lysine/laminin-coated coverslips (Neuvitro) in a 24-well plate (19.000 cells/well) and cultured for 48 hours before switching to oligodendrocyte differentiation medium consisting of DMEM/F12 supplemented with 1% N2, 1% B27, 0.01% BSA, 2.1 g/l NaHCO3, 50 μg/ml insulin and 40 ng/ml triiodothyronine (T3). Cells were differentiated in presence of saline or EHD2-sc-mTNFR2 (200 ng/ml) to myelinating oligodendrocytes for 7 days before fixation in 4% PFA for 30 minutes. Myelination was assessed by staining with mouse anti-CC1 (1:500, Calbiochem) and ratanti-MBP (1:100, Millipore). Immunoreactivity was visualized with secondary species-specific fluorescent antibodies (Alexa Fluor 488 goat anti-rabbit and Alexa Fluor 594 goat anti-mouse, 1:500, Life Technologies). Nuclei were visualized using Hoechst staining. Oligodendrocyte differentiation was analyzed by assessing the percentage of myelinating MBP+ cells within the CC1+ population.
Statistics
Data are presented as mean ± standard error of the mean (SEM) of n animals. Normal distribution was analyzed by Shapiro-Wilk normality test. Statistical analyses were performed by Student’s t-test or analysis of variance, followed by a post hoc Tukey’s range test. A value of p < 0.05 was considered statistically significant.
Results
Exogenous activation of TNFR2 reduces motor and sensory disease
We and others have shown that female TNFR2−/− mice develop more severe EAE motor symptoms than wild type mice (Suvannavejh et al., 2000; Williams et al., 2014), indicating that TNFR2 contributes to suppression of EAE development. We therefore here investigated, whether exogenous activation of TNFR2 is therapeutic in female EAE mice. In this study, we focused on female mice, since in humans, females are approximately 3-times more likely to develop MS and chronic neuropathic pain is more prevalent in woman than men (Murphy et al., 2017). In addition to motor disease, approximately 60% of MS patients report the experience of chronic neuropathic pain (CNP), a chronic pain condition that is caused by a lesion of the somatosensory nervous system and dramatically reduces the quality of life of MS patients. CNP attacks often precede motor relapses and can be used as a treatment indication for MS patients (Murphy et al., 2017). We therefore used onset of neuropathic pain and motor disease as clinical indicators to initiate treatment. First, we compared pain sensitivity of mice immunized with CFA to immunization with MOG emulsified in CFA to distinguish between CFA-induced inflammatory and CFA/MOG-induced neuropathic pain. Mice immunized with CFA had significantly recovered 6 days post immunization (dpi), whereas MOG/CFA immunization resulted in chronic pain over the observation period of 25 dpi (Fig. 1A). We next treated mice immunized with CFA/MOG at 6, 9, and 12 dpi with saline or the TNFR2 agonist EHD2-sc-mTNFR2, using a dose (10 mg/kg) that was therapeutic in experimental arthritis (Fischer et al., 2018). Motor disease was scored, and disease-associated neuropathic pain was determined using the Von Frey test for mechanical allodynia over a period of 25 dpi. EHD2-sc-mTNFR2 treatment significantly ameliorated development of motor disease (Fig. 1B, Table 1), prevented weight loss after onset of motor symptoms (Fig. 1C) and delayed the day of onset of motor deficits (Fig. 1D). Further, treatment with the TNFR2 agonist significantly increased the paw withdrawal threshold in the Von Frey test, indicating TNFR2 agonist-mediated pain resolution (Fig. 1E). We then delayed EHD2-sc-mTNFR2 treatment until after onset of motor deficits (16, 19, and 22 dpi) and evaluated motor disease and disease-associated neuropathic pain. Again, TNFR2 agonist treatment significantly alleviated motor disease progression (Fig. 2A, Table 1) but had no impact on weight loss (Fig. 2B) and disease-associated pain (Fig. 2C).
Figure 1. Treatment after onset of pain alleviates mechanical allodynia and motor disease.
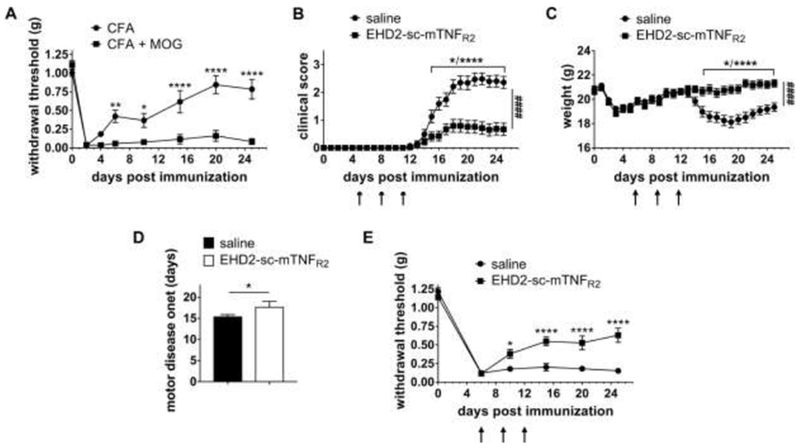
(A) Mice were immunized with CFA or MOG emulsified in CFA at day 0. Mechanical allodynia was determined using the Von Frey test over a period of 25 dpi (mean ± SEM, n=6 each group). (B-E) Mice were immunized with MOG emulsified in CFA and treated with saline or EHD2-sc-mTNFR2 (10 mg/kg) after onset of pain (6, 9 and 12 dpi). (B) Clinical scores and (C) weight were determined by observing the mice daily. (D) shows the first day with motor disease symptoms (saline: n=27, EHD2-sc-mTNFR2: n=28). (E) Mechanical allodynia was determined using the Von Frey test over a period of 25 dpi (mean ± SEM, saline: n=16, EHD2-sc-mTNFR2: n=23). *p<0.05, **p<0.01, ****p<0.0001; ####p<0.0001 (AUC)
Table 1.
Clinical Parameters of EAE
| Group | Incidence (%) | Day of onset, mean ± SEM | Cumulative Score | AUC (clinical score) |
|---|---|---|---|---|
| Treatment 6 dpi | ||||
| saline | 92.6% (25 of 27) | 15.48 ± 2.06 | 24.21 ± 12.42 | 23.03 ± 2.83 |
| EHD2-sc-mTNFR2 | 28.6% (8 of 28) | 17.75 ± 4.45 (*) | 7.68 ± 12.60 (****) | 7.344 ± 2.65 (****) |
| Treatment 16 dpi | ||||
| saline | 94.12% (16 of 17) | 16.25 ± 2.52 | 24.54 ± 10.88 | 23.21 ± 2.84 |
| EHD2-sc-mTNFR2 | 75.0% (12 of 16) | 16.23 ± 2.92 | 17.58 ± 12.39 (*) | 16.73 ± 2.86 (****) |
Figure 2. Treatment after onset of motor deficits alleviates motor disease but not mechanical allodynia.
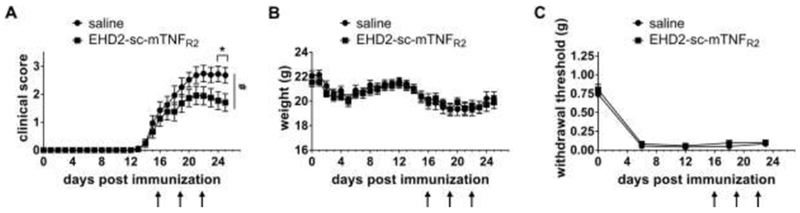
Mice were immunized with MOG emulsified in CFA and treated with saline or EHD2-sc-mTNFR2 (10 mg/kg) after onset of motor disease (16, 19 and 22 dpi). (A) Clinical scores and (B) weight were determined by observing the mice daily (mean ± SEM, saline: n=17, EHD2-sc-mTNFR2: n=16). (C) Mechanical allodynia was determined using the Von Frey test over a period of 23 days (mean ± SEM, n=10/group). *p<0.05; #p<0.05 (AUC)
TNFR2 agonist administration expands peripheral Treg levels, but does not impact macrophage activation
It has recently been shown that microglia and macrophage-TNFR2 have opposing functions in the pathogenesis of EAE. Whereas microglia-TNFR2 is neuroprotective, genetic deletion of macrophage-TNFR2 resulted in alleviated development of EAE motor disease, indicating that macrophage-TNFR2 contributes to disease development (Gao et al., 2017). In our studies we observed an immunization-dependent increase in the percentage of splenic CD68+ macrophages 14 dpi after both saline and EHD2-sc-mTNFR2 administration (Fig. 3A). Further, macrophage activation, measured by MHC class II expression, was not altered following administration of the TNFR2 agonist (Fig. 3A, 3B), indicating that systemic application of a TNFR2 agonist does not interfere with macrophage activity.
Figure 3. Exogenous TNFR2 activation does not impact macrophage activity but increased splenic Tregs.
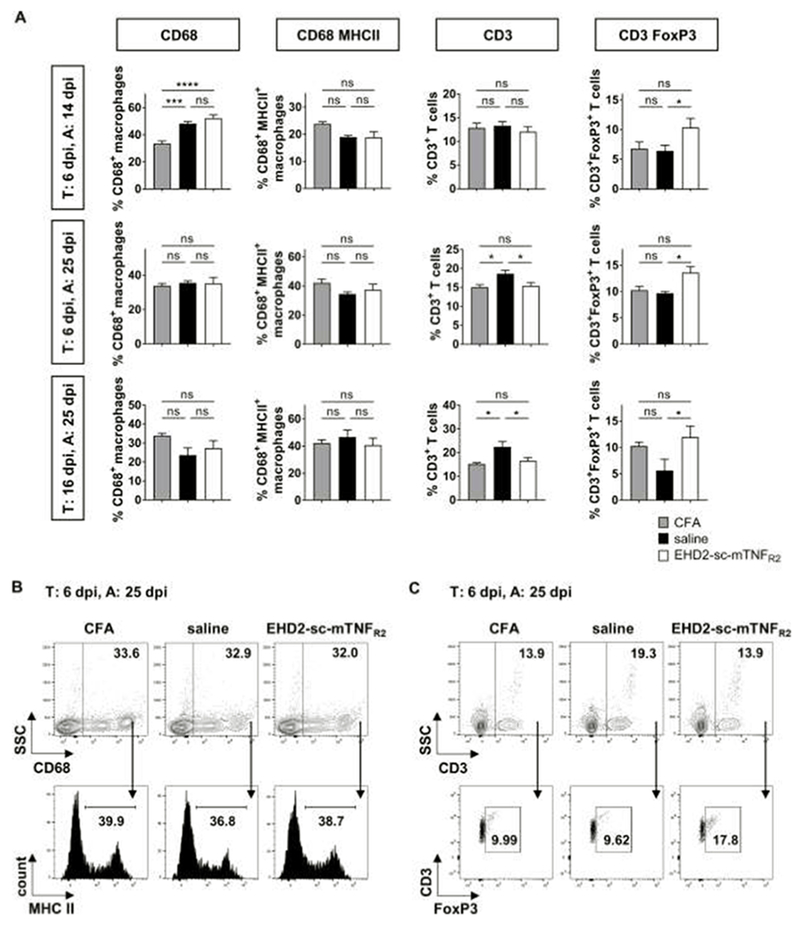
Mice were immunized with MOG emulsified in CFA and treated (T:) with saline or EHD2-sc-mTNFR2 (10 mg/kg) after onset of pain (6, 9 and 12 dpi) or onset of motor deficits (16, 19, 22 dpi). Mice were sacrificed, and immunity was analyzed (A:) 14 dpi or 25 dpi. Splenocytes were isolated and percentage of CD68+ macrophages, CD68+MHC II+ activated macrophages, CD3+ T cells and CD3+FoxP3+ Tregs were quantified by flow cytometry. (C) Shown are (A,B) the quantification of the flow cytometry data, and (C) representative dot plots and histograms for the experiment T: 6 dpi, A: 25 dpi (mean ± SEM, T: 6 dpi, A: 14 dpi: CFA: n=6, saline/EHD2-sc-mTNFR2: n=8 each; T: 6 dpi, A: 25 dpi: CFA: n=6, saline: n=6, EHD2-sc-mTNFR2: n=8 each; T: 16 dpi, A: 25 dpi: CFA: n=6, saline/EHD2-sc-mTNFR2: n=7 each) *p<0.05, ***p<0.001 ****p<0.0001, ns=not significant
We and others have previously shown that administration of a TNFR2 agonist induces peripheral Treg expansion (Chopra et al., 2016; Fischer et al., 2018). Indeed, we detected an increased percentage of splenic CD25+FoxP3+ Tregs in mice treated with EHD2-sc-mTNFR2 (Figs. 3A, 3C). The increase in peripheral immunosuppressive Tregs was accompanied by a decrease in expansion of splenic CD3+ T cells 25 dpi after treatment starting at onset of pain (6 dpi) and onset of motor deficits (16 dpi) (Figs. 3A, 3C), supporting that TNFR2 agonism suppresses autoimmunity. We then cultivated isolated CD3+ T cells with or without EHD2-sc-mTNFR2 and determined that TNFR2 agonism increases Treg numbers (Fig. 4), confirming our in vivo findings (Fig. 3) and published data (Chopra et al., 2016) that TNFR2 agonism induces proliferative expansion of Tregs.
Figure 4. Exogenous TNFR2 activation expands Tregs ex vivo.

CD3+ T cells were purified by FACS, activated using agonistic anti-CD3/anti-CD28 antibodies and incubated with or without EHD2-sc-mTNFR2 for 5 days. Treg expansion was an alyzed by determining the percentage and numbers of CD25+FoxP3+ Tregs after purification (day 0) and 5 days in culture by flow cytometry staining (mean ±SEM, n=5) *p<0.05, **p<0.01
TNFR2 agonist administration reduces peripheral and central inflammation
Having demonstrated that TNFR2 agonism induces immunosuppressive signals in the periphery, we characterized peripheral inflammation and measured the concentration of various pro-inflammatory cytokines in the serum 25 dpi. Compared to saline-treated mice, TNFR2 agonist treatment reduced upregulation of pro-inflammatory cytokines in the serum of mice, indicating that exogenous TNFR2 activation induces anti-inflammatory responses in the immune system. Effects were stronger, when EHD2-sc-mTNFR2 was administered at onset of pain (6 dpi) compared to onset of motor symptoms (16 dpi), representing the differences in therapeutic activity observed in the behavioral studies (Fig. 5A).
Figure 5. TNFR2-agonism alleviates peripheral inflammation.

Mice were immunized with MOG emulsified in CFA and treated (T:) with saline or EHD2-sc-mTNFR2 (10 mg/kg) after onset of pain (6, 9, 12 dpi) or onset of motor disease (16, 19 and 22 dpi). (A) Blood was withdrawn from mice 25 dpi. Concentration of 12 different cytokines in the serum was quantified using the LEGENDplex mouse inflammation panel. Results are presented as log-fold induction relative to CFA immunized mice (mean ± SEM, naïve/EHD2-sc-mTNFR2 (6 dpi): n=4, saline/EHD2-sc-mTNFR2 (16 dpi): n=3). (B) RNA was isolated from the lumbar spinal cord 25 dpi and gene expression of different pro- and anti-inflammatory genes was quantified by qPCR. Results were normalized to GAPDH and presented relative to CFA immunized mice; CFA/saline: n=2, EHD2-sc-mTNFR2: n=3 each. (C) Spinal cord sections were analyzed (A:) 14 or 25 dpi and Iba1+ macrophages/microglia were quantified by immunohistochemistry. Shown are (G-H) representative pictures and (I) quantified data presented as number of positive cells per section (mean ±SEM, n=5 per group/treatment) *p<0.05
Next, we analyzed the impact of TNFR2 agonist treatment on neuroinflammation. We profiled the gene expression of pro-inflammatory and anti-inflammatory mediators in the lumbar spinal cord by qPCR. Similar to the effects observed in the serum samples, EHD2-sc-mTNFR2 treatment resulted in decreased expression of pro-inflammatory genes (Fig. 5B). We then analyzed microglia activation / macrophage infiltration into the lumbar spinal cord by Iba1 immunohistochemistry staining. Treatment with EHD2-sc-mTNFR2 reduced the number of Iba1 cells when started at either 6 dpi or 16 dpi (Figs. 5C–5I).
TNFR2 agonist administration reduces T cell infiltration only if treatment is started at onset of pain
Since T cell infiltration into the CNS is recognized as a major driver of EAE/MS pathology that contributes to both development of motor disease as well as neuropathic pain (Hohlfeld and Steinman, 2017), we next investigated the impact of TNFR2 agonist treatment on infiltration of CD3+ T cells into the lumbar spinal cord. Infiltration of T cells into the spinal cord peaked at the onset of motor disease, evident by the highest numbers observed at 14 dpi (Figs. 6A, 6B, 6G). Whereas TNFR2 agonist treatment reduced the number of infiltrating CD3+ T cells if started at onset of pain (6 dpi), no effect was observed if treatment was delayed until after onset of motor deficits (16 dpi) (Figs. 6C–G). Since we observed an increase in splenic Tregs after TNFR2 agonist treatment, we next quantified infiltration of T regs into the lumbar spinal cord. Interestingly, we did not observe differences in the percentage of infiltrating FoxP3+ Tregs relative to the total number of infiltrating CD3+ T cells, between saline and EHD2-sc-mTNFR2-treated mice (Figs. 6H–6N).
Figure 6. Exogenous TNFR2 activation alleviates T cell infiltration into the spinal cord.

Mice were immunized with MOG emulsified in CFA and treated (T:) with saline or EHD2-sc-mTNFR2 (10 mg/kg) at onset of pain (6, 9, 12 dpi) or onset of motor disease (16, 19 and 22 dpi). Mice were sacrificed and analyzed (A:) 14 dpi or 25 dpi. (A-G) Numbers of infiltrating CD3+ T cells in the lumbar spinal cord were quantified by immunohistochemistry. Shown are (A-F) representative pictures and (G) quantified data presented as number of positive cells per section. (H-N) CNS-infiltrating FoxP3+ Tregs were quantified by immunohistochemistry. (H-M) Black arrows highlight representative FoxP3+ cells. (N) Quantification is shown as the percentage of FoxP3+ Tregs relative to the total number of CNS-infiltrating CD3+ T cells (mean ± SEM, n=5 per group/treatment). *p<0.05, ns=not significant
TNFR2 agonist administration reduces neurodegeneration and demyelination
Two major pathological hallmarks of EAE are demyelination and axonal damage. Therefore, we compared the histopathology of mice treated with EHD2-sc-mTNFR2 to mice treated with saline at 14 dpi and 25 dpi. Neurodegeneration was visualized by accumulation of amyloid-beta precursor protein (APP), a marker of axonal injury that is only detectable in axons with impaired axonal transport (Bjartmar and Trapp, 2003). Indeed, EHD2-sc-mTNFR2 administration 6 dpi resulted in a reduced number of APP+ axonal profiles compared to saline treated mice, indicating that TNFR2 agonist treatment reduced neurodegeneration. If treatment was started 16 dpi, a non-significant trend towards reduced neurodegeneration in the TNFR2 agonist treatment group was observed (Fig. 7A–7G). Further, TNFR2 agonist treatment started 6 dpi and 16 dpi resulted in significantly reduced spinal cord demyelination, as determined by analysis of LFB staining (Fig. 7H–7N).
Figure 7. Exogenous TNFR2 activation reduces neuroinflammation and demyelination.

Mice were immunized with MOG emulsified in CFA and treated (T:) with saline or EHD2-sc-mTNFR2 (10 mg/kg) after onset of pain (6, 9, 12 dpi) or onset of motor disease (16, 19 and 22 dpi). Mice were sacrificed and analyzed (A:) 14 dpi or 25 dpi. (A-G) Neurodegeneration was quantified using APP immunohistochemistry staining. Shown are (A-F) representative pictures and (G) quantified data presented as positive cells per section. (H-N) Demyelination was quantified using Luxol Fast Blue (LFB) staining. Shown are (H-M) representative pictures and (N) quantified data (mean ± SEM, n=5 per group/treatment) *p<0.05, **p<0.01
Selective stimulation of TNFR2 promotes OPC proliferation and differentiation
It was shown that TNFR2 has a protective role in EAE via microglia (Gao et al., 2017) and oligodendrocytes (Madsen et al., 2016) and directly protects neurons from cell death (Fischer et al., 2011). We therefore next analyzed whether EHD2-sc-mTNFR2 was transported into the CNS to promote neuroprotection via CNS-resident cells. Indeed, EHD2-sc-mTNFR2 was detected in the spinal cord after treatment start at 6 dpi. An increased average concentration of EHD2-sc-mTNFR2 was observed if treatment was started 16 dpi, a time when the blood-spinal cord-barrier is impaired (Fig. 8A), indicating that EHD2-sc-mTNFR2 can activate neuroprotective responses in CNS-resident cells if administered systemically after onset of motor deficits. A previous report showed that OPCs isolated from TNFR2−/− mice showed impaired differentiation into myelinating oligodendrocytes compared to WT OPCs. However, no impact of endogenous TNFR2 signaling was observed on OPC proliferation in this study (Madsen et al., 2016). In contrast to the previous study, we here demonstrate that exogenous activation of TNFR2 via EHD2-sc-mTNFR2 induces OPC proliferation (Fig. 8B) and increases differentiation of myelinating oligodendrocytes (Fig. 8C), indicating that systemically administered TNFR2 agonist therapy may induce remyelination.
Figure 8. Exogenous TNFR2 activation promotes OPC proliferation and differentiation.
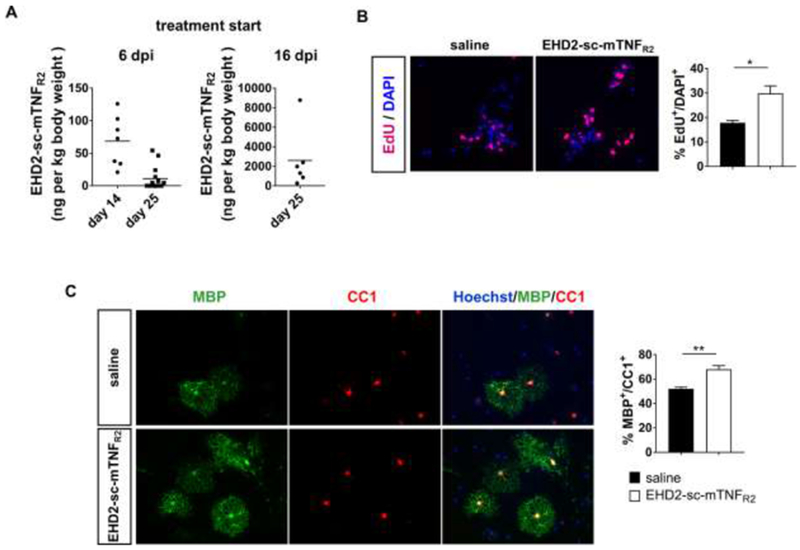
(A) Mice were immunized with MOG emulsified in CFA and treated with saline or EHD2-sc-mTNFR2 (10 mg/kg) after onset of pain (6, 9, 12 dpi) or onset of motor disease (16, 19 and 22 dpi). Mice were sacrificed 14 or 25 dpi. EHD2-sc-mTNFR2 concentration in the lumbar spinal cord was quantified by ELISA (mean ± SEM, 6 dpi/14 dpi: n=7, 6 dpi/25 dpi: n=14, 16 dpi/25 dpi: n=6). (B) OPCs were isolated and incubated in presence of saline or EHD2-sc-mTNFR2. OPC proliferation was assessed by measuring EdU incorporation. Shown are representative images of Edu and DAPI staining and the quantification of the Edu+/DAPI+ OPCs (mean ± SEM, n=3). (C) OPCs were cultivated in differentiation medium in presence of saline or EHD2-sc-mTNFR2 for 7 days. Cells were stained for CC1 and MBP and nuclei were visualized using Hoechst. Shown are representative pictures and the quantification of the myelinating MBP+ oligodendrocytes relative to the CC1+ oligodendrocytes (mean ± SEM, n=3). **p<0.01
Discussion
Our study demonstrates that pharmacological activation of TNFR2 alleviates motor disease and disease-associated neuropathic pain in the EAE model of MS. While it is well established that TNFR2 plays an important role for Treg function and neuroregeneration, other data indicate that TNFR2 signaling contributes to Teff function and macrophage-TNFR2 promotes EAE development. We here show that systemic application of a TNFR2 agonist at onset of pain (6 dpi) or at onset of motor deficits (16 dpi) reduces levels of pro-inflammatory cytokines and chemokines in the blood and the spinal cord. Further, both treatment strategies alleviate motor deficits and early treatment after onset of pain is also therapeutic on disease-associated neuropathic pain, indicating that protective responses induced by TNFR2 exceed potential pathogenic responses. This study emphasizes the important role of TNFR2 for immune modulation and tissue regeneration and highlights, why anti-TNF therapy might have failed in MS studies. We here further provide clinically important evidence that systemic administration of a TNFR2 agonist suppresses CNS autoimmunity and that TNFR2 agonists hold great promise as a novel drug class for MS.
TNFR2 promotes Treg activity and stability in the inflammatory environment (Chen et al., 2013; Chopra et al., 2016; Okubo et al., 2013) and expression levels of TNFR2 are correlated with the suppressive activity of Tregs (Chen et al., 2007; Chen et al., 2010). Indeed, deletion of Treg-TNFR2 was shown to exacerbate EAE motor disease, indicating that Treg-TNFR2 controls CNS autoimmunity (Atretkhany et al., 2018). In healthy individuals, Tregs can control potentially pathogenic autoreactive T cells, while Tregs in MS patients show insufficient regulatory abilities thereby allowing autoreactive T cells to become pathogenic (Kleinewietfeld and Hafler, 2014). Our data indicate that TNFR2 agonism expands Tregs in the periphery, whereas we did not see a difference in the percentage of Tregs infiltrating the spinal cord. This indicates that peripherally expanded Tregs might suppress autoimmunity, resulting in reduced infiltration of immune cells into the CNS and reduced neuroinflammation. Further T cell-intrinsic TNFR2 was shown to inhibit Th17 differentiation (Miller et al., 2015), indicating that TNFR2 agonism might interfere with Th17 cell differentiation. In line with this, we detected reduced levels of the Th17 cytokine IL-17A in the blood and spinal cord of EHD2-sc-mTNFR2-treated mice.
Next to its immunomodulatory role via Tregs, TNFR2 was shown to act co-stimulatory for TCR-mediated T cell activation, and survival and proliferative expansion of pathogenic Teff cells (Chen et al., 2016; Mehta et al., 2016;Ye et al., 2018), indicating that TNFR2 on Teffs may promote autoimmunity. It was further shown that genetic deletion of monocyte/macrophage-TNFR2 resulted in alleviated EAE motor disease, indicating that TNFR2 on monocytes/macrophages promotes EAE development (Gao et al., 2017). Our study shows that TNFR2 agonist administration at different disease stages does not promote detrimental Teff and/or macrophage activity. In contrast, impaired expansion of peripheral T lymphocytes, reduced infiltration of immune cells into the CNS, alleviated microglia activation, as well as reduced levels of pro-inflammatory cytokines in serum and spinal cord were detected after TNFR2 agonist treatment. This indicates that the TNFR2-mediated beneficial responses, e.g. via Tregs, neurons or glial cells, exceed potential pathogenic effects via Teffs and/or macrophages.
Next to its immunomodulatory role, TNFR2 was shown to induce protective and regenerative responses in the CNS. Particularly, specific activation of TNFR2 rescued neurons (Fischer et al., 2011) and oligodendrocytes (Maier et al., 2013) from oxidative stress-induced cell death and protected primary neurons from glutamate-induced excitotoxicity (Marchetti et al., 2004). Further, TNFR2 signaling promoted neuronal survival in an in vivo model of retinal ischemia (Fontaine et al., 2002). Interestingly, TNFR2−/− mice showed impaired remyelination in the cuprizone model of toxic demyelination and spontaneous remyelination (Arnett et al., 2001), indicating a critical role of TNFR2 for remyelination. Continuing studies demonstrated that astrocyte-TNFR2 contributes to myelination by inducing the secretion of neurotrophic factors that promote oligodendrocyte proliferation and differentiation (Fischer et al., 2014; Patel et al., 2012). Recently, it was demonstrated that oligodendroglial-TNFR2 contributes to remyelination in EAE (Madsen et al., 2016), indicating that intrinsic TNFR2 signaling in oligodendrocytes is also important for remyelination. Our study demonstrates that systemic TNFR2 agonist treatment at onset of pain (6 dpi) and onset of motor deficits (16 dpi) results in significantly reduced motor disease. Treatment at onset of pain (6 dpi) results in a strong reduction of the disease incidence (saline: 92.6%, EHD2-sc-mTNFR2: 28.6%) and delayed treatment after onset of motor deficits (16 dpi) still significantly alleviated motor disease. Histological analysis showed that both treatments (start at 6 dpi and 16 dpi) resulted in reduced demyelination. Interestingly, Tregs were recently shown to promote myelin regeneration in the CNS (Dombrowski et al., 2017). Future analysis will determine, if systemic TNFR2 agonist application may promote the remyelinating potential of Tregs. Further, our data indicate that TNFR2 agonist reaches the CNS after systemic administration and may promote remyelination via local TNFR2 activation on glial cells. Indeed, in vitro studies using TNFR2−/− OPCs showed that TNFR2 contributes to differentiation but not proliferation (Madsen et al., 2016). Here, we show that exogenous TNFR2 activation via EHD2-sc-mTNFR2 promotes both OPC proliferation as well as differentiation. We further recently demonstrated that local administration of a TNFR2 agonist prevents memory-loss in a mouse model of Alzheimer’s disease (Dong et al., 2016) and other studies have suggested a direct neuroprotective role of TNFR2 (Fischer and Maier, 2015; Orti-Casan et al., 2019; Pegoretti et al., 2018). Altogether, these data outline the high potential of TNFR2 agonists to promote regeneration in the CNS.
Furthermore, we identified an analgesic role of TNFR2, indicating thatTNFR2 agonists could impact both sensory and motor impairments in MS patients. It is now recognized that neuropathic pain is a serious concomitant of MS, with approximately 60% of the patients experiencing chronic pain symptoms. Even though the pathophysiology of neuropathic pain in EAE mice and MS patients still needs further investigation, the literature indicates that inflammation, demyelination and neurodegeneration are contributing factors (Murphy et al., 2017). Further, peripheral neuropathy is reported in both in MS patients and EAE mice and is suggested to be involved in neuropathic pain pathology. Many glycoproteins, such as MBP are expressed both in the CNS and PNS, indicating that autoimmunity attacks peripheral nerves (Itoyama et al., 1983; Wang et al., 2017). Indeed, T cell infiltration, glial activation and demyelination in peripheral nerves have been observed in EAE models (Duffy et al. , 2016; Thorburn et al., 2016; Wang et al., 2017). TNFR2 agonist treatment at onset of pain alleviated peripheral and central inflammation and reduced demyelination as well as neurodegeneration indicating the possibility of multiple cellular and molecular mechanisms. Interestingly, only treatment starting at onset of pain (6 dpi) resulted in alleviation of CNP, whereas delayed treatment at onset of motor disease (16 dpi) did not impact pain sensitivity. A critical observation was that in contrast to treatment at onset of pain, delayed treatment did not reduce infiltration of pathogenic T cells into the spinal cord. It was previously shown that T cell infiltration into the spinal cord is major contributor to neuropathic pain-like hypersensitivity (Costigan et al., 2009), indicating that abrogation of pathogenic T cell activity in the spinal cord is critical for the analgesic effect of TNFR2 agonism. Next to its protective effects in the spinal cord, TNFR2 agonism may also impact inflammation and demyelination of peripheral nerves. Therefore, it is possible that potential neuroprotective activities of TNFR2 in the PNS contribute to its analgesic effects. Further, a recent publication has shown that Tregs reduce pain in EAE via alleviation of neuroinflammation (Duffy et al., 2019). This is in line with our observation that TNFR2 agonism expands Tregs and may indicate that Treg-mediated effects contribute to the analgesic effect of EHD2-sc-mTNFR2.
In a model of peripheral nerve-injury mediated neuropathic pain, different immune cells mediated mechanical pain hypersensitivity in male and female mice. Whereas microglia were required for pain development in male mice, adaptive immune cells, like T cells mediated hypersensitivity in females (Sorge et al., 2015). Similar, a recent study proposed that tactile hypersensitivity in female EAE mice may be more immune-driven, whereas pain in male mice with EAE may rely more heavily on neurodegenerative and plasticity-related mechanisms (Catuneanu et al., 2019). This is in line with our data indicating that blocking T cell mediated neuroinflammation is therapeutic on female pain. It is still to be determined, whether a TNFR2 agonist is therapeutic in male EAE mice. Due to the pleiotropic neuroprotective actions of TNFR2, including anti-inflammatory responses via microglia (Gao et al., 2017; Veroni et al., 2010), we hypothesize that exogenous TNFR2 activation alleviates male pain as well.
Despite successful pre-clinical evaluation in rodent models of MS, unspecific anti-TNF therapy failed in clinical trials (Lenercept Study Group, 1999; van Oosten et al., 1996). Since then, subsequent pre-clinical studies demonstrated that only inhibition of sTNF/TNFRI signaling is therapeutic in EAE (Brambilla et al., 2011; Taoufik et al., 2011; Williams et al., 2018; Williams et al., 2014). Interestingly, the therapeutic effect of sTNF neutralization in EAE were dependent on presence of oligodendroglial TNFR2 (Madsen et al., 2016). Similar, using a model of Alzheimer’s disease, we recently showed that the therapeutic effect of TNFR1 neutralization is dependent on functional TNFR2 signaling (Dong et al., 2016). These data clearly indicate an essential neuroprotective role of TNFR2. Here, we confirm the safety of systemic TNFR2 activation in the inflammatory EAE model. Altogether our novel data and the published data on the opposing roles of TNFR1 and TNFR2 for neuroinflammation strengthen the development of novel therapeutic approaches to block either sTNF/TNFRI signaling or to activate TNFR2 signaling and suggest that selective modulation of TNFR signaling has superior clinical potential than conventional anti-TNF drugs.
In summary, our data demonstrate that TNFR2-mediated beneficial responses exceed potential pathogenic responses after exogenous TNFR2 agonist treatment. Importantly, TNFR2 agonists may follow a dual mode of action and induce autoimmune suppression via Tregs, as well as remyelination in the CNS. Our data support the neuroprotective role of TNFR2 and demonstrate the safety profile of TNFR2 agonists in EAE. We propose that TNFR2 agonists have great therapeutic potential for MS, may improve both motor disease and disease associated CNP and therefore advocate for future clinical trial with TNFR2 agonists in MS patients.
Highlights.
Systemic treatment of EAE mice with a TNFR2-selective TNF mutein promotes long-term recovery from neuropathic pain and improves motor disease
Systemic TNFR2 agonist therapy follows a dual mode of action in EAE: (1) suppression of CNS autoimmunity and (2) enhanced remyelination.
Compared to saline-treated mice, TNFR2 agonist-treated mice show reduced systemic and peripheral inflammation and reduced neuronal damage
TNFR2 agonism promotes Treg expansion and oligodendrocyte progenitor cell proliferation and differentiation in vitro
Acknowledgements:
We thank Fan Yang and Li Huang for animal care and Doris Göttsch for technical assistance. R.F. was supported by the German Research Foundation (FI 2138/1-1) and J.R.B. by Drexel DARE (Drexel Area of Research Excellence) and a grant from the National Institutes of Health (NINDS R01NS051709-14). R.D. was supported by the German Research Foundation (FOR 2289). U.L.M.E. was supported by the Dutch MS Foundation (15 – 898 MS).
Footnotes
Publisher's Disclaimer: This is a PDF file of an unedited manuscript that has been accepted for publication. As a service to our customers we are providing this early version of the manuscript. The manuscript will undergo copyediting, typesetting, and review of the resulting proof before it is published in its final citable form. Please note that during the production process errors may be discovered which could affect the content, and all legal disclaimers that apply to the journal pertain.
Competing Interest
R.F., V.B.R. and J.R.B. are named inventors on patent applications covering the use of TNFR2 agonists for neuropathic pain. R.F., R.E.K. and K.P. are named inventors on patent applications covering the TNFR2 agonists technology.
References
- Aggarwal BB, 2003. Signalling pathways of the TNF superfamily: a double-edged sword. Nat Rev Immunol 3, 745–756. [DOI] [PubMed] [Google Scholar]
- Arnett HA, Mason J, Marino M, Suzuki K, Matsushima GK, Ting JP, 2001. TNF alpha promotes proliferation of oligodendrocyte progenitors and remyelination. Nat Neurosci 4, 1116–1122. [DOI] [PubMed] [Google Scholar]
- Atretkhany KN, Mufazalov IA, Dunst J, Kuchmiy A, Gogoleva VS, Andruszewski D, Drutskaya MS, Faustman DL, Schwabenland M, Prinz M, Kruglov AA, Waisman A, Nedospasov SA, 2018. Intrinsic TNFR2 signaling in T regulatory cells provides protection in CNS autoimmunity. Proc Natl Acad Sci U S A 115, 13051–13056. [DOI] [PMC free article] [PubMed] [Google Scholar]
- Bjartmar C, Trapp BD, 2003. Axonal degeneration and progressive neurologic disability in multiple sclerosis. Neurotox Res 5, 157–164. [DOI] [PubMed] [Google Scholar]
- Brambilla R, Ashbaugh JJ, Magliozzi R, Dellarole A, Karmally S, Szymkowski DE, Bethea JR, 2011. Inhibition of soluble tumour necrosis factor is therapeutic in experimental autoimmune encephalomyelitis and promotes axon preservation and remyelination. Brain 134, 2736–2754. [DOI] [PMC free article] [PubMed] [Google Scholar]
- Catuneanu A, Paylor JW, Winship I, Colbourne F, Kerr BJ, 2019. Sex differences in central nervous system plasticity and pain in experimental autoimmune encephalomyelitis. Pain 160, 1037–1049. [DOI] [PubMed] [Google Scholar]
- Chen X, Baumel M, Mannel DN, Howard OM, Oppenheim JJ, 2007. Interaction of TNF with TNF receptor type 2 promotes expansion and function of mouse CD4+CD25+ T regulatory cells. J Immunol 179, 154–161. [DOI] [PubMed] [Google Scholar]
- Chen X, Nie Y, Xiao H, Bian Z, Scarzello AJ, Song NY, Anna TL, Yang D, Oppenheim JJ, 2016. TNFR2 expression by CD4 effector T cells is required to induce full-fledged experimental colitis. Sci Rep 6, 32834. [DOI] [PMC free article] [PubMed] [Google Scholar]
- Chen X, Subleski JJ, Hamano R, Howard OM, Wiltrout RH, Oppenheim JJ, 2010. Co-expression of TNFR2 and CD25 identifies more of the functional CD4+FOXP3+ regulatory T cells in human peripheral blood. Eur J Immunol 40, 1099–1106. [DOI] [PMC free article] [PubMed] [Google Scholar]
- Chen X, Wu X, Zhou Q, Howard OM, Netea MG, Oppenheim JJ, 2013. TNFR2 is critical for the stabilization of the CD4+Foxp3+ regulatory T. cell phenotype in the inflammatory environment. J Immunol 190, 1076–1084. [DOI] [PMC free article] [PubMed] [Google Scholar]
- Chopra M, Biehl M, Steinfatt T, Brandl A, Kums J, Amich J, Vaeth M, Kuen J, Holtappels R, Podlech J, Mottok A, Kraus S, Jordan-Garrote AL, Bauerlein CA, Brede C, Ribechini E, Fick A, Seher A, Polz J, Ottmuller KJ, Baker J, Nishikii H, Ritz M, Mattenheimer K, Schwinn S, Winter T, Schafer V, Krappmann S, Einsele H, Muller TD, Reddehase MJ, Lutz MB, Mannel DN, Berberich-Siebelt F, Wajant H, Beilhack A, 2016. Exogenous TNFR2 activation protects from acute GvHD via host T reg cell expansion. J Exp Med 213, 1881–1900. [DOI] [PMC free article] [PubMed] [Google Scholar]
- Costigan M, Moss A, Latremoliere A, Johnston C, Verma-Gandhu M, Herbert TA, Barrett L, Brenner GJ, Vardeh D, Woolf CJ, Fitzgerald M, 2009. T-cell infiltration and signaling in the adult dorsal spinal cord is a major contributor to neuropathic pain-like hypersensitivity. J Neurosci 29, 14415–14422. [DOI] [PMC free article] [PubMed] [Google Scholar]
- Dellarole A, Morton P, Brambilla R, Walters W, Summers S, Bernardes D, Grilli M, Bethea JR, 2014. Neuropathic pain-induced depressive-like behavior and hippocampal neurogenesis and plasticity are dependent on TNFR1 signaling. Brain Behav Immun 41, 65–81. [DOI] [PMC free article] [PubMed] [Google Scholar]
- Dombrowski Y, O’Hagan T, Dittmer M, Penalva R, Mayoral SR, Bankhead P, Fleville S, Eleftheriadis G, Zhao C, Naughton M, Hassan R, Moffat J, Falconer J, Boyd A, Hamilton P, Allen IV, Kissenpfennig A, Moynagh PN, Evergren E, Perbal B, Williams AC, Ingram RJ, Chan JR, Franklin RJM, Fitzgerald DC, 2017. Regulatory T cells promote myelin regeneration in the central nervous system. Nat Neurosci 20, 674–680. [DOI] [PMC free article] [PubMed] [Google Scholar]
- Dong Y, Fischer R, Naude PJ, Maier O, Nyakas C, Duffey M, Van der Zee EA, Dekens D, Douwenga W, Herrmann A, Guenzi E, Kontermann RE, Pfizenmaier K, Eisel UL, 2016. Essential protective role of tumor necrosis factor receptor 2 in neurodegeneration. Proc Natl Acad Sci U S A 113, 12304–12309. [DOI] [PMC free article] [PubMed] [Google Scholar]
- Duffy SS, Keating BA, Perera CJ, Lees JG, Tonkin RS, Makker PGS, Carrive P, Butovsky O, Moalem-Taylor G, 2019. Regulatory T cells and their derived cytokine, interleukin-35, reduce pain in experimental autoimmune encephalomyelitis. J Neurosci. [DOI] [PMC free article] [PubMed] [Google Scholar]
- Duffy SS, Perera CJ, Makker PG, Lees JG, Carrive P, Moalem-Taylor G, 2016. Peripheral and Central Neuroinflammatory Changes and Pain Behaviors in an Animal Model of Multiple Sclerosis. Front Immunol 7, 369. [DOI] [PMC free article] [PubMed] [Google Scholar]
- Fischer R, Kontermann R, Maier O, 2015. Targeting sTNF/TNFR1 Signaling as a New Therapeutic Strategy. Antibodies 4, 48–70. [Google Scholar]
- Fischer R, Maier O, 2015. Interrelation of oxidative stress and inflammation in neurodegenerative disease: role of TNF. Oxid Med Cell Longev 2015, 610813. [DOI] [PMC free article] [PubMed] [Google Scholar]
- Fischer R, Maier O, Siegemund M, Wajant H, Scheurich P, Pfizenmaier K, 2011. A TNF receptor 2 selective agonist rescues human neurons from oxidative stress-induced cell death. PLoS One 6, e27621. [DOI] [PMC free article] [PubMed] [Google Scholar]
- Fischer R, Proske M, Duffey M, Stangl H, Martinez GF, Peters N, Kraske A, Straub RH, Bethea JR, Kontermann RE, Pfizenmaier K, 2018. Selective activation of tumor necrosis factor receptor 2 induces anti-inflammatory responses and alleviates experimental arthritis. Arthritis Rheumatol. [DOI] [PubMed] [Google Scholar]
- Fischer R, Wajant H, Kontermann R, Pfizenmaier K, Maier O, 2014. Astrocyte-specific activation of TNFR2 promotes oligodendrocyte maturation by secretion of leukemia inhibitory factor. Glia 62, 272–283. [DOI] [PubMed] [Google Scholar]
- Fontaine V, Mohand-Said S, Hanoteau N, Fuchs C, Pfizenmaier K, Eisel U, 2002. Neurodegenerative and neuroprotective effects of tumor Necrosis factor (TNF) in retinal ischemia: opposite roles of TNF receptor 1 and TNF receptor 2. J Neurosci 22, RC216. [DOI] [PMC free article] [PubMed] [Google Scholar]
- Gao H, Danzi MC, Choi CS, Taherian M, Dalby-Hansen C, Ellman DG, Madsen PM, Bixby JL, Lemmon VP, Lambertsen KL, Brambilla R, 2017. Opposing Functions of Microglial and Macrophagic TNFR2 in the Pathogenesis of Experimental Autoimmune Encephalomyelitis. Cell Rep 18, 198–212. [DOI] [PMC free article] [PubMed] [Google Scholar]
- Group LS, 1999. TNF neutralization in MS: results of a randomized, placebo-controlled multicenter study. The Lenercept Multiple Sclerosis Study Group and The University of British Columbia MS/MRI Analysis Group. Neurology 53, 457–465. [PubMed] [Google Scholar]
- Hofman FM, Hinton DR, Johnson K, Merrill JE, 1989. Tumor necrosis factor identified in multiple sclerosis brain. J Exp Med 170, 607–612. [DOI] [PMC free article] [PubMed] [Google Scholar]
- Hohlfeld R, Steinman L, 2017. T Cell-Transfer Experimental Autoimmune Encephalomyelitis: Pillar of Multiple Sclerosis and Autoimmunity. J Immunol 198, 3381–3383. [DOI] [PubMed] [Google Scholar]
- Itoyama Y, Webster HD, Richardson EP Jr., Trapp BD, 1983. Schwann cell remyelination of demyelinated axons in spinal cord multiple sclerosis lesions. Ann Neurol 14, 339–346. [DOI] [PubMed] [Google Scholar]
- Kleinewietfeld M, Hafler DA, 2014. Regulatory T cells in autoimmune neuroinflammation. Immunol Rev 259, 231–244. [DOI] [PMC free article] [PubMed] [Google Scholar]
- Madsen PM, Motti D, Karmally S, Szymkowski DE, Lambertsen KL, Bethea JR, Brambilla R, 2016. Oligodendroglial TNFR2 Mediates Membrane TNF-Dependent Repair in Experimental Autoimmune Encephalomyelitis by Promoting Oligodendrocyte Differentiation and Remyelination. J Neurosci 36, 5128–5143. [DOI] [PMC free article] [PubMed] [Google Scholar]
- Maier O, Fischer R, Agresti C, Pfizenmaier K, 2013. TNF receptor 2 protects oligodendrocyte progenitor cells against oxidative stress. Biochem Biophys Res Commun 440, 336–341. [DOI] [PubMed] [Google Scholar]
- Marchetti L, Klein M, Schlett K, Pfizenmaier K, Eisel UL, 2004. Tumor necrosis factor (TNF)-mediated neuroprotection against glutamate-induced excitotoxicity is enhanced by N-methyl-D-aspartate receptor activation. Essential role of a TNF receptor 2-mediated phosphatidylinositol 3-kinase-dependent NF-kappa B pathway. J Biol Chem 279, 32869–32881. [DOI] [PubMed] [Google Scholar]
- Mehta AK, Gracias DT, Croft M, 2016. TNF activity and T cells. Cytokine. [DOI] [PMC free article] [PubMed] [Google Scholar]
- Miller PG, Bonn MB, McKarns SC, 2015. Transmembrane TNF-TNFR2 Impairs Th17 Differentiation by Promoting Il2 Expression. J Immunol 195, 2633–2647. [DOI] [PMC free article] [PubMed] [Google Scholar]
- Monaco C, Nanchahal J, Taylor P, Feldmann M, 2015. Anti-TNF therapy: past, present and future. Int Immunol 27, 55–62. [DOI] [PMC free article] [PubMed] [Google Scholar]
- Murphy KL, Bethea JR, Fischer R, 2017. Neuropathic Pain in Multiple Sclerosis-Current Therapeutic Intervention and Future Treatment Perspectives In: Zagon IS, McLaughlin PJ (Eds.), Multiple Sclerosis: Perspectives in Treatment and Pathogenesis, Brisbane (AU). [PubMed] [Google Scholar]
- Okubo Y, Mera T, Wang L, Faustman DL, 2013. Homogeneous expansion of human T-regulatory cells via tumor necrosis factor receptor 2. Sci Rep 3, 3153. [DOI] [PMC free article] [PubMed] [Google Scholar]
- Orti-Casan N, Wu Y, Naude PJW, De Deyn PP, Zuhorn IS, Eisel ULM, 2019. Targeting TNFR2 as a Novel Therapeutic Strategy for Alzheimer’s Disease. Front Neurosci 13, 49. [DOI] [PMC free article] [PubMed] [Google Scholar]
- Patel JR, Williams JL, Muccigrosso MM, Liu L, Sun T, Rubin JB, Klein RS, 2012. Astrocyte TNFR2 is required for CXCL12-mediated regulation of oligodendrocyte progenitor proliferation and differentiation within the adult CNS. Acta Neuropathol 124, 847–860. [DOI] [PMC free article] [PubMed] [Google Scholar]
- Pegoretti V, Baron W, Laman JD, Eisel ULM, 2018. Selective Modulation of TNF-TNFRs Signaling: Insights for Multiple Sclerosis Treatment. Front Immunol 9, 925. [DOI] [PMC free article] [PubMed] [Google Scholar]
- Probert L, 2015. TNF and its receptors in the CNS: The essential, the desirable and the deleterious effects. Neuroscience 302, 2–22. [DOI] [PubMed] [Google Scholar]
- Schindelin J, Rueden CT, Hiner MC, Eliceiri KW, 2015. The ImageJ ecosystem: An open platform for biomedical image analysis. Mol Reprod Dev 82, 518–529. [DOI] [PMC free article] [PubMed] [Google Scholar]
- Sharief MK, Hentges R, 1991. Association between tumor necrosis factor-alpha and disease progression in patients with multiple sclerosis. N Engl J Med 325, 467–472. [DOI] [PubMed] [Google Scholar]
- Sorge RE, Mapplebeck JC, Rosen S, Beggs S, Taves S, Alexander JK, Martin LJ, Austin JS, Sotocinal SG, Chen D, Yang M, Shi XQ, Huang H, Pillon NJ, Bilan PJ, Tu Y, Klip A, Ji RR, Zhang J, Salter MW, Mogil JS, 2015. Different immune cells mediate mechanical pain hypersensitivity in male and female mice. Nat Neurosci 18, 1081–1083. [DOI] [PMC free article] [PubMed] [Google Scholar]
- Suvannavejh GC, Lee HO, Padilla J, Dal Canto MC, Barrett TA, Miller SD, 2000. Divergent roles for p55 and p75 tumor necrosis factor receptors in the pathogenesis of MOG(35–55)-induced experimental autoimmune encephalomyelitis. Cell Immunol 205, 24–33. [DOI] [PubMed] [Google Scholar]
- Taoufik E, Tseveleki V, Chu SY, Tselios T, Karin M, Lassmann H, Szymkowski DE, Probert L, 2011. Transmembrane tumour necrosis factor is neuroprotective and regulates experimental autoimmune encephalomyelitis via neuronal nuclear factor-kappaB. Brain 134, 2722–2735. [DOI] [PubMed] [Google Scholar]
- Thorburn KC, Paylor JW, Webber CA, Winship IR, Kerr BJ, 2016. Facial hypersensitivity and trigeminal pathology in mice with experimental autoimmune encephalomyelitis. Pain 157, 627–642. [DOI] [PubMed] [Google Scholar]
- van Oosten BW, Barkhof F, Truyen L, Boringa JB, Bertelsmann FW, von Blomberg BM, Woody JN, Hartung HP, Polman CH, 1996. Increased MRI activity and immune activation in two multiple sclerosis patients treated with the monoclonal anti-tumor necrosis factor antibody cA2. Neurology 47, 1531–1534. [DOI] [PubMed] [Google Scholar]
- Veroni C, Gabriele L, Canini I, Castiello L, Coccia E, Remoli ME, Columba-Cabezas S, Arico E, Aloisi F, Agresti C, 2010. Activation of TNF receptor 2 in microglia promotes induction of anti-inflammatory pathways. Mol Cell Neurosci 45, 234–244. [DOI] [PubMed] [Google Scholar]
- Wang IC, Chung CY, Liao F, Chen CC, Lee CH, 2017. Peripheral sensory neuron injury contributes to neuropathic pain in experimental autoimmune encephalomyelitis. Sci Rep 7, 42304. [DOI] [PMC free article] [PubMed] [Google Scholar]
- Williams SK, Fairless R, Maier O, Liermann PC, Pichi K, Fischer R, Eisel ULM, Kontermann R, Herrmann A, Weksler B, Romero N, Couraud PO, Pfizenmaier K, Diem R, 2018. Anti-TNFRI targeting in humanized mice ameliorates disease in a model of multiple sclerosis. Sci Rep 8, 13628. [DOI] [PMC free article] [PubMed] [Google Scholar]
- Williams SK, Maier O, Fischer R, Fairless R, Hochmeister S, Stojic A, Pick L, Haar D, Musiol S, Storch MK, Pfizenmaier K, Diem R, 2014. Antibody-mediated inhibition of TNFR1 attenuates disease in a mouse model of multiple sclerosis. PLoS One 9, e90117. [DOI] [PMC free article] [PubMed] [Google Scholar]
- Ye LL, Wei XS, Zhang M, Niu YR, Zhou Q, 2018. The Significance of Tumor Necrosis Factor Receptor Type II in CD8(+) Regulatory T Cells and CD8(+) Effector T Cells. Front Immunol 9, 583. [DOI] [PMC free article] [PubMed] [Google Scholar]