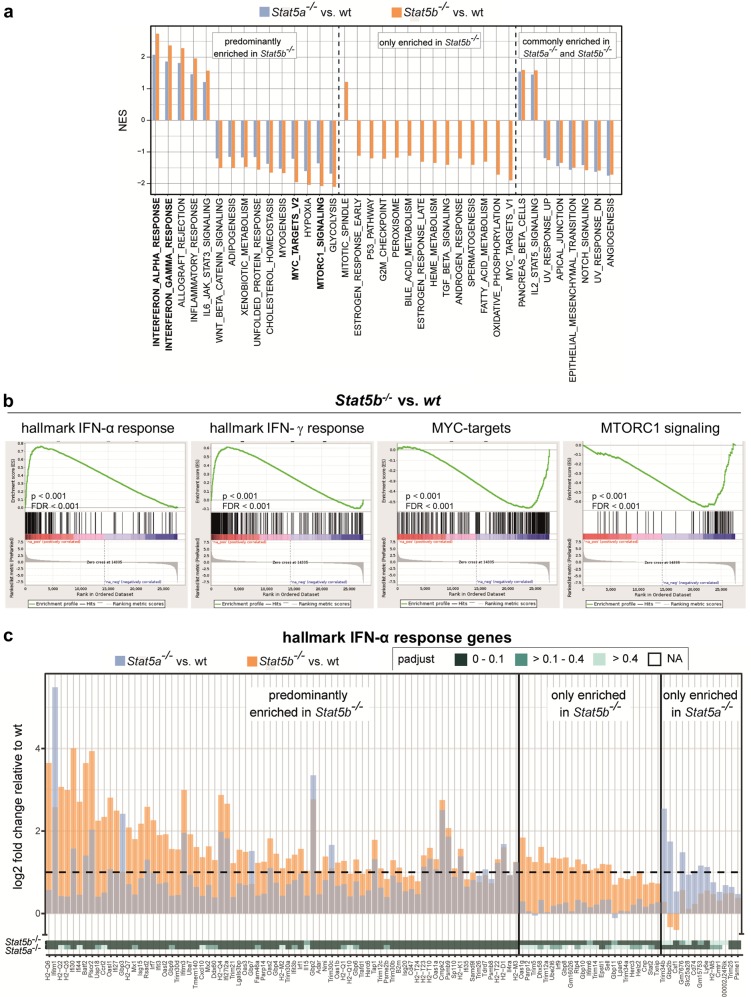
Fig. 4.
STAT5B suppresses interferon responses in BCR/ABL+ cells. RNA-seq analysis was performed on BCR/ABLp185+ cell lines derived from wt, Stat5a−/− and Stat5b−/− mice. a Significantly (NES >1, FDR <0.25) enriched hallmark gene sets obtained from GSEA of log 2 fold-change ranked gene lists from differential expression analysis of Stat5b−/− (vs. wt) and Stat5a−/− (vs. wt) BCR/ABLp185+ cell lines. Gene sets more enriched in Stat5b−/− (left panel), only enriched in Stat5b−/− (middle panel), and equally enriched in Stat5b−/− and Stat5a−/− (right panel) are shown. b Enrichment plots of the hallmark IFN-α response gene set from GSEA above and additional GSEA of differentially regulated genes between Stat5b−/− and Stat5a−/− BCR/ABLp185+ cell lines. c The change in expression levels of genes that contribute to core enrichment of the hallmark IFN-α response gene set in Stat5b−/− (orange) and Stat5a−/− (blue) BCR/ABLp185+ cell lines relative to wt BCR/ABLp185+ cell lines and the significance of this change (p-adjust, see legend) is shown. IFN interferon, STAT signal transducers and activators of transcription, wt wild type, NES normalized enrichment score, GSEA gene set enrichment analysis, p-adjust Benjamin–Hochbert corrected p value, FDR false discovery rate

