Fig. 1.
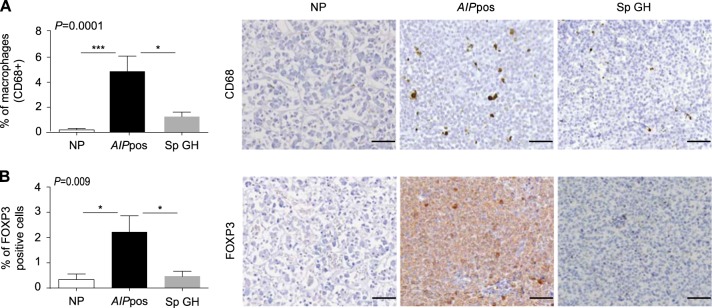
Alterations of the components of the tumor microenvironment in AIPpos tumors. Immunohistochemical analyses of CD68 and FOXP3 in AIP-mutation-positive human somatotroph adenomas (AIPpos), sporadic somatotroph adenomas (Sp GH), and normal pituitaries. Graphs on the left are showing the percentage of CD68 (a) and FOXP3 (b) positive cells per high-power magnification field, counted on 3–5 random fields at ×400. Plotted data were expressed as mean ± SEM. Statistical analysis was performed using Kruskal–Wallis test followed by Conover–Inman test for individual comparisons; significance between groups are marked as *, <0.05, ***, <0.001. Representative images (right panels) show more CD68 (macrophages) and FOXP3-positive (T-reg) cells in AIPpos tumors compared to sporadic somatotroph adenomas. Analyzed number of samples for normal pituitary, AIPpos tumors and sporadic GH tumors, respectively, are as follows: CD68 (n = 9, 9, and 17) and FOXP3 (n = 11, 9, and 17). All images are ×200 magnification and scale bar = 100 µm

