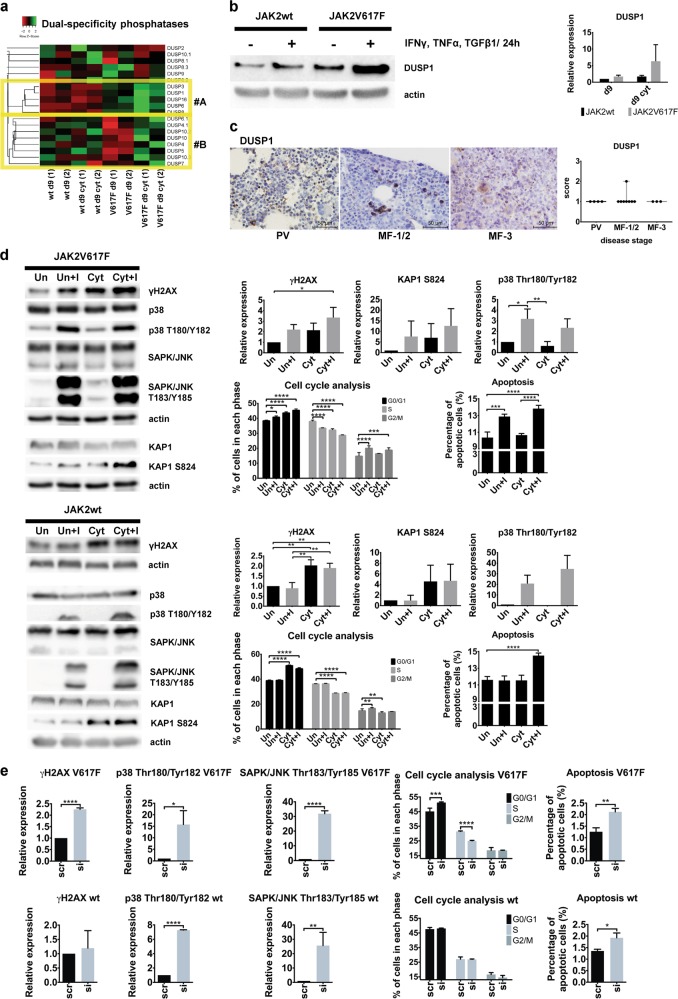
Fig. 4.
JAK2V617F cell-specific DUSP1 overexpression and DUSP1-dependent proliferation and survival of JAK2V617F cells. a Cluster analysis of heatmap representation of differential expression of DUSP genes in d9 and d9 cyt JAK2wt and JAK2V617F+ CD34+ P-ECs. Columns in the heatmap represent individual samples in experimental duplicates (1, 2). Heatmap was constructed by using Kendall’s Tau Distance Measurement Method and Centroid Linkage Clustering Method. Cluster #A contains intrinsically upregulated DUSPs in d9 and cluster #B contains DUSPs upregulated in d9 cyt JAK2V617F+ CD34+ P-ECs. b Left: Western blotting analysis of DUSP1 in untreated (d9) or treated with IFNγ, TNFα and TGFβ1 for 24 h (d9 cyt) JAK2wt and JAK2V617F+ CD34+ P-ECs. Right: This chart shows relative expression of DUSP1 in three independent experiments normalized to actin. c Representative IHC staining of BM sections for DUSP1 among different disease stages of PV progression. Scale bar, 50 µm. Boxplot shows quantification of the number of cells expressing DUSP1 in sections of patients from grouped disease stages. d Western blotting of indicated markers of DDR (γH2AX, KAP1) and SAPK (p38MAPK, JNK) activation, changes in cell cycle profile and percentage of apoptotic cells for HELV617F cells (JAK2V617F; upper panels) and HEL-edited cells (JAK2wt; bottom panels) untreated (Un) or treated with inflammatory cytokines (Cyt) and without or with exposure to BCI (Un + I or Cyt + I). Charts show γH2AX, Ser 824-phosphorylated KAP1 (KAP1 S824) and p38 T180/Y182 relative expression in three independent experiments normalized to actin. KAP1 S824 is an ATM target site [82]. Cell cycle distribution and apoptosis bar charts show percentage of cell numbers ± SD of four independent experiments in each phase of cell cycle and percentage of apoptotic cells, respectively. *P ≤ 0.05, **P ≤ 0.01, ***P ≤ 0.001, ****P ≤ 0.0001, one-way (western blotting) and two-way (cell cycle and apoptosis) ANOVA. e Effect of DUSP1 knock-down in three independent experiments in cytokine-untreated HELV617F and HEL-edited cells on γH2AX and SAPK (p38MAPK, JNK) expression (left graphs), and cell cycle distribution and apoptosis (right graphs). Effects of DUSP1-specific siRNA (si) are compared with scrambled RNA control (scr). Data are normalized and plotted as in d. *P ≤ 0.05, **P ≤ 0.01, ***P ≤ 0.001, ****P ≤ 0.0001, two-way ANOVA (cell cycle) and unpaired Student’s t-test (two-tailed, the rest). See also Supplementary Fig. 4

