Fig. 2.
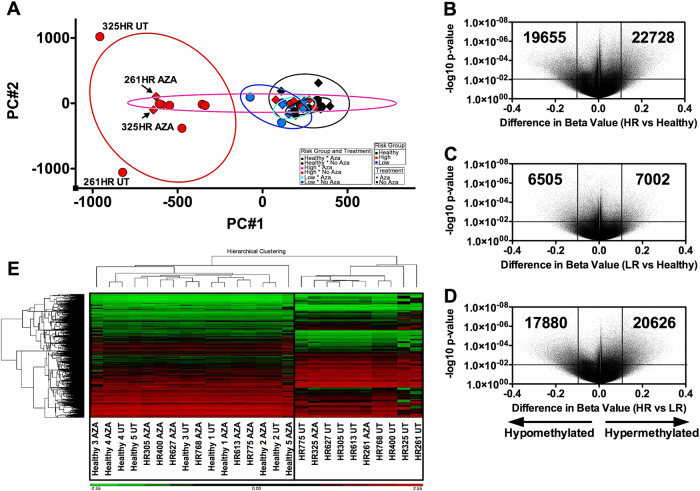
Epigenetic dysregulation in MDS-MSCs. a Unsupervised PCA analysis of a set of 5 healthy (black), 8HR-MDS (261HR, 305HR, 325HR, 400HR, 613HR, 627HR, 768HR, 775HR, red) and 4 LR-MDS (364LR, 378LR, 482LR and 739LR, blue) MSC samples, before (circles, UT) and after (diamonds, AZA) in vitro treatment with AZA reveal distinct groupings. Untreated HR-MDS-MSCs were most epigenetically distinct from untreated healthy or LR-MDS-MSCs. AZA treatment was effective in normalizing the epigenetic profile of all LR-MDS-MSCs (4/4) and most HR-MDS-MSCs (6/8, partial response: 261HR and 325HR). b–d Volcano plots of the significance (p value) against differences between methylation levels of individual CpG loci of different sample groups. MDS-MSCs are more hypermethylated than hypomethylated (22728 vs. 19655 and 7002 vs 6505 hypermethylated loci vs. hypomethylated loci for HR- and LR-MDS-MSCs vs. healthy MSCs, respectively). e Hierarchical clustering of samples using CpG loci that are significantly differentially methylated distinguishes HR-MDS-MSCs vs healthy MSCs, but is not as effective for LR-MDS-MSCs vs healthy MSCs (Supplementary Figure 4A). Additionally, these groupings also reveal that 261HR and 325HR remain more epigenetically similar to untreated counterparts than healthy MSCs, indicating partial response to AZA

