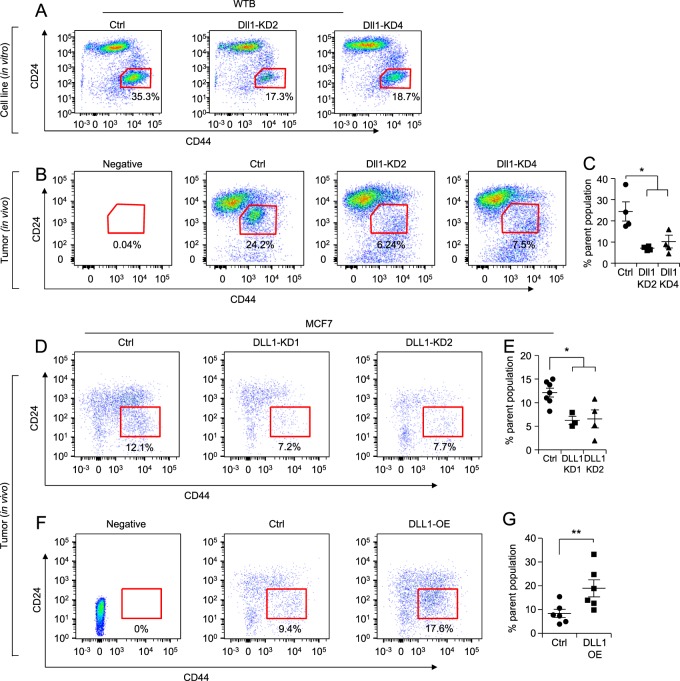
Fig. 6.
Dll1 promotes cancer stem cell (CSC) population in luminal/non-TNBC tumors. a FACS data show reduced in vitro CSC population (CD24−CD44+ population) in WTB Dll1-KDs (KD2 and KD4) cells compared to control cells. b FACS data show reduced in vivo CSCs population in primary tumors derived from injection of WTB Dll1-KDs (KD2 and KD4) cells compared to control tumors using CD24/CD44 markers. c Bar graph shows percentage of CSC population in WTB Dll1-KD (KD2 and KD4) tumor cells compared to control tumor cells. d, f FACS data show reduced in vivo CSC population (CD24−CD44+ population) in primary tumors derived from injection of MCF7 DLL1-KD (KD1 and KD2) cells and DLL1 overexpression (DLL1-OE) cells compared to their respective control tumors. e, g Bar graphs show the quantification of CSC population (CD24−CD44+ population) in DLL1-KDs (KD1 and KD2) and DLL1-OE compared to their respective controls. Scatter plots represent number of animals as dots. Mann−Whitney U test was used to compute p values. Data are presented as the mean ± SEM. *p < 0.05 and **p < 0.01

