Supplemental Digital Content is available in the text.
Background.
There are no instruments that can identify patients at an increased risk of poor outcomes after liver transplantation (LT) based only on their preoperative characteristics. The primary aim of this study was to develop such a scoring system. Secondary outcomes were to assess the discriminative performance of the predictive model for 90-day mortality, 1-year mortality, and 5-year patient survival.
Methods.
The study population was represented by 30 458 adults who underwent LT in the United States between January 2002 and June 2013. Machine learning techniques identified recipient age, Model for End-Stage Liver Disease score, body mass index, diabetes, and dialysis before LT as the strongest predictors for 90-day postoperative mortality. A weighted scoring system (minimum of 0 to a maximum of 6 points) was subsequently developed.
Results.
Recipients with 0, 1, 2, 3, 4, 5, and 6 points had an observed 90-day mortality of 6.0%, 8.7%, 10.4%, 11.9%, 15.7%, 16.0%, and 19.7%, respectively (P ≤ 0.001). One-year mortality was 9.8%, 13.4%, 15.8%, 17.2%, 23.0%, 25.2%, and 35.8% (P ≤ 0.001) and five-year survival was 78%, 73%, 72%, 71%, 65%, 59%, and 48%, respectively (P = 0.001). The mean 90-day mortality for the cohort was 9%. The area under the curve of the model was 0.952 for the discrimination of patients with 90-day mortality risk ≥10%.
Conclusions.
Short- and long-term outcomes of patients undergoing cadaveric LT can be predicted using a scoring system based on recipients’ preoperative characteristics. This tool could assist clinicians and researchers in identifying patients at increased risks of postoperative death.
INTRODUCTION
Outcomes of patients undergoing liver transplantation (LT) have improved over the past decades; nonetheless, immediate postoperative mortality continues to affect 5%–10% of recipients.1 To predict the risk of patient and graft losses, several investigators have developed prognostic models to identify candidates at an increased risk for premature death.2-12 Besides recipient characteristics, current models include variables pertinent to the quality of the grafts and other intraoperative variables such as cold or warm ischemia times that become known only after the completion of surgery.5,7,8,13-15
Clinical variables associated with shorter survival in the general population and patients undergoing major abdominal surgeries are easily identifiable by experienced clinicians. Nevertheless, there is a lack of studies on how these variables play on the short- and long-term survival of LT recipients.
With the introduction of new statistical methods and machine learning techniques, the creation of predictive models estimating the probability of poor outcomes based only on preoperative characteristics has become feasible.16 Such models should not be viewed as replacements for good clinical judgment but as additional instruments to assist clinicians in counseling and managing patients referred for LT.
Because there were no predictive models designed to estimate the probability of mortality after LT based on data collected at the time of their evaluations or listing, our primary aim was to develop a scoring system that could stratify patients by their risk of death after LT based only on preoperative variables. Secondary aims were to assess whether the model could also predict 1- and 5-year patient survival.
MATERIALS AND METHODS
We retrospectively analyzed deidentified patient-level data from the United Network for Organ Sharing (UNOS) for all adults who underwent LT for benign conditions causing end-stage liver disease between January 1, 2002, and June 30, 2013. The study flowchart is presented in Figure 1.
FIGURE 1.
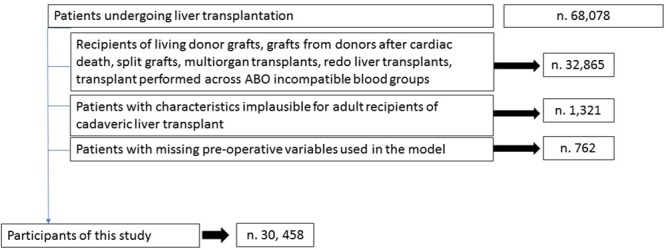
The study flowchart. During the study period, 68 078 patients underwent liver transplant surgery. A total of 32 865 (48.2%) patients were excluded because they did not satisfy the inclusion criteria, 1321 (1.9%) recipients had height or weight values that were implausible for adults, and 762 (1.1%) patients had >10% of variables with missing data or the absence of values for the variables needed to calculate the perioperative mortality risk. In the end, a total of 30 458 fist time cadaveric liver transplant recipients were included in the study.
No restrictions based on race, citizenship, or UNOS region were applied. Because of the well-known differences in perioperative risks of some groups of patients, we excluded recipients who received transplants from grafts recovered from living donors or donors after circulatory death, split grafts, multivisceral or redo transplants, and LT performed across ABO incompatible blood groups. Additional exclusion criteria were patients with values that were deemed implausible for adult recipients.17 Cutoffs for those values were recipient height either ≤120 or ≥240 cm and recipient weight ≤30 or ≥250 kg. We did not use imputation techniques for missing data. Recipients with >10% of unreported values within the UNOS dataset and recipients who had missing data on their age, diabetes, need for dialysis before transplantation, history of coronary artery disease, history of chronic pulmonary disease, and variables needed to calculate their body mass index (BMI) or Model for End-Stage Liver Disease (MELD) score were also excluded. The number of recipients who missed preoperative data necessary for the calculation of the predictive score was 762. Missing value analysis showed a pattern consistent with a random effect. Among 68 078 LT recipients recorded in the UNOS registry, 30 458 (44.7%) met our eligibility criteria.
Patient variables used for the development of the scoring system were included only if available during the preoperative assessment or entered in the dataset at the time of listing. Variables used for patient survival were extracted from the UNOS files during the period between the date of listing for LT until either death (n = 8244) or retransplantation, or the date of last known follow-up (n = 22 214). This study was conducted and reported per STROBE Statement18 recommendations and did not require approval by our institution’s ethics review board.
Candidate Variables
Sociodemographic and clinical characteristics of the study population used for this study were age, sex, ethnicity, primary indication for LT, history of diabetes (type I, type II, or unknown type), history of renal insufficiency requiring renal replacement therapy within 1 week before LT, history of chronic pulmonary disease, history of coronary artery disease, and history of hypertension.
Time dependent variables collected for this study were the date of LT and date of discharge from the hospital after the index operation and the date of the last follow-up. For patients who died after LT, the last date of follow up coincided with the date of their death. Censoring was used at the time when patients underwent retransplantation or the time of the last recorded follow-up visit or at the date of completion of this study.
Definitions and Categories Used in the Model
Patient ethnicity was categorized into 7 groups: Caucasian, African American, Hispanic, Asian, Native American or Alaskan, Hawaiian or Pacific Islander, and Multiracial. The primary indication for LT was summarized in 4 categories: viral hepatitis C, nonalcoholic steatohepatitis, alcoholic-induced cirrhosis, and other causes. BMI was estimated using the formula weight (kg)/height (m).2
World Health Organization definitions were used to classify recipients as underweight (BMI < 18.5), normal weight (BMI 18.5–24.9 kg/m2), overweight (BMI 25–29.9 kg/m2), or obese (BMI ≥ 30 kg/m2). Obesity was further stratified as class I (BMI 30–34.9), class II (BMI 35–39.9), and class III (BMI ≥ 40). BMI classes were not adjusted for the presence of ascites, as the quantitative contribution of ascitic fluid to overall BMI was not reported in the UNOS files.
The primary causes of death were categorized as primary graft-non-function, biliary complications, hemorrhagic, cardiovascular, cerebrovascular, single organ failure, sepsis or multiorgan failure, intraoperative complication, rejection, thrombotic or embolic, other, and unknown cause.
Variables Analyzed With Machine Learning Techniques
Preoperative variables that were selected for the development of the scoring system and analyzed using machine learning techniques were recipient age (in y), BMI, MELD score, history of diabetes, history of preoperative renal replacement therapy, history of hypertension, history of coronary artery disease, and history of chronic pulmonary disease. Recipient age, BMI, and MELD score were used as continuous data, while the remaining variables were entered as categorical.
Classification Tree Analysis
Classification tree analysis (CTA) was used to identify independent predictors associated with 90-day postoperative mortality.19 CTA did not require assumptions on the distribution of variables or linearity of the data and could handle highly skewed or multimodal continuous variables as well as categorical predictors.20 Split-sample validation was used to assess the performance of the model using a training (70% of the dataset) and validation sample (30% of the dataset).
Artificial Neural Networks
Artificial neural network (ANN) analysis was used to determine the predicted probabilities of 90-day postoperative mortality and relative weight of each independent variable respective to the probability of death or survival following LT. For this purpose, a 10-fold cross validation methodology was used, in which the whole dataset was randomly divided and 90% of the patients were selected for the training step and 10% for the final testing. The final model was the one that maximized the correct classification of patients by their 90-day outcomes. The importance of independent predictors represented a measure of how much the predicted values changed with variations of the independent variables.
Logistic Regression
Logistic regression was used to estimate the odds ratio (OR) of 90-day mortality, and the logarithms of the adjusted ORs were used to derive Z scores. Z scores were calculated using the following formula: Z = β + (β1 × predicting variable1) + (β2 × predicting variable2) + (βn+1 × predicting variablen+1). The predicted probability of 90-day mortality was estimated using the following formula: P = (ez/1 + ez) × 100. Correlation between predicted probabilities obtained using ANNs and logistic regression was assessed using linear regression analysis and the Pearson correlation coefficient.
Performance of the Prediction Model
The overall performance of the model was measured by the differences between predicted outcomes and observed outcomes using the Brier score.21 The Brier score was calculated by summing the squared differences between the actual and predicted 90-day mortality for each point in the risk score. The maximum Brier score for a noninformative model was adjusted for the incidence of 90-day mortality observed in the dataset.21 A Brier score of 0 would indicate a perfect model and a Brier score of 0.082 would indicate a noninformative model.
Reclassification of recipients with and without the outcome was performed using the Net Reclassification Improvement (NRI) methodology described by Pencina et al.22 Briefly, upward movement in categories for subjects with the outcome meant improved classification, and any downward movement showed worse reclassification. The opposite was true for patients without the outcome. The improvement in reclassification was quantified as the sum of the differences in proportions of individuals moving up minus the proportion moving down for those with the outcome and the proportion of individuals moving down minus the proportion moving up for those without the outcome.
To assess the calibration of the model, the Hosmer-Lemeshow statistic was used to compare the observed versus expected number of deaths in each group.23 The calibration was graphically assessed using a scatter plot with observed 90-day mortality for each number of the risk score on the x-axis and predicted 90-day mortality by ANN reported on the y-axis. Good calibration would be represented by a regression line with a 45° slope.
To test the predictive ability of the model, the Z scores of patients who died within 90 days and scores of patients who survived were compared using unpaired Student t test. A statistically significant difference between the Z scores would indicate that patients who died within 90 days after LT had a different risk score compared with patients who survived.
C statistics with receiver-operating characteristic curves and corresponding Areas under the curve (AUC) with 95% confidence intervals (CI) were calculated to assess how the model performed at identifying patients who died within 90 days. C statistics were calculated on 5 independent validation cohorts that were randomly selected from the study population. We categorized the estimated risk of 90-day mortality in 5 groups: low risk, average risk, increased risk, high risk, and very high risk. Low-risk patients were the ones with predicted probability of death ≤5%; average-risk patients were those with predicted probability of death in the range of 5.1%–10%; increased-risk patients were those with predicted probability of death in the range of 10.1%–14.9%; high-risk patients were those with predicted probability of death in the range of 15%–19.9%; and very high-risk patients were those with predicted probability of 90-day mortality ≥20%.
Statistical Analysis
The patient sample size was fixed due to the retrospective study design. Continuous variables were reported by estimates of central tendency (means or median) and spread (SD and interquartile range), while frequency and percentages were used for categorical data. ANOVA, χ2, and Kruskal-Wallis tests were used to describe summary statistics. Survival analysis was performed using the Kaplan-Meier method,24 and after assessing that the assumptions of the Cox model were met, the proportional hazard model analysis was used to assess the effect of independent risk factors on the overall survival.17 To calculate hazard ratios, patients with 0 points were selected as references. All statistical analyses were performed using SPSS Statistics for Windows, Version 24 (IBM Corporation, Armonk, NY). Statistical significance was defined when P was <0.05, and two-tailed tests were used for all statistical analyses.
RESULTS
Study Population
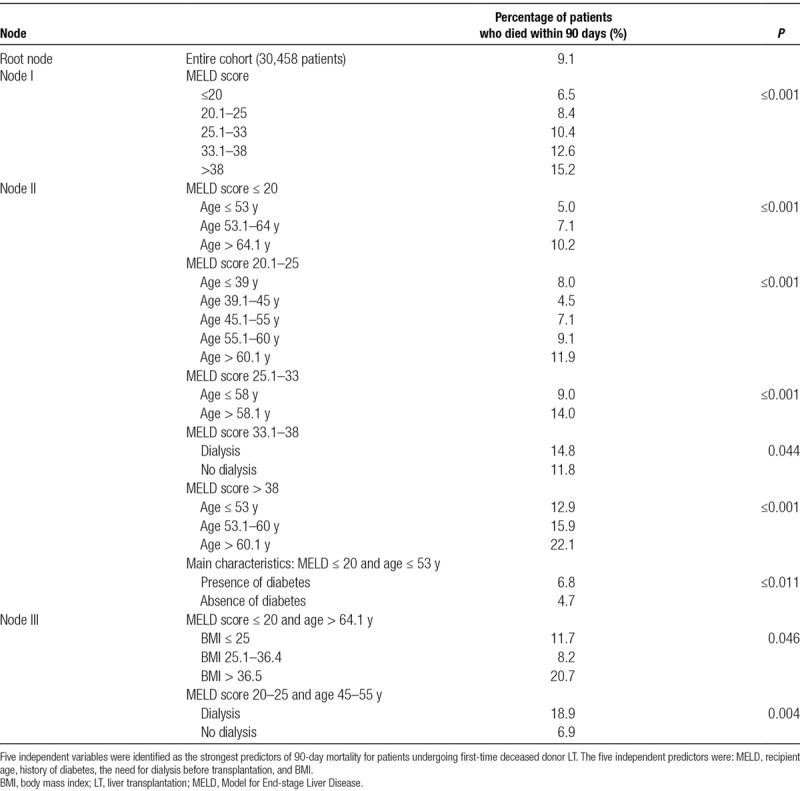
Sociodemographic and clinical characteristics of the study population which included 30 458 patients are presented in Table 1. Postoperative death within 90 days after LT occurred in 2766 (9.1%) recipients. When compared with recipients who survived beyond 90 days, patients who died were older, more likely females, and had higher MELD scores at the time of listing. Other characteristics associated with increased risk of 90-day mortality were the presence of nonalcoholic steatohepatitis as the primary indication for LT, presence of diabetes (type I or II), and need for dialysis before transplantation and morbid obesity (BMI ≥40). CTA identified patient age, MELD score, BMI, the presence of any type of diabetes, and renal failure requiring dialysis before LT as the strongest independent predictors for 90-day mortality (Table 2). Normalized importance analysis by ANN showed that recipient age had the highest weight followed by MELD score, BMI, dialysis, and diabetes (Figure S1, SDC, http://links.lww.com/TP/B753).
TABLE 1.
Demographic and clinical characteristics of the entire study population, of patients who died within 90 days and patients who survived beyond 90 days after LT
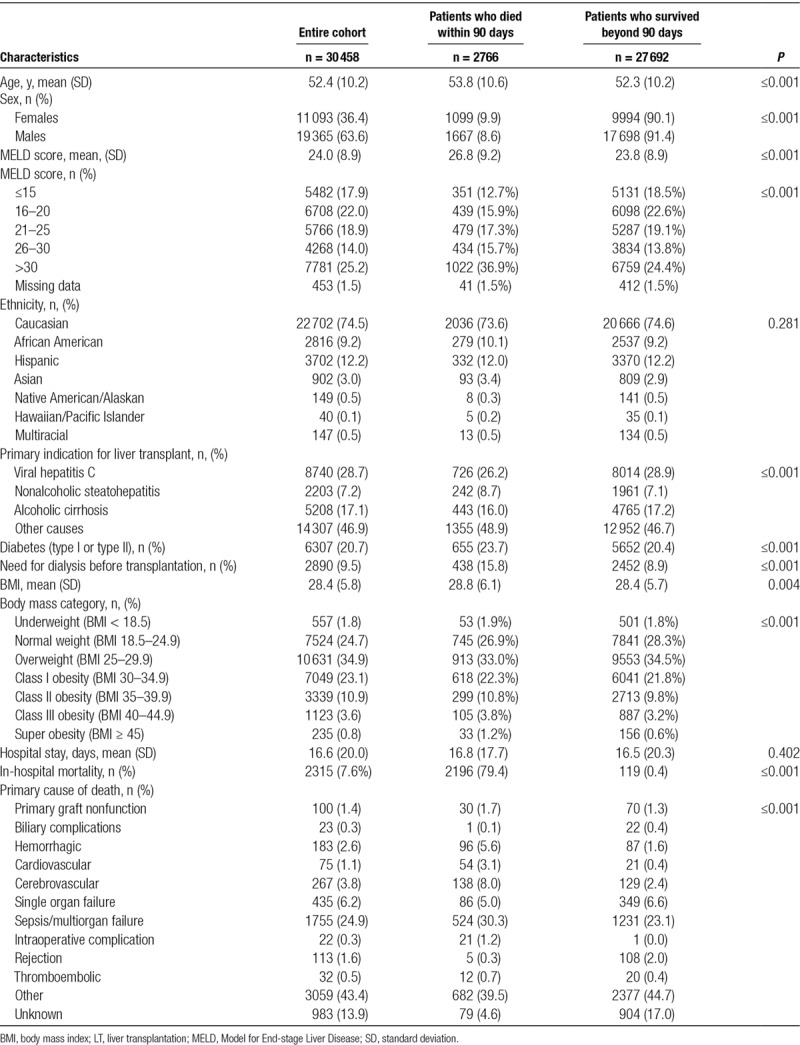
TABLE 2.
Summary of the results of classification tree analysis
Point-based Model
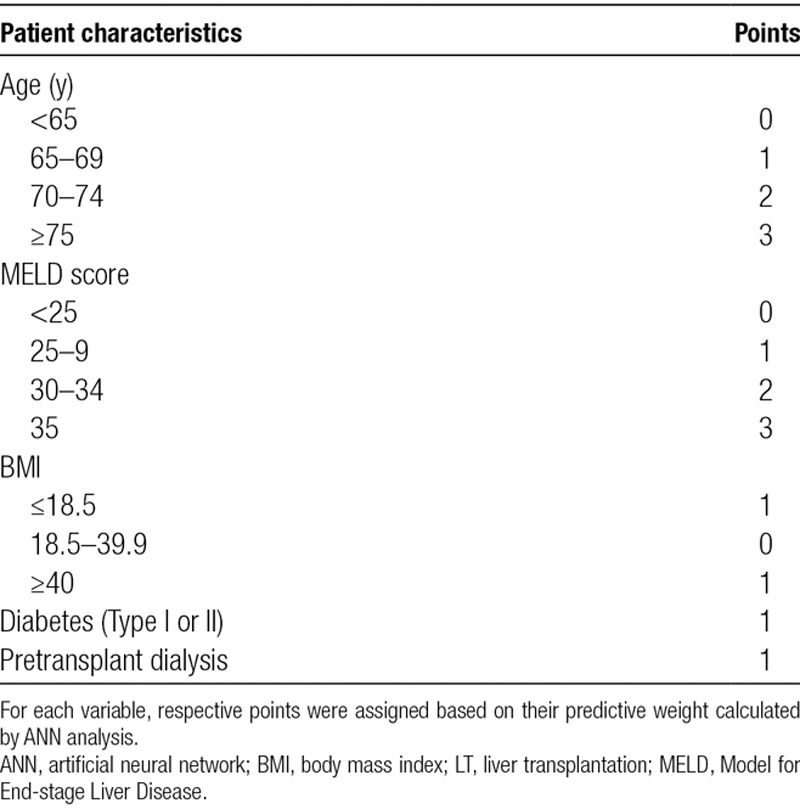
A point-based model created using the weight of each independent variable identified by CTA is summarized in Table 3. Points were assigned according to their weight measured by ANN. One point was given for categorical risk factors. The maximum number of points that each patient could score was capped at 6, representing the value at which observed postoperative mortality risk reached its plateau. A total of 11 620 patients (38.2%) scored 0 points, 7631 (25.1%) scored 1 point, 4284 (14.1%) scored 2 points, 3597 (11.8%) scored 3 points, 2450 (8.0%) scored 4 points, 739 (2.4%) scored 5 points, and 137 (0.4%) scored 6 points.
TABLE 3.
Preoperative patient characteristics identified as independent predictors of 90-day mortality after LT
Observed 90-day Mortality
The observed 90-day mortalities were 6%, 8.7%, 10.4%, 11.9%, 15.7%, 16%, and 19.7% for patients with 0, 1, 2, 3, 4, 5, and 6 points, respectively (Figure 2). For each additional point of the scoring system, the observed 90-day mortality increased on average by 2.3% (SD 1.37).
FIGURE 2.
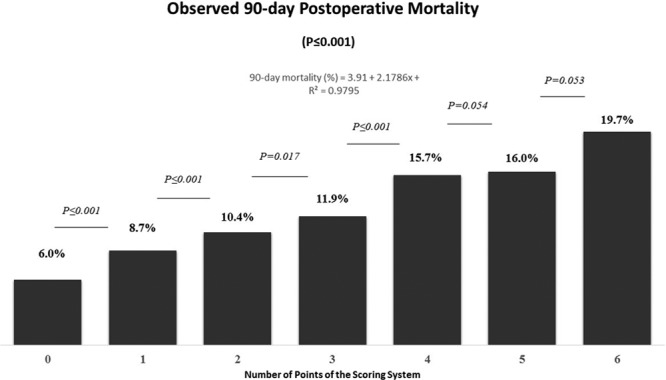
Observed 90-day mortality stratified by the number of points of the scoring system. For each additional point of the scoring system, the observed 90-day mortality increased in average by 2.3%.
A positive linear relationship was observed between the number of points of the scoring system and observed 90-day mortality with a Pearson correlation coefficient R2 of 0.9795 (P ≤ 0.001). There was also a linear correlation between the OR of 90-day mortality and number of points of the scoring system (Pearson correlation coefficient R2 = 0.9724; P ≤ 0.001).
In comparison to patients with 0 points (reference group), the OR for 90-day mortality was 1.47 (95% CI, 1.32-1.64; P = 0.000) for patients with 1 point, 1.79 (95% CI, 1.58-2.03; P < 0.001) for patients with 2 points, 2.09 (95% CI, 1.84-2.38; P < 0.001) for patients with 3 points, 2.88 (95% CI, 2.52-3.29; P < 0.001) for patients with 4 points, 2.95 (95% CI, 2.38-3.64; P ≤ 0.001) for patients with 5 points, and 3.81 (95% CI, 2.48-5.84; P < 0.001) for patient with 6 points (Figure S2, SDC, http://links.lww.com/TP/B753).
Predicted 90-day Mortality
The predicted 90-day mortality by ANN stratified by the preoperative scoring system is summarized in Table 4. Predicted mortality was categorized as low (≤5%), average (5.1%–10%), increased (10.1%–14.9%), high (15%–19.9%), and very high (≥20%) probability. All patients with 0 score had predicted mortality ≤10%. The proportion of patients with risk of 90-day mortality >10% was 7.8% for patients with 1 point, 50.2% for patients with 2 points, 81.9% for patients with 3 points, 94.5% for patients with 4 points, 84.5% for patients with 5 points, and 96.3% for patients with 6 points.
TABLE 4.
Predicted 90-day mortality from neural network analysis after LT stratified by risk score

Performance of the Model
The Hosmer-Lemeshow goodness-of-fit test used to assess the calibration of the model was not statistically significant (P = 0.67), indicating that the model was correctly specified with a linear correlation between the predicted and observed 90-day mortality (Pearson R2 coefficient of 0.99; P ≤ 0.001) (Figure 3). The Brier score of the model was 0.002, denoting that the model was informative with statistically significant differences between the mean value of the Z scores of patients who died within 90 days in comparison to patients who survived beyond 90 days (−2.23 versus −2.37; P < 0.001).
FIGURE 3.
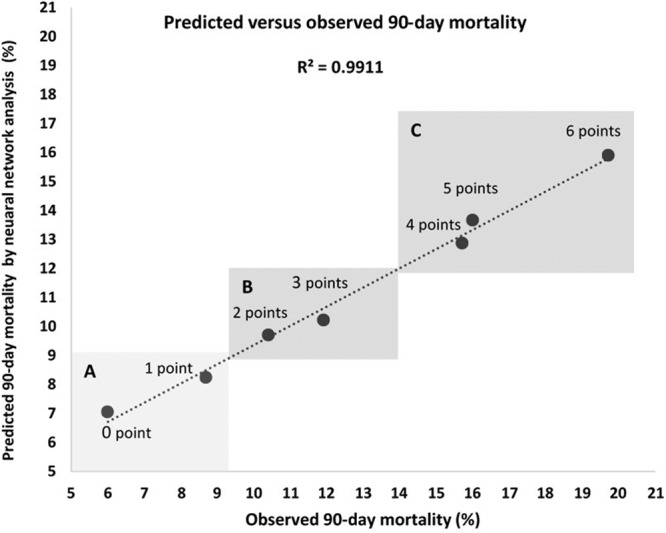
Graphic evaluation of the calibration of the model. Values on the y-axis represent the estimates of 90-day mortality calculated by artificial neural network analysis. Values on the x-axis represent the observed 90-day mortality stratified by risk score. The lowest values of the predicted and observed mortality (left lower quadrant, A) represent patients with 0 or 1 risk score point. Values in the upper right quadrant represent the predicted and observed 90-day mortality of patients with 4, 5, and 6 points (Quadrant C). Patients with 2 and 3 points had predicted and observed 90-day mortality values that fell in between (Quadrant B). The Pearson correlation coefficient (R2) of the model was 0.99 (P < 0.001).
A linear correlation with Pearson R2 coefficient of 0.91 (P ≤ 0.001) was found between the probabilities of 90-day mortality estimated by ANN and logistic regression (Figure S3, SDC, http://links.lww.com/TP/B753).
For the entire cohort, the model’s discriminative performance in identifying patients who died within 90 days after LT had an AUC of 0.601 (95% CI, 0.590-0.613; P < 0.001) (Figure 4A). The AUC increased to 0.952 (95% CI, 0.950-0.954; P < 0.001) for the discrimination of patients with a 90-day mortality risk of ≥10% (Figure 4B). The value of the AUC was 0.930 (95% CI, 0.926-0.935; P < 0.001) for patients with 90-day mortality risk ≥15% (Figure 4C) and 0.866 (95% CI, 0.854-0.877; P < 0.001) for patients with 90-day mortality risk ≥20% (Figure 4D). The sensitivity and specificity of the model for the prediction of 90-day mortality for the entire cohort and patients with higher predicted risks are reported in Figure S4 (Panel A to D; SDC, http://links.lww.com/TP/B753).
FIGURE 4.
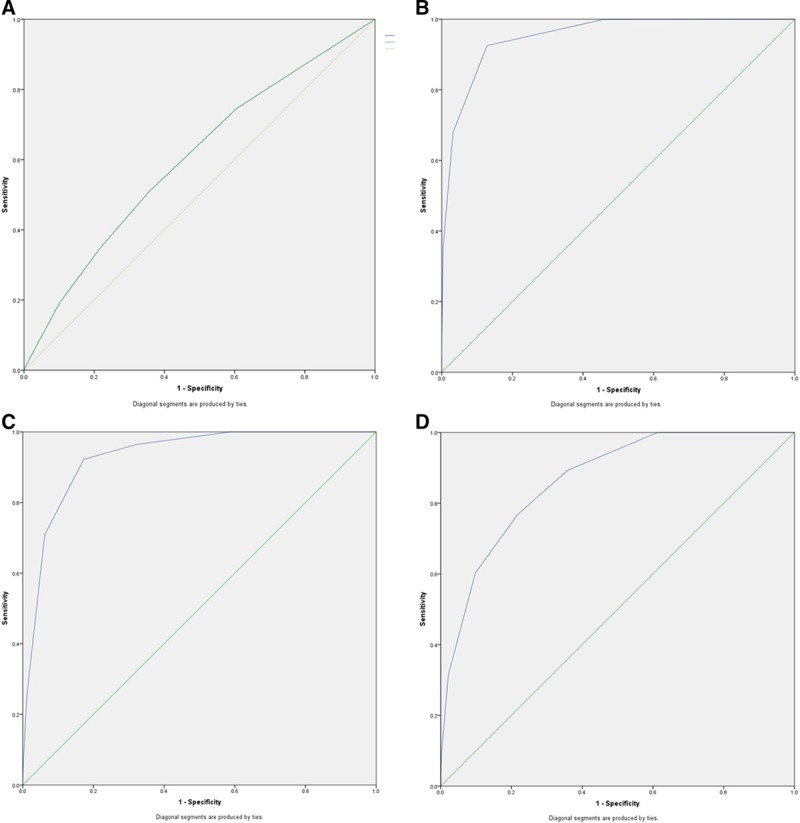
Receiver operating characteristic curves of the model illustrating the discriminating performance of the model to diagnose 90-day mortality of all patients undergoing cadaveric LT (A). B, The area under the curve (AUC) of the model for the prediction of patients with perioperative risk ≥10%, (C) the AUC of the model for the prediction of patients with perioperative risk ≥15%, and (D) the AUC of the model for the prediction of patients with perioperative risk ≥20%. LT, liver transplantation.
In patients with 0–1 points, the net reclassification index of the model for perioperative risk <10% was 9.1%. In patients with 2–3 points, NRI for perioperative risk of 10%–15% was 3.2%, and in patients with 4–6 points, NRI for perioperative risk of ≥15% was 4.8%. Using the cutoff value of 2 or more points, the NRI of the model for patients at increased risk of 90-day mortality (≥10%) was 7.6%.
Secondary Endpoints
Within 1 year after LT, 4257 patients (14.0% of the cohort) had died. Mortality affected 9.8% of patients with 0 points, 13.4% of patients with 1 point, 15.8% of patients with 2 points, 17.2% of patients with 3 points, 23.0% of patients with 4 points, 25.2% of patients with 5 points, and 35.8% of patients with 6 points (P ≤ 0.001). For each additional point of the scoring system, the observed 1-year mortality increased in average by 4.3% (Figure 5).
FIGURE 5.
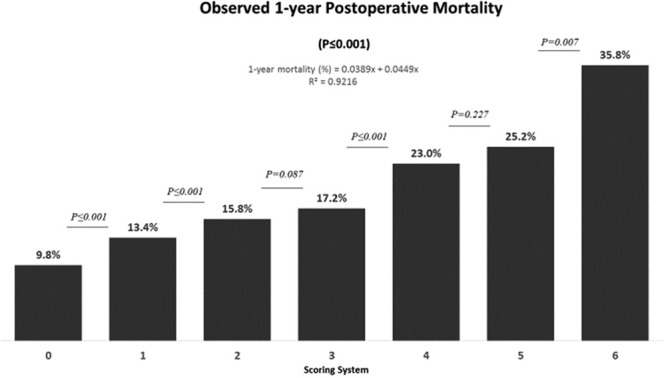
Observed 1-y mortality in patients undergoing deceased donor liver transplantation stratified by the scoring system. For each additional point of the scoring system, the observed 1-y mortality increased on average by 4.3%.
Overall 5-year survival for the cohort was 74% with a median follow-up of 11.1 years (95% CI, 10.7-11.4). During the study period, 8244 patients had died (27.1%) and 22 214 (72.9%) were censored. Five-year patient survival was 78% for patients with 0 points, 73% for patients with 1 point, 72% for patients with 2 points, 71% for patients with 3 points, 65% for patients with 4 points, 59% for patients with 5 points, and 48% for patients with 6 points (P = 0.001) (Figure 6).
FIGURE 6.
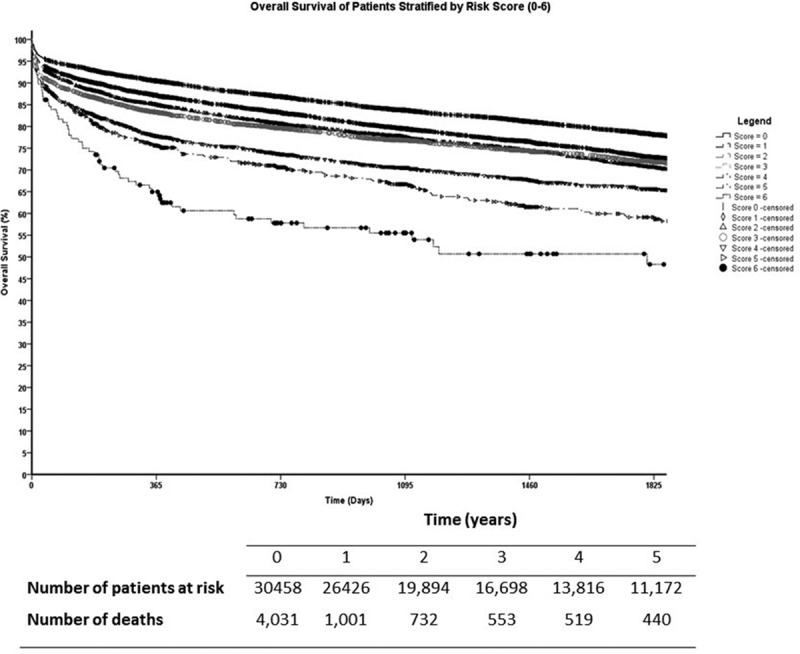
Kaplan-Meier survival curves of all adult liver transplant recipients stratified by their risk score. Pairwise comparisons between groups showed statistically significant differences in 5-y survival except when patients with 2 points were compared to patients with 3 points (P = 0.794).
DISCUSSION
The most significant finding of this study is that a predictive model that can identify patients at increased risk of perioperative mortality after LT is feasible using clinical variables attainable during the early phase of their evaluations. Because LT is a life-saving procedure requiring advanced clinical and technical skills, this predicting model is not meant to be used in isolation or as a substitute for good clinical judgment. Yet, it could be a valuable instrument for clinicians, administrators, and investigators as an instrument that can provide an objective estimate of the risk of suboptimal outcomes after LT.25
The allocation of liver grafts based on MELD score26,27 prioritizes the sickest patients on the waitlist27-29 and has changed the characteristics of recipients undergoing LT in the United States and other parts of the world.30,31 Compared to patients who underwent transplantation before the MELD score was implemented, current candidates are older, with more comorbidities32 and higher acuity of liver disease.1,9,33,34 Recent studies have shown that the average perioperative mortality after LT ranges between 5% and 10%,11 but the risk is more significant in patients with high MELD scores,35 several comorbidities,9 advanced age,36 abnormal BMI,37,38 and low performance status.39
One of the common challenges for transplant specialists dealing with the current allocation system is the selection of appropriate surgical candidates. By selecting only patients at low perioperative risk, transplant programs would decline life-saving operations to many individuals who benefit from LT. On the other hand, the selection of very high-risk patients reduces the number of grafts that could be allocated to recipients with a better chance of survival. Finding the balance between these 2 scenarios can be difficult without an objective instrument to stratify patients during the early phases of their evaluations.25
For our model, the C statistics of perioperative mortality risk ≥10%, ≥15%, and ≥20% were 0.95, 0.93, and 0.86, respectively, and for patients with 3 or more points, sensitivity and specificity were 91% and 82%, respectively. These findings are relevant because patients with irreversible liver diseases can only be cured by LT unless unsuitable for surgery. Consequently, the most critical decision to be made is whether or not LT should be performed based on the probability that the patient would survive the operation or not. In many circumstances, this decision is rather straightforward, but for marginal recipients it can be difficult, and despite the best clinical acumen, it can be biased and inconsistent over time. Consequently, a scoring system like the one we are proposing could assist healthcare providers in making more objective decisions during patient selection or in allocating appropriate resources to patients at high perioperative risk.
Several other investigators2,4,5,9,12,13,15,16,35,40-43 have proposed predictive models to identify LT candidates at increased risk of postoperative death. These existing scoring systems include characteristics that are pertinent to recipients, donors, and quality of the graft and require operative variables that become available only once surgery is completed.5 Therefore, most transplant centers do not rely on these models for the listing potential candidates. Another reason is that the predictive performance of current models is only modest with C statistics ranging from 0.63,7 to 0.7.5,8,10,31 Compared with existing models, ours has higher C statistics for the identification of patients at the increased risk of 90-day mortality and the advantage of being usable when patients are initially referred for LT. Therefore, it can be used to counsel patients and their families before surgery regarding their specific probabilities of short-term outcomes and expected survival up to 5 years after LT. Last, our scoring system was developed using a large national dataset that makes it more generalizable than other models developed using single-center datasets.
Despite all these advantages, the results of our study should be interpreted with some caution, because the scoring system has not been tested and validated using other cohorts of patients yet. Although the model performed well in identifying high-risk patients, several limitations are worth mentioning in addition to its retrospective design. First, we could only analyze and subsequently develop the model using variables collected in the STAR files. Because the risk of postoperative death depends on other factors that are not collected in the STAR files, we could not study the impact of malnutrition,44 sarcopenia,45 or frailty,46 which were identified as negative prognostic factors by other groups.
Another limitation is that the STAR files did not provide enough information to determine the sequence of events that led to postoperative death. Therefore, we could not assess whether patients expired from complications directly related to technical problems during surgery or had complications caused by preexisting conditions.
From the methodological point of view, our model might be less accurate when used in other populations.47 To address this issue, we are currently evaluating its validity and performance in a cohort of patients who underwent transplantation between June 30, 2013, and December 31, 2017. We also acknowledge that this model was developed using data from patients who underwent transplant surgery. Therefore, our findings might be mitigated by the inevitable selection bias, because only patients who were deemed surgical candidates were included. In addition, the model includes only preoperative variables and consequently does not incorporate the role of decisions made by surgeons and physicians before proceeding to each transplant. These complex decisions could plausibly modify the risks of perioperative mortality as many transplant programs commonly allocate the best grafts to patients with the highest perioperative risk and vice versa.
Also, the primary diagnosis of liver disease and recipient sex were intentionally excluded from the variables used to develop the predictive model, because the inclusion of these characteristics would disadvantage some groups of patients due to their gender or cause of liver failure. Therefore, it is possible that our model might perform differently in females versus males and for different causes of liver disease.
Finally, it is important to point out that this model was not developed for the stratification of patients who are known to be at an increased risk of perioperative death, such as patients who require a redo LT, or patients who undergo split livers or multivisceral transplant surgeries.
In conclusion, using machine learning techniques, we were able to develop a model to stratify the risk of 90-day postoperative mortality of patients referred for cadaveric LT. This model can also predict the risk of 1-year mortality and 5-year survival based only on pretransplant recipients’ clinical and demographic characteristics. Although the model has good discrimination for high-risk recipients, a validation study will be necessary to test its performance in a different cohort of LT recipients.
Supplementary Material
Footnotes
M.M. participated in the study design, data analysis, and coauthored the manuscript. S.A. and A.Te. coauthored the manuscript. A.Ts. and N.J. participated in the study design and coauthored the manuscript. D.J. participated in the study design and data analysis. S.H.R. coauthored the manuscript and participated in the revision of the manuscript, tables, and figures.
The authors declare no funding or conflicts of interest.
Supplemental digital content (SDC) is available for this article. Direct URL citations appear in the printed text, and links to the digital files are provided in the HTML text of this article on the journal’s Web site (www.transplantjournal.com).
REFERENCES
- 1.Rana A, Ackah RL, Webb GJ, et al. No gains in long-term survival after liver transplantation over the past three decades. Ann Surg 201926920–27 [DOI] [PubMed] [Google Scholar]
- 2.Dutkowski P, Oberkofler CE, Slankamenac K, et al. Are there better guidelines for allocation in liver transplantation? A novel score targeting justice and utility in the model for end-stage liver disease era. Ann Surg 2011254745–53Discussion 753 [DOI] [PubMed] [Google Scholar]
- 3.Feng S, Goodrich NP, Bragg-Gresham JL, et al. Characteristics associated with liver graft failure: the concept of a donor risk index. Am J Transplant 20066783–790 [DOI] [PubMed] [Google Scholar]
- 4.Halldorson JB, Bakthavatsalam R, Fix O, et al. D-MELD, a simple predictor of post liver transplant mortality for optimization of donor/recipient matching. Am J Transplant 20099318–326 [DOI] [PubMed] [Google Scholar]
- 5.Rana A, Hardy MA, Halazun KJ, et al. Survival outcomes following liver transplantation (SOFT) score: a novel method to predict patient survival following liver transplantation. Am J Transplant 200882537–2546 [DOI] [PubMed] [Google Scholar]
- 6.Schaubel DE, Guidinger MK, Biggins SW, et al. Survival benefit-based deceased-donor liver allocation. Am J Transplant 200994 Pt 2970–981 [DOI] [PMC free article] [PubMed] [Google Scholar]
- 7.Braat AE, Blok JJ, Putter H, et al. ; European Liver and Intestine Transplant Association (ELITA) and Eurotransplant Liver Intestine Advisory Committee (ELIAC) The Eurotransplant donor risk index in liver transplantation: ET-DRI. Am J Transplant 2012122789–2796 [DOI] [PubMed] [Google Scholar]
- 8.Rana A, Pallister ZS, Guiteau JJ, et al. Survival outcomes following pediatric liver transplantation (pedi-SOFT) score: a novel predictive index. Am J Transplant 2015151855–1863 [DOI] [PubMed] [Google Scholar]
- 9.Petrowsky H, Rana A, Kaldas FM, et al. Liver transplantation in highest acuity recipients: identifying factors to avoid futility. Ann Surg 20142591186–1194 [DOI] [PubMed] [Google Scholar]
- 10.Levesque E, Winter A, Noorah Z, et al. Impact of acute-on-chronic liver failure on 90-day mortality following a first liver transplantation. Liver Int 201737684–693 [DOI] [PubMed] [Google Scholar]
- 11.Burroughs AK, Sabin CA, Rolles K, et al. ; European Liver Transplant Association 3-month and 12-month mortality after first liver transplant in adults in Europe: predictive models for outcome. Lancet 2006367225–232 [DOI] [PubMed] [Google Scholar]
- 12.Weismüller TJ, Prokein J, Becker T, et al. Prediction of survival after liver transplantation by pre-transplant parameters. Scand J Gastroenterol 200843736–746 [DOI] [PubMed] [Google Scholar]
- 13.Schrem H, Reichert B, Frühauf N, et al. The donor-risk-index, ECD-score and D-MELD-score all fail to predict short-term outcome after liver transplantation with acceptable sensitivity and specificity. Ann Transplant 2012175–13 [DOI] [PubMed] [Google Scholar]
- 14.Luca A, Angermayr B, Bertolini G, et al. An integrated MELD model including serum sodium and age improves the prediction of early mortality in patients with cirrhosis. Liver Transpl 2007131174–1180 [DOI] [PubMed] [Google Scholar]
- 15.Györi GP, Silberhumer GR, Zehetmayer S, et al. Dynamic changes in MELD score not only predict survival on the waiting list but also overall survival after liver transplantation. Transpl Int 201225935–940 [DOI] [PubMed] [Google Scholar]
- 16.Lau L, Kankanige Y, Rubinstein B, et al. Machine-learning algorithms predict graft failure after liver transplantation. Transplantation 2017101e125–e132 [DOI] [PMC free article] [PubMed] [Google Scholar]
- 17.Ayloo S, Hurton S, Cwinn M, et al. Impact of body mass index on outcomes of 48281 patients undergoing first time cadaveric liver transplantation. World J Transplant 20166356–369 [DOI] [PMC free article] [PubMed] [Google Scholar]
- 18.Vandenbroucke JP. The making of STROBE. Epidemiology 200718797–799 [DOI] [PubMed] [Google Scholar]
- 19.Fei Y, Gao K, Hu J, et al. Predicting the incidence of portosplenomesenteric vein thrombosis in patients with acute pancreatitis using classification and regression tree algorithm. J Crit Care 201739124–130 [DOI] [PubMed] [Google Scholar]
- 20.Hayes T, Usami S, Jacobucci R, et al. Using classification and regression trees (CART) and random forests to analyze attrition: results from two simulations. Psychol Aging 201530911–929 [DOI] [PMC free article] [PubMed] [Google Scholar]
- 21.Brier GW. Verification of forecasts expressed in terms of probability. Mon Weather Rev 1950781–3 [Google Scholar]
- 22.Pencina MJ, D’Agostino RB, Sr, D’Agostino RB, Jr, et al. Evaluating the added predictive ability of a new marker: from area under the ROC curve to reclassification and beyond. Stat Med 200827157–172. Discussion 207 [DOI] [PubMed] [Google Scholar]
- 23.Hosmer DW, Hosmer T, Le Cessie S, et al. A comparison of goodness-of-fit tests for the logistic regression model. Stat Med 199716965–980 [DOI] [PubMed] [Google Scholar]
- 24.Strauss D, Shavelle R. An extended Kaplan-Meier estimator and its applications. Stat Med 199817971–982 [DOI] [PubMed] [Google Scholar]
- 25.Fayek SA, Quintini C, Chavin KD, et al. The current state of liver transplantation in the United States: perspective from American Society of Transplant Surgeons (ASTS) scientific studies committee and endorsed by ASTS council. Am J Transplant 2016163093–3104 [DOI] [PubMed] [Google Scholar]
- 26.Malinchoc M, Kamath PS, Gordon FD, et al. A model to predict poor survival in patients undergoing transjugular intrahepatic portosystemic shunts. Hepatology 200031864–871 [DOI] [PubMed] [Google Scholar]
- 27.Wiesner R, Edwards E, Freeman R, et al. ; United Network for Organ Sharing Liver Disease Severity Score Committee Model for end-stage liver disease (MELD) and allocation of donor livers. Gastroenterology 200312491–96 [DOI] [PubMed] [Google Scholar]
- 28.Kamath PS, Wiesner RH, Malinchoc M, et al. A model to predict survival in patients with end-stage liver disease. Hepatology 200133464–470 [DOI] [PubMed] [Google Scholar]
- 29.Botta F, Giannini E, Romagnoli P, et al. MELD scoring system is useful for predicting prognosis in patients with liver cirrhosis and is correlated with residual liver function: a European study. Gut 200352134–139 [DOI] [PMC free article] [PubMed] [Google Scholar]
- 30.Thuluvath PJ, Guidinger MK, Fung JJ, et al. Liver transplantation in the United States, 1999-2008. Am J Transplant 2010104 Pt 21003–1019 [DOI] [PubMed] [Google Scholar]
- 31.Dutkowski P, Oberkofler CE, Béchir M, et al. The model for end-stage liver disease allocation system for liver transplantation saves lives, but increases morbidity and cost: a prospective outcome analysis. Liver Transpl 201117674–684 [DOI] [PubMed] [Google Scholar]
- 32.Yi Z, Mayorga ME, Orman ES, et al. Trends in characteristics of patients listed for liver transplantation will lead to higher rates of waitlist removal due to clinical deterioration. Transplantation 20171012368–2374 [DOI] [PMC free article] [PubMed] [Google Scholar]
- 33.Raval Z, Harinstein ME, Skaro AI, et al. Cardiovascular risk assessment of the liver transplant candidate. J Am Coll Cardiol 201158223–231 [DOI] [PubMed] [Google Scholar]
- 34.Xia VW, Taniguchi M, Steadman RH. The changing face of patients presenting for liver transplantation. Curr Opin Organ Transplant 200813280–284 [DOI] [PubMed] [Google Scholar]
- 35.Schlegel A, Linecker M, Kron P, et al. Risk assessment in high- and low-MELD liver transplantation. Am J Transplant 2017171050–1063 [DOI] [PubMed] [Google Scholar]
- 36.Waits SA, Kim EK, Terjimanian MN, et al. Morphometric age and mortality after liver transplant. JAMA Surg 2014149335–340 [DOI] [PubMed] [Google Scholar]
- 37.Bambha KM, Dodge JL, Gralla J, et al. Low, rather than high, body mass index confers increased risk for post-liver transplant death and graft loss: risk modulated by model for end-stage liver disease. Liver Transpl 2015211286–1294 [DOI] [PubMed] [Google Scholar]
- 38.Barone M, Viggiani MT, Losurdo G, et al. Systematic review with meta-analysis: post-operative complications and mortality risk in liver transplant candidates with obesity. Aliment Pharmacol Ther 201746236–245 [DOI] [PubMed] [Google Scholar]
- 39.Dolgin NH, Martins PN, Movahedi B, et al. Functional status predicts postoperative mortality after liver transplantation. Clin Transplant 2016301403–1410 [DOI] [PubMed] [Google Scholar]
- 40.Klein KB, Stafinski TD, Menon D. Predicting survival after liver transplantation based on pre-transplant MELD score: a systematic review of the literature. PLOS One. 2013;8:e80661. doi: 10.1371/journal.pone.0080661. [DOI] [PMC free article] [PubMed] [Google Scholar]
- 41.Ghobrial RM, Gornbein J, Steadman R, et al. Pretransplant model to predict posttransplant survival in liver transplant patients. Ann Surg 2002236315–322. Discussion 322 [DOI] [PMC free article] [PubMed] [Google Scholar]
- 42.Bilbao I, Armadans L, Lazaro JL, et al. Predictive factors for early mortality following liver transplantation. Clin Transplant 200317401–411 [DOI] [PubMed] [Google Scholar]
- 43.Bilbao I, Figueras J, Grande L, et al. Risk factors for death following liver retransplantation. Transplant Proc 2003351871–1873 [DOI] [PubMed] [Google Scholar]
- 44.Stephenson GR, Moretti EW, El-Moalem H, et al. Malnutrition in liver transplant patients: preoperative subjective global assessment is predictive of outcome after liver transplantation. Transplantation 200172666–670 [DOI] [PubMed] [Google Scholar]
- 45.Englesbe MJ, Patel SP, He K, et al. Sarcopenia and mortality after liver transplantation. J Am Coll Surg 2010211271–278 [DOI] [PMC free article] [PubMed] [Google Scholar]
- 46.Guaraldi G, Dolci G, Zona S, et al. A frailty index predicts post-liver transplant morbidity and mortality in HIV-positive patients. AIDS Res Ther. 2017;14:37. doi: 10.1186/s12981-017-0163-x. [DOI] [PMC free article] [PubMed] [Google Scholar]
- 47.Bleeker SE, Moll HA, Steyerberg EW, et al. External validation is necessary in prediction research: a clinical example. J Clin Epidemiol 200356826–832 [DOI] [PubMed] [Google Scholar]


