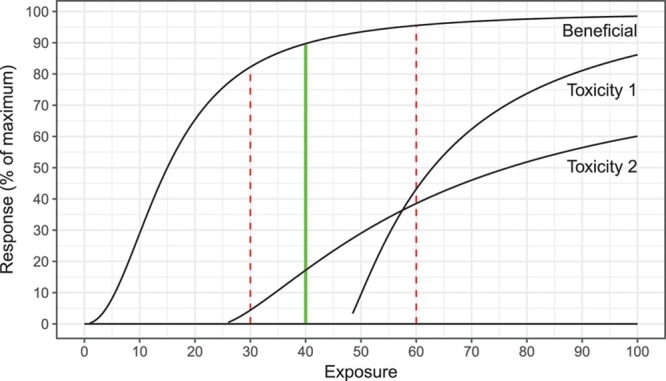
FIGURE 2.

Schematic diagram of exposure-effect relationships for hypothetical “DRUG X,” with exposure-response curves for benefit (reduction in rejection from the baseline rate), toxicity 1 (infectious risk, including opportunistic), and toxicity 2 (suppression of hematopoeisis). Magnitude of response and likelihood and magnitude of toxicities increase with increasing exposure. From the bottom to the top of the therapeutic range (dashed red lines, 30–60 units), magnitude of beneficial response increases, as do toxicities. The optimal balance of efficacy and toxicities is seen at 40 units (optimal target exposure).
