Abstract
This study investigated the effect of object curvature, normal force and material on skin friction coefficient. Twelve subjects slid their middle fingertip pad against a test object with small (11 mm), medium (18, 21 mm) or large (flat object) radii of curvature, while maintaining a normal force of 1, 10 or 20 N. Tested materials were aluminum and four rubber hoses. The average friction coefficient was 0.6 for aluminum, and 0.9 for the rubber hoses. As normal force increased from 1 to 20 N, the average friction coefficient decreased 46%. Friction coefficient did not vary significantly with object curvature. The citation of friction coefficient data requires careful attention to normal force levels with which they were measured, but not so much to object curvature between 11 mm and infinity.
Keywords: coefficient of friction, skin friction, surface curvature, skin deformation, hand friction
1. INTRODUCTION
1.1. Significance
Friction coefficient data are needed for design of objects and workstations to improve efficiency in force generation, to ensure that required force for completing a task does not exceed one’s strength capacities, and to prevent injuries due to slippage. High friction materials allow wheelchair users to push the wheelchair wheels with less muscle effort (Richter et al., 2006; Seo et al., 2008a) and consumers to open bottles and containers more easily (Imrhan and Farahmand, 1999; Nagashima and Konz, 1986; Seo et al., 2007; Seo et al., 2008b). High friction materials also allow workers to use screwdrivers or other hand tools with less force (Frederick and Armstrong, 1995; Laroche et al., 2007) and to have greater rope-pulling capabilities (Wu et al., 2008). Low friction handles cause slippage of the hand which leads to injury (Malker, 1991; Rubin et al., 2007). High force exertions due to the use of low friction objects can result in fatigue, pain, musculoskeletal disorders, or injury (Bystrom and Fransson-Hall, 1994; Bystrom and Kilbom, 1990; National Research Council and Institute of Medicine, 2001; Kutluhan et al., 2001; Kao, 2003; Rohmert, 1973; Wei et al., 2003). Cai et al. (2005) observed that fats reduce friction on tools used in the meat industry where the incidence of musculoskeletal disorders and other injuries is 3.5 times greater than other comparable industries.
1.2. Factors for Friction coefficient: Normal force, Contact Area
While skin friction coefficient data are needed for the design of work objects or consumer products, the data are limited. Not only are friction coefficients unique for each material in contact with the hand (Buchholz et al., 1988; Laroche et al., 2007; Ohura et al., 2005; O’Meara and Smith, 2002; Seo et al., accepted); it has also been shown that the friction coefficient for skin varies with normal force (Bobjer et al., 1993; Buchholz et al., 1988; Comaish and Bottoms, 1971; El-Shimi, 1977; Koudine et al., 2000; Seo et al., accepted; Sivamani et al., 2003) and contact area (Bullinger et al., 1979; Comaish and Bottoms 1971; Seo et al., accepted), contrary to the classical friction law by Amonton (1699) and Coulomb (1785).
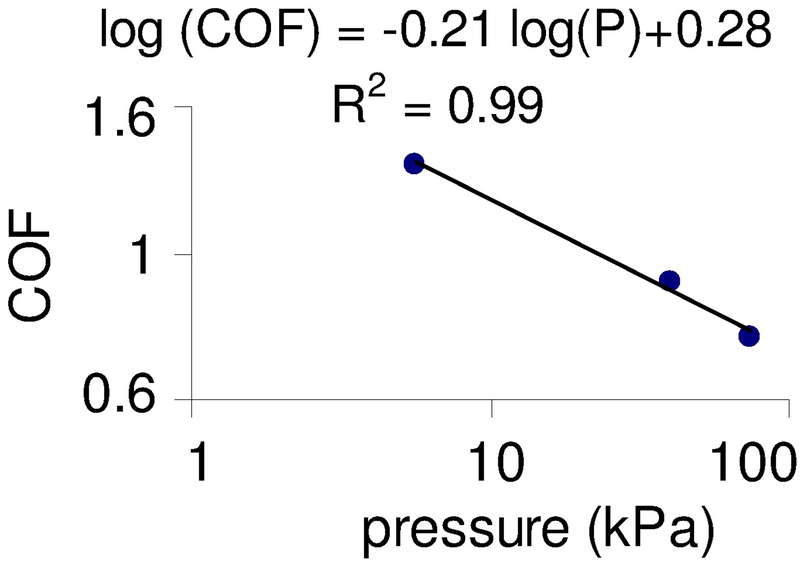
The relationship between friction coefficient, contact area, and normal force can be modeled by describing friction coefficient as a function of contact pressure (normal force divided by contact area). Using the data in Bobjer et al. (1993), the friction coefficient for the finger pad in contact with a flat polycarbonate surface can be modeled as a log function of contact pressure (see Figure 1).
Figure 1.
Relationship between coefficient of friction (COF) and pressure (P in kPa) for the index finger in log scales using data from Bobjer et al. (1993)
1.3. Relationship between Contact Area and Curvature
Previous studies have shown that friction coefficient is related to contact area (Bullinger et al., 1979; Comaish and Bottoms 1971; Seo et al., accepted). The contact area is expected to be related to object curvature, as described hereafter. The contact area between a fingertip and an object can be estimated by the following equation provided in Timoshenko and Goodier (1970), assuming that the fingertip and the object are spheres:
| (1) |
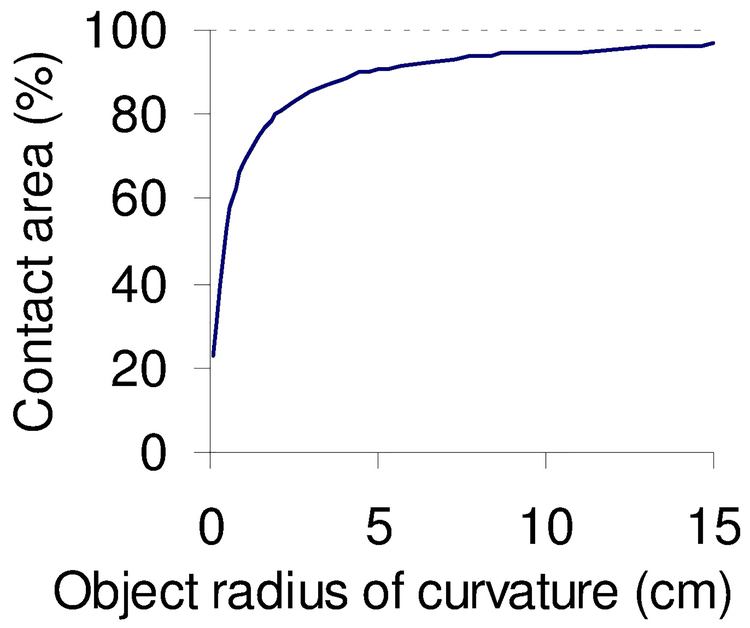
, where Fn is normal force, R1, ν1, and E1 are the radius, the Poisson’s ratio, and the Young’s modulus for the test object, and R2, ν2, and E2 are the radius, the Poisson’s ratio, and the Young’s modulus for the fingertip. This equation suggests that the contact area increases with increasing radius of curvature of the object as shown in Figure 2. This argument agrees to a simulation study by Wu and Dong (2005) who demonstrated that the contact area was, on average, 24% less for an object with a 12-mm radius of curvature than for a flat object (radius of curvature = ∞); however, their study did not expand on investigation of friction coefficient.
Figure 2.
Expected contact area between the fingertip and an object as a function of object radius of curvature can be calculated using Equation 1 by Timoshenko and Goodier (1970). The radius of the fingertip is assumed to be 8 mm (Buchholz and Armstrong, 1991). The contact area is normalized to that for a flat object.
1.4. Study Objectives
Even though many objects handled in everyday activities have curved surfaces, the effect of object curvature on friction coefficient has not been investigated. Previous friction coefficient measurements were conducted either on a flat object against skin (Bobjer et al., 1993; Buchholz et al., 1988; Bullinger et al., 1979; Comaish and Bottoms, 1971; Seo et al., accepted) or a curved object only (Koudine et al., 2000; Laroche et al., 2007; O’Meara and Smith, 2002; Sivamani et al., 2003). Therefore, this study investigates the effect of object curvature on friction coefficient for different normal force levels and for five materials commonly used in assembly plants.
2. METHOD
2.1. Procedure
A fractional factorial experiment was conducted in which coefficient of friction (dependent variable) was measured for selected materials, normal forces, and radii of curvature (independent variables). The five materials tested were aluminum and four rubber hoses – hose A, B, C, and D (see apparatus for the details of each hose). Normal force levels tested were 1, 10, and 20 N. The maximum normal force level tested was limited by the 5th percentile middle fingertip strength in full interphalangeal joint extension, 20.8 N (Li et al., 2000). Three radii of curvatures tested were small (11 mm), middle (21 or 18 mm), and large (∞: flat object). Aluminum and hose A and B were tested for all three radii of curvatures, whereas hose C and D were tested only for the small or middle radius of curvature, respectively.
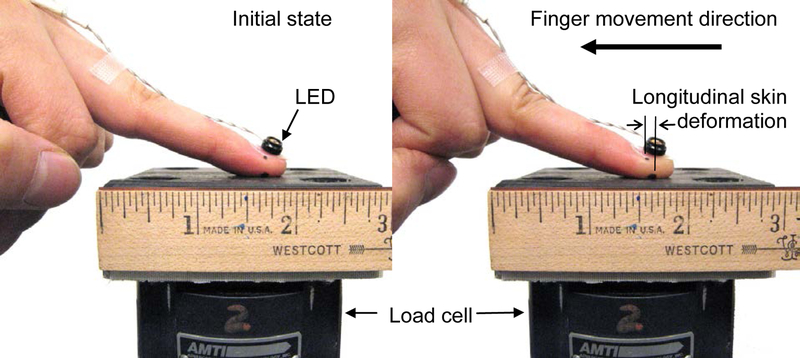
Upon their arrival to the laboratory, subjects washed their hands with soap, rinsed with water, and dried with paper towels 10 minutes prior to testing, to eliminate artifacts due to contaminants (Buchholz et al., 1988; Comaish and Bottoms, 1971). Test objects with different radii of curvature and materials were presented horizontally to subjects in a random order. Subjects pressed down their middle fingertip pad against the test object until normal force matched the target displayed on a computer screen. Then subjects pulled their finger towards the body, while maintaining the normal force at the target (see Figure 3). Normal force and friction force (pulling force) were recorded throughout a trial. Two LEDs were placed on the dorsal part of the middle fingertip and on the test object in order to capture the moment the fingertip started sliding on the test object (see the next two paragraphs for the detailed procedure to determine the moment of finger slip). Friction coefficient was calculated as a ratio of normal force to friction force at the moment the finger slipped, as described previously (Amonton, 1699; Blau, 1996; Comaish and Bottoms, 1971; Coulomb, 1785; Koudine et al., 2000; Laroche et al., 2007; O’Meara and Smith, 2002; Sivamani et al., 2003). Each condition was tested twice. The experiment consisted of a total of 66 trials, lasting for about an hour.
Figure 3.
Fingertip pad making a contact with a test object on top of a load cell (no friction force applied yet) (left), and fingertip pulled towards the body (right). The picture on the right side was taken right before the fingertip pad slipped on the test object. The longitudinal skin deformation was estimated as a horizontal distance between two black dots, one right below the LED and the other one at the contact between the finger pad the test object (right).
The skin deforms in the longitudinal (distal-proximal) direction with friction force. So the movement of the LED on the middle fingertip nail is not the same as the movement of the volar epidermis of the middle fingertip pad. Therefore, a pilot study was performed in which the amount of longitudinal skin deformation was measured for normal force of 1, 10, and 20 N, for three materials (aluminum, hose A, B), and for two subjects (one male, one female). Using a ball point pen, two points were drawn on the lateral side of the middle fingertip, one at the dorsum of the middle fingertip, one at the volar middle fingertip pad. While a subject pressed down the middle fingertip against a test object at a target normal force and slid the fingertip proximally, the lateral side of the middle fingertip was videotaped (as shown in Figure 3).
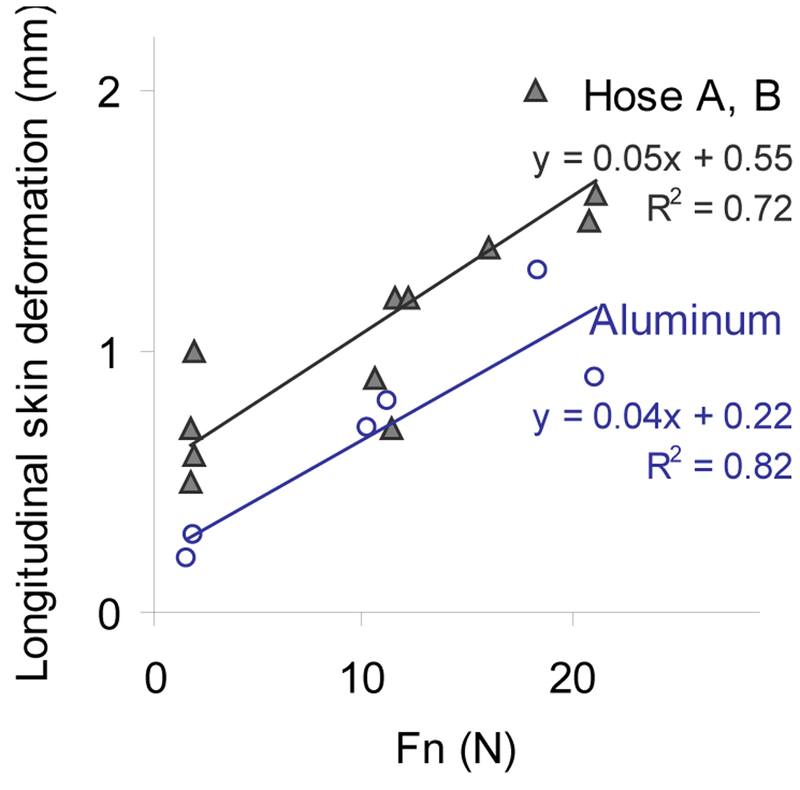
Longitudinal skin deformation is the difference in the horizontal distance between the two points on the lateral fingertip at the beginning when the finger is being pressed down, and at the end when the middle fingertip pad slipped on the test object, as shown in Figure 3. Figure 4 plots longitudinal skin deformation as a function of normal force for aluminum and the two rubber hoses. Longitudinal skin deformation was not significantly different between two subjects (difference = 0.1 ± 0.3 mm, p>0.05) and between hose A and hose B (p>0.05). Thus two subjects’ data were pooled and results for hose A and B were combined in Figure 4. The average longitudinal skin deformation for aluminum was 0.25, 0.75, and 1.1 mm for target normal force of 1, 10, and 20 N, respectively. The average longitudinal skin deformation for the rubber hoses was 0.7, 1.0, and 1.6 mm for target normal force of 1, 10, and 20 N, respectively. Therefore, the LED’s movement greater than these values for each condition was used as a threshold for skin slip.
Figure 4.
Longitudinal skin deformation (see Figure 3) as a function of normal force for rubber hose A and B (up, ▲) and for aluminum (down, O)
2.2. Subjects
Ten subjects (5 males and 5 females) voluntarily participated in this study. Their mean age was 25 ± 6 years for males (ranging from 19 to 35 years), and 26 ± 4 years for females (ranging from 18 to 29 years). Subjects were university students or office workers. No callus, skin thickening or over dryness was observed on their hands. They gave written informed consent prior to testing.
2.3. Apparatus
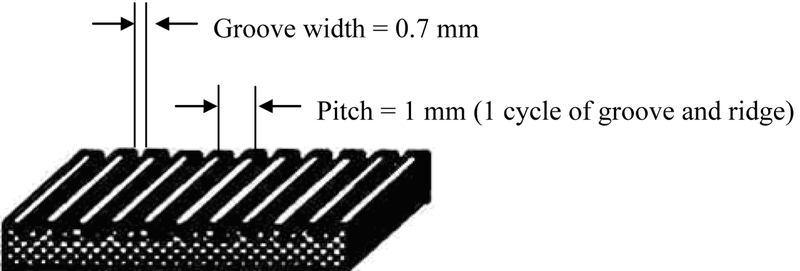
Aluminum rods of different radii were machined and polished with 100 grit sandpaper and then finished with a Maroon very fine Scotch-Brite Pad. The roughness estimated using S-22 Microfinish Comparator was 0.8 μm. Hose A was manufactured by Thermoid/HRD Industries, Inc.. It had a black textured surface with groove width of 0.7 mm and pitch of 0.1 mm (see Figure 5). Its maximum tensile strength was 0.37 MPa. Hose B, C, and D were from an automotive assembly plant. They had a black smooth surface, and they were manufactured by Goodyear Inc.. Hose B is a general radiator hose. It has minimum Modulus of 4.5 MPa, minimum tensile strength of 4.9 MPa after oven aging, and minimum burst strength of 1.9 MPa. Hose C is used at the outlet of a radiator. It has minimum Modulus of 4.5 MPa, minimum tensile strength of 5.3 MPa after oven aging, and minimum burst strength of 2.1 MPa. Hose D is used as a heater hose. The original (outer) radius was 18 mm for hose A, 21 mm for hose B and C, and 11 mm for hose D. To vary the radius of hose A and B, a side of a hose was cut along the long axis and the hose’s inner surface was glued to an aluminum rod of a smaller radius (to simulate the small radius of 11 mm), or to an aluminum plate (to simulate the large radius of curvature, r = ∞).
Figure 5.
Surface character of hose A.
The test object was attached to a load cell which measured normal force and friction force. The fingertip movement was recorded by OptoTrak ® Certus™ Motion Tracking System (NDI) which tracked the positions of LEDs on the fingertip throughout trials. Both force and position data were recorded at 30 Hz.
2.4. Statistical Analysis
Repeated measures analysis of variance was performed to test whether friction coefficient is significantly associated with material, normal force, radius of curvature and their second-order interactions. Subjects were treated as a random variable. For factors that showed significant effects, Tukey pairwise comparisons were performed to evaluate differences between each level. MINITAB ® Release 14 was used to perform statistical analyses.
3. RESULTS
Friction coefficients for the five materials, three normal force levels, and radii of curvature are summarized in Table 1. Material and normal force were found significant for friction coefficient (p<0.01 for both), whereas the radius of curvature was not found significant (p>0.05), as shown in the analysis of variance table in Table 2. None of the second-order interactions were found significant (Table 2).
Table 1.
Mean ± SD friction coefficient for the five materials, three curvatures, and three normal force levels (Fn) (12 subjects pooled)
| Material | Target Fn (N) | Radius of curvature | Measured Fn (N) | COF | Average |
|---|---|---|---|---|---|
| ∞ (flat) | 1.6 ± 0.7 | 0.6 ± 0.4 | |||
| 1 | 21 mm | 1.2 ± 0.3 | 1.0 ± 0.5 | ||
| 11 mm | 1.4 ± 0.5 | 0.9 ± 0.5 | |||
| ∞ (flat) | 10.8 ± 1.3 | 0.4 ± 0.3 | |||
| Aluminum | 10 | 21 mm | 9.9 ± 0.6 | 0.5 ± 0.2 | 0.6 ± 0.4 |
| 11 mm | 10.2 ± 0.8 | 0.4 ± 0.1 | |||
| ∞ (flat) | 19.6 ± 1.9 | 0.4 ± 0.2 | |||
| 20 | 21 mm | 19.1 ± 2.0 | 0.4 ± 0.2 | ||
| 11 mm | 18.7 ± 2.0 | 0.4 ± 0.2 | |||
| ∞ (flat) | 1.3 ± 1.1 | 1.3 ± 0.7 | |||
| 1 | 18 mm | 1.5 ± 0.6 | 1.2 ± 0.5 | ||
| 11 mm | 1.9 ± 1.9 | 1.4 ± 0.6 | |||
| ∞ (flat) | 10.7 ± 1.3 | 0.6 ± 0.2 | |||
| Hose A | 10 | 18 mm | 10.0 ± 1.1 | 0.6 ± 0.3 | 0.8 ± 0.5 |
| 11 mm | 9.8 ± 0.7 | 0.7 ± 0.3 | |||
| ∞ (flat) | 19.5 ± 1.4 | 0.6 ± 0.2 | |||
| 20 | 18 mm | 19.0 ± 1.3 | 0.6 ± 0.3 | ||
| 11 mm | 19.0 ± 1.8 | 0.6 ± 0.2 | |||
| ∞ (flat) | 1.9 ± 1.1 | 1.1 ± 0.5 | |||
| 1 | 21 mm | 1.5 ± 0.6 | 1.1 ± 0.8 | ||
| 11 mm | 1.4 ± 0.5 | 1.2 ± 0.5 | |||
| ∞ (flat) | 10.0 ± 1.1 | 0.8 ± 0.4 | |||
| Hose B | 10 | 21 mm | 9.5 ± 1.0 | 0.7 ± 0.3 | 0.9 ± 0.5 |
| 11 mm | 9.8 ± 0.9 | 0.8 ± 0.2 | |||
| ∞ (flat) | 19.4 ± 1.8 | 0.7 ± 0.3 | |||
| 20 | 21 mm | 18.3 ± 2.1 | 0.7 ± 0.3 | ||
| 11 mm | 17.9 ± 2.1 | 0.7 ± 0.3 | |||
| 1 | 21 mm | 1.6 ± 0.8 | 1.2 ± 0.6 | ||
| Hose C | 10 | 21 mm | 9.8 ± 1.0 | 0.8 ± 0.3 | 0.9 ± 0.5 |
| 20 | 21 mm | 18.5 ± 2.1 | 0.7 ± 0.3 | ||
| 1 | 11 mm | 1.5 ± 0.6 | 1.3 ± 0.6 | ||
| Hose D | 10 | 11 mm | 10.2 ± 1.2 | 0.7 ± 0.3 | 0.9 ± 0.5 |
| 20 | 11 mm | 18.6 ± 1.7 | 0.7 ± 0.3 |
Table 2.
Analysis of variance table for the coefficient of friction data in Table 1
| Source | DF | Adj SS | Adj MS | F | P |
|---|---|---|---|---|---|
| Subject | 9 | 9.5095 | 1.0566 | 7.46 | 0.000 |
| Material | 4 | 4.1757 | 1.0439 | 7.37 | 0.000 |
| Target normal force (Fn) | 2 | 6.2069 | 3.1035 | 21.92 | 0.000 |
| Radius of curvature | 2 | 0.3247 | 0.1623 | 1.15 | 0.318 |
| Material*Fn | 6 | 0.8118 | 0.1353 | 0.96 | 0.455 |
| Material*Radius of curvature | 3 | 0.5028 | 0.1676 | 1.18 | 0.315 |
| Fn*Radius of curvature | 3 | 0.1767 | 0.0589 | 0.42 | 0.742 |
| Error | 609 | 86.2339 | 0.1416 | ||
| Total | 638 |
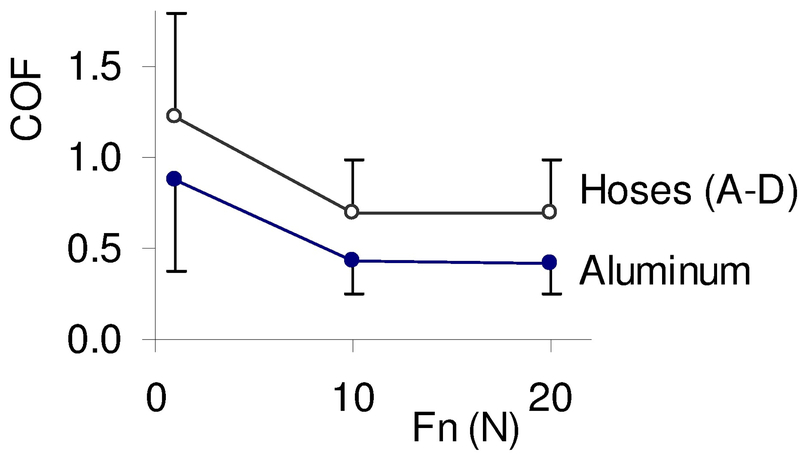
Average friction coefficient was 58% greater for the rubber hoses than for aluminum (p<0.01). However, friction coefficients were not significantly different among the four rubber hoses as shown in the pairwise comparison in Table 3 (p>0.05). Average friction coefficient significantly decreased 46% as normal force increased from 1 to 10 N (material pooled; p<0.01), as shown in Figure 6. The coefficient of friction did not significantly change between normal forces of 10 and 20 N, as shown in Table 3. Friction coefficient significantly varied with subject for rubber hoses (p<0.05). It did not significantly vary with subject for aluminum (p>0.05). Among-subject variance was twice greater than within-subject variance.
Table 3.
Tukey multiple comparisons for the mean coefficient of friction between each material and each normal force level. The coefficient of friction for aluminum (group “a”) was significantly different than those for hoses A, B, C, and D (group “b”). The coefficient of friction for normal force of 1 N (group “a”) was significantly different for those for normal forces of 10 N and 20 N (group “b”). The coefficient of friction was not significantly different between the four hoses or between the normal forces of 10 N and 20 N.
| Factors | Levels | Tukey test |
|---|---|---|
| Material | ||
| Aluminum | a | |
| Hose A | b | |
| Hose B | b | |
| Hose C | b | |
| Hose D | b | |
| Normal force | ||
| 1 N | a | |
| 10 N | b | |
| 20 N | b |
Figure 6.
Friction coefficient between the fingertip and rubber hoses (up) and between the fingertip and aluminum (down) for three different normal force (four rubber hoses and subject pooled)
4. DISCUSSION
4.1. Friction Coefficient vs. Curvature
Friction coefficient in the axial direction was not significantly associated with test object curvature for radius of curvature ranging from 11 mm to ∞ (flat object). Even though object curvature can be associated with less contact area and higher peak pressure for a given normal force (Wu and Dong, 2005), the magnitude of those changes may not have been great enough to significantly alter friction coefficient. Using Equation 1, it can be calculated that the contact area for a test object with the small radius of curvature, 11 mm, is 30% less than that for a flat test object, when the radius of the fingertip (R2) is assumed to be 8 mm (Buchholz and Armstrong, 1991). According to Wu and Dong (2005), the contact area for a test object with the radius of curvature of 12 mm is approximately 29% less than that for a flat test object for a normal force of 1 N. With the difference in contact area, pressure is also expected to differ by 30% on average. When the relationship between the logarithm of friction coefficient and the logarithm of pressure is inverse proportional with a slope of −0.21 as shown in Equation 1 and Figure 1, the friction coefficient is expected to differ by 7% between a flat object versus an object with the radius of curvature of 11 mm. This 7.1% difference in friction coefficient was not experimentally demonstrated.
4.2. Friction Coefficient vs. Material
This paper reports friction coefficients for five selected materials that are prevalent in industry, for three normal force levels and radii of curvature. Friction coefficients were not significantly different among the rubber hoses examined in this study; however, friction coefficients were significantly greater for the rubber hoses than for aluminum. The average friction coefficient for the four rubber hoses was 0.9, whereas the average friction coefficient for aluminum was 0.6. Comparisons of the coefficient of friction values with previous literature are discussed below.
4.3. Friction Coefficient vs. Normal Force
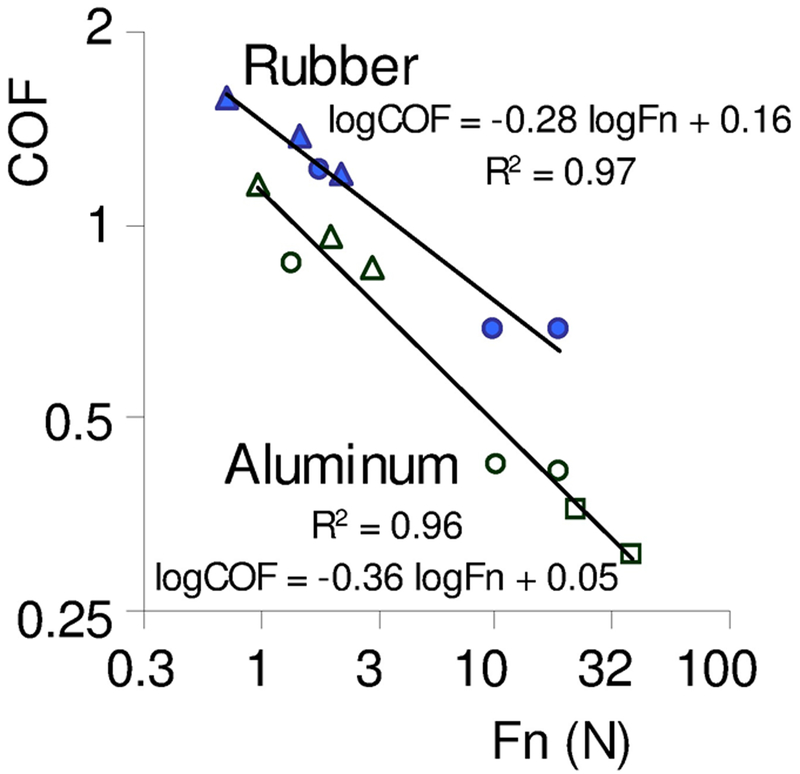
Consistent with previous studies (Bobjer et al., 1993; Buchholz et al., 1988; Comaish and Bottoms, 1971; El-Shimi, 1977; Koudine et al., 2000; Seo et al., accepted; Sivamani et al., 2003), friction coefficients decreased with increasing normal force especially for a low normal force range (Figure 6). Friction coefficients measured in this study were compared to those in previous studies (Buchholz et al., 1988; Seo et al., accepted) for aluminum and rubber (hose) in Figure 7. Normal force on the middle fingertip pad in Seo et al., accepted) was assumed to be an eighth of total normal force on the five fingertips (based on Kinoshita et al., 1996). Friction coefficient values in this study were not significantly different from those in the previous studies when compared for closest normal force levels (p>0.05; see Figure 7).
Figure 7.
Friction coefficient as a function of normal force for rubber (filled symbols) and for aluminum (unfilled symbols) from three studies (“Δ”: Seo et al., accepted, “O”: the present study, “□”: Buchholz et al., 1988) in log scales
Since friction coefficient may vary with normal force, citation of a friction coefficient value should be for the same or similar normal force levels only. In other words, when a biomechanical analysis requires a friction coefficient value, use of a friction coefficient measured for a higher or a lower normal force level than that in the analysis may result in underestimation or overestimation of friction coefficient, respectively. Average normal contact force during maximum torque exertions for females was reported to range from 4 to 22 N for one fingertip (other than the thumb) and from 22 to 45 N for the thumb (Chang et al., 2008; Seo and Armstrong, 2006; Seo et al., 2007; Seo et al., 2008b). For males, it ranges from 10 to 43 N for one fingertip and 39 to 93 N for the thumb (Seo and Armstrong, 2006; Seo et al., 2007; Seo et al., 2008b). Thus, the normal force range for which friction coefficients were measured in this study (1 to 20 N) may cover females’ average normal force levels on the fingertip during maximum torque exertions; however, it may not cover the normal force levels on the thumb or males’ average normal force levels during maximum torque exertions. With an increasing normal force level, however, friction coefficients become less sensitive to normal force as shown in Figure 6, Table 3, and Figure 7 (Note that friction coefficient and normal force in Figure 7 are in log scales). Therefore, to ensure that a normal force level used for measuring a friction coefficient is similar with that for a biomechanical analysis is more critical for low normal forces (less than 10 N) than for high normal forces.
4.4. Friction Coefficient vs. Subject
Friction coefficient between aluminum and finger skin did not vary significantly among subjects; however, friction coefficient between the rubber hoses and finger skin varied significantly among subject. This among-subject variance (0.23 on average) was about twice greater than the average within-subject variance (0.13). It is possible that the surface of rubber hoses could have been polished from repetitive rubbing by the fingertip and changed its friction characteristics over time. However, no consistent trend between friction coefficient and test orders was observed over time. Significant between-subject variance may also be due to difference in perspiration rate and skin roughness between subjects.
4.5. Limitation
This study examined skin friction coefficient in the longitudinal direction only. The coefficient of friction and skin deformation can be different when friction force is in a direction tangential to the radius of curvature or at the right angle to the finger. Future studies should investigate the effect of friction force direction on skin coefficient of friction and skin deformation.
Longitudinal skin deformation was measured only for two subjects in this study. Even though the amount of longitudinal skin deformation was found not significantly different between the two subjects, the relationship between skin deformation and force level still needs to be further investigated for the general population empirically or by simulation. Investigation of skin deformation with friction force can also be used for blister studies (Dai et al., 2006; Polliack and Scheinberg, 2006; Xing et al., 2007) and pressure ulcer treatment (Ohura et al., 2005).
5. CONCLUSIONS
Friction coefficients differ between aluminum and rubber, but not between different rubber hoses examined in this study.
Friction coefficient decreased 46% as normal force increased from 1 to 20 N. It means that maximum coupling with maximum grip should assume the minimum friction coefficient.
Friction coefficient did not vary significantly with object curvature. As shown in the contact area and friction coefficient calculations, changes in the contact area and pressure level were not enough to result in a significant change in friction coefficient, for object curvatures tested in this study.
The citation of friction coefficient data requires care for normal force levels with which it was measured, but not so much for object curvature between 11 mm and infinity.
Statement of Relevance.
This study provides skin friction coefficient data which are needed for design of objects that are manipulated with the hands. The investigation of the effect of object curvature on skin friction coefficient has important implication to ergonomics practices as many objects handled in everyday activities have curved surfaces.
ACKNOWLEDGEMENTS
This project was funded in part by joint funds from the UAW-GM National Joint Committee on Health and Safety and from the NIOSH trainee grant. The results presented herein represent the conclusions and opinions of the authors. Its publication does not necessarily imply endorsement by the International Union, UAW, General Motors Corporation, or NIOSH.
Contributor Information
Na Jin Seo, Sensory Motor Performance Program, Rehabilitation Institute of Chicago.
Thomas J. Armstrong, Department of Industrial and Operations Engineering, University of Michigan
REFERENCES
- Amis AA, 1987. Variation of finger forces in maximal isometric grasp tests on a range of cylinder diameters. Journal of Biomedical Engineering 9, 313–320. [DOI] [PubMed] [Google Scholar]
- Amonton G, 1699, De la resistance causée dans les machines. Historie Acad Roy Sci Paris, 12, pp. 206. [Google Scholar]
- An K-N, Chao EYS, Askew LJ, 1980. Hand strength measurement instruments. Arch Phys Med Rehabil 61, 366–368. [PubMed] [Google Scholar]
- Armstrong TJ, Buckle P, Fine LJ, Hagberg M, Jonsson B, Kilbom A, Kuorinka IA, Silverstein BA, Sjogaard G, Viikari-Juntura ER, 1993. A conceptual model for work-related neck and upper-limb musculoskeletal disorders. Scandinavian Journal of Work Environment and Health 19 (2) 73–84. [DOI] [PubMed] [Google Scholar]
- BLAU PJ, 1996, Friction science and technology. Marcel Dekker, Inc., New York. [Google Scholar]
- Bobjer O, Johansson S-E and Piguet S 1993, Friction between hand and handle. Effects of oil and lard on textured and non-textured surfaces; perception of discomfort. Applied Ergonomics, 24, pp. 190–202. [DOI] [PubMed] [Google Scholar]
- Buchholz B, Frederick LJ and Armstrong TJ, March 1988, An investigation of human palmar skin friction and the effects of materials, pinch force and moisture. Ergonomics, 31(3), pp. 317–325. [DOI] [PubMed] [Google Scholar]
- Buchholz B, Armstrong TJ, 1991. An ellipsoildal representation of human hand anthropometry. Human Factors 33 (4) 429–441. [DOI] [PubMed] [Google Scholar]
- Bullinger HJ, Kern P and Solf JJ, 1979, Reibung Zwischen hand und griff, Forchungs bericht Nr 213 (The effects of materials and surface on the frictional behaviour between hand and handle). Bundesanstalt für Arbeitsschutz und Unfall-forscung, Dortmund, Germany. [Google Scholar]
- Bystrom SE, Fransson-Hall C, 1994. Acceptability of intermittent handgrip contractions based on physiological response. Human Factors 36 (1) 158–71. [DOI] [PubMed] [Google Scholar]
- Bystrom SE, Kilbom A, 1990. Physiological response in the forearm during and after isometric intermittent handgrip. European Journal of Applied Physiology and Occupational Physiology 60 (6) 457–466. [DOI] [PubMed] [Google Scholar]
- Cai C, Perry MJ, Sorock GS, Hauser R, Spanjer KJ, Mittleman MA and Stentz TL, May 2005, Laceration injuries among workers at meat packing plants. Am J Ind Med, 47(5), pp. 403–410. [DOI] [PubMed] [Google Scholar]
- Chang J-H, Ho K-Y, Su F-C, 2008. Kinetic analysis of the thumb in jar-opening activity among female adults. Ergonomics, 51 (6) 843–857. [DOI] [PubMed] [Google Scholar]
- Coulomb C, 1785, Essai sur la Theorie du Frottement, Memoires de Math et de Phys. Acad. Roy. des Sciences, 10, pp. 254–259, Paris. [Google Scholar]
- Dai XQ, Li Y, Zhang M, Cheung JT, 2006. Effect of sock on biomechanical responses of foot during walking. Clinical Biomechanics (Bristol, Avon), 21 (3) 314–21. [DOI] [PubMed] [Google Scholar]
- El-Shimi AF, 1977, In vivo skin friction measurements. J Soc Cosmet Chem, 28, pp. 37–51. [Google Scholar]
- Frederick LJ, Armstrong TJ, 1995. Effect of friction and load on pinch force in a hand transfer task. Ergonomics 38 (12) 2447–2454. [DOI] [PubMed] [Google Scholar]
- Imrhan SN, Farahmand K, 1999. Male torque strength in simulated oil rig tasks: the effects of grease-smeared gloves and handle length, diameter and orientation. Applied Ergonomics, 30, 455–462. [DOI] [PubMed] [Google Scholar]
- KAO SY, 2003, Carpal tunnel syndrome as an occupational disease. Journal of the American Board of Family Practice, 16, 533–542. [DOI] [PubMed] [Google Scholar]
- Kinoshita H, Murase T, Bandou T, 1996. Grip posture and forces during holding cylindrical objects with circular grips. Ergonomics 39 (9) 1163–1176. [DOI] [PubMed] [Google Scholar]
- KOUDINE AA, BARQUINS M, ANTHOINE PH, AUBERST L, and LEVEQUE JL, 2000, Frictional properties of skin: proposal of a new approach. Int J Cosmet Sci, 22, pp. 11–20. [DOI] [PubMed] [Google Scholar]
- KUTLUHAN S, AKHAN G, DEMIRCI S, DURU S, KOYUNCUOGLU HR, OZTURK M and CIRAK B, 2001, Carpal tunnel syndrome in carpet workers. International Archives of Occupational and Environmental Health, 74, 454–457. [DOI] [PubMed] [Google Scholar]
- Laroche C, Barr A, Dong H, Rempel D, 2007. Effect of dental tool surface texture and material on static friction with a wet gloved fingertip. Journal of Biomechanics, 40 (3) 697–701. [DOI] [PubMed] [Google Scholar]
- Lee JW, Rim K, 1991. Measurement of finger joint angles and maximum finger forces during cylinder grip activity. Journal of Biomedical Engineering 13, 152–162. [DOI] [PubMed] [Google Scholar]
- Li ZM, Zatsiorsky VM, Latash ML, 2000. Contribution of the extrinsic and intrinsic hand muscles to the moments in finger joints. Clinical Biomechanics, 15, 203–211. [DOI] [PubMed] [Google Scholar]
- Malker B, 1991, In: Bobjer, O., Johansson, S.E. and Piguet, S., 1993, Friction between hand and handle. Effects of oil and lard on textured and non-textured surfaces; perception of discomfort. Applied Ergonomics, 24, pp. 190–202. [DOI] [PubMed] [Google Scholar]
- Nagashima K, Konz S, 1986. Jar lids: effect of diameter, gripping materials and knurling. In Proceedings of the human factors society 30th annual meeting, 672–674. [Google Scholar]
- National Research Council and Institute of Medicine, 2001. Musculoskeletal Disorders and the Workplace: Low Back and Upper Extremities. Washington, DC, National Academy Press. [PubMed] [Google Scholar]
- Ohura N, Ichioka S, Nakatsuka T, Shibata M, 2005. Evaluating dressing materials for the prevention of shear force in the treatment of pressure ulcers. J Wound Care, 14 (9) 401–4. [DOI] [PubMed] [Google Scholar]
- O’Meara DM, Smith RM, 2002. Functional handgrip test to determine the coefficient of static friction at the hand/handle interface. Ergonomics, 45 (10) 717–731. [DOI] [PubMed] [Google Scholar]
- Polliack AA, Scheinberg S, 2006. A new technology for reducing shear and friction forces on the skin: implications for blister care in the wilderness setting. Wilderness Environ Med, 17 (2) 109–19. [DOI] [PubMed] [Google Scholar]
- Radhakrishnan S, Nagaravindra M, 1993. Analysis of hand forces in health and disease during maximum isometric grasping of cylinders. Medical and Biological Engineering and Computing 31, 372–376. [DOI] [PubMed] [Google Scholar]
- Richter WM, Rodriquez R, Woods KR, Karpinski AP, Axelson PW, 2006. Reduced finger and wrist flexor activity during propulsion with a new flexible handrim. Arch Phys Med Rehabil. 87 (12) December 1643–1647. [DOI] [PubMed] [Google Scholar]
- Rohmert W, 1973. Problems in determining rest allowances. Applied Ergonomics 4 (2) 91–95. [DOI] [PubMed] [Google Scholar]
- Rubin LE, Miki RA, Taksali S, Bernstein RA, 2007. Band saw injury in a butcher. Occup Med (Lond) 57 (5) 383–5. [DOI] [PubMed] [Google Scholar]
- Seo N, Armstrong TJ, 2006. The Effect of Torque Direction on Hand-Object Coupling The American Society of Biomechanics 30th meeting, Blacksburg, VA. [Google Scholar]
- Seo NJ, Armstrong TJ, Drinkaus P, A Comparison of Two Methods of Measuring Static Coefficient of Friction at Low Normal Forces: A Pilot Study. Accepted, Ergonomics. [DOI] [PubMed] [Google Scholar]
- Seo NJ, Armstrong TJ, Ashton-Miller JA, Chaffin DB, 2007. The Effect of Torque Direction and Cylindrical Handle Diameter on the Coupling between the Hand and a Cylindrical Handle. Journal of Biomechanics, 40, 3236–3243. [DOI] [PubMed] [Google Scholar]
- Seo NJ, Armstrong TJ, Chaffin DB, Ashton-Miller JA, 2008a. The Effect of Handle Friction and Inward or Outward Torque on Maximum Axial Push Force. Human Factors: Journal of Human Factors and Ergonomics Society, 50 (2) 227–236. [DOI] [PMC free article] [PubMed] [Google Scholar]
- Seo NJ, Armstrong TJ, Chaffin DB, Ashton-Miller JA, 2008b. Inward Torque and High-Friction Handles Can Reduce Required Muscle Efforts for Torque Generation. Human Factors: Journal of Human Factors and Ergonomics Society, 50 (1) 37–48. [DOI] [PubMed] [Google Scholar]
- Sivamani RK, Goodman J, Gitis NV, and Maibach HI, 2003. Friction coefficient of skin in real-time. Skin Research and Technology, 9, pp. 235–239. [DOI] [PubMed] [Google Scholar]
- Timoshenko SP, Goodier JN, 1970. Theory of Elasticity. Mac Graw Hill Book Company, New York. [Google Scholar]
- WEI SH, HUANG S, JIANG CJ and CHIU JC, 2003. Wrist kinematic characterization of wheelchair propulsion in various seating positions: implication to wrist pain. Clinical Biomechanics (Bristol, Avon), 18, S46–S52. [DOI] [PubMed] [Google Scholar]
- Wu JZ, Dong RG, 2005. Analysis of the contact interactions between fingertip sand objects with different surface curvatures. Proceedings of Institution of Mechanical Engineers. Part H, Journal of engineering in medicine, 219 (2) 90–103. [DOI] [PubMed] [Google Scholar]
- Wu SP, Ho CP, Chi HC, 2008 Ergonomic study of a vertical rope-pulling task from a scaffolding, Ergonomics, Volume 51, Issue 3, 2008, Pages 345–354. [DOI] [PubMed] [Google Scholar]
- Xing M, Pan N, Zhong W, Maibach H, 2007. Skin friction blistering: computer model. Skin Research and Technology, 13 (3) 310–6. [DOI] [PubMed] [Google Scholar]


