Abstract
Ulcerative colitis (UC) and Crohn disease (CD) are the most common forms of inflammatory bowel disease (IBD). Because these subtypes of IBD are characterized by periods of activity and remission, an understanding of the modulation of biochemical markers with the clinical features of IBD or its treatment, may be useful for determining the correct treatment protocol.
This study aimed to evaluate the serum levels of 27 protein biomarkers to determine their association with IBD, correlation with clinical findings of disease, and modulation according to the pharmacologic therapy.
A case–control study was carried out in Zacatecas, Mexico. The 27 protein profiles of serum from 53 participants (23 UC, 11 CD, and 19 controls) were evaluated using the Pro Human Cytokine 27-Plex immunoassay (Bio-Rad).
Considering the controls as a reference, the group with IBD endoscopic activity showed higher serum levels of granulocyte colony-stimulating factor (G-CSF), interleukin 1 receptor antagonist (IL-1Ra), and platelet-derived growth factor BB (PDGF-BB) (P < .05). Interferon-induced protein 10 (IP-10) was associated with extraintestinal symptoms of disease (P = .041). Both PDGF-BB and interleukin 6 (IL-6) showed the strongest correlations with clinical features of IBD. Levels of IL-6, IL-7, and monocyte chemoattractant protein 1 were higher with 5-aminosalicylic acid (5-ASA) + Azathioprine therapy than controls (P < .05). Combined therapy with 5-ASA + Adalimumab led to the strongest changes in marker modulation: IL-4, IL-5, IL-15, and PDGF-BB, were upregulated (P < .05).
Elevated serum levels of G-CSF, IL-1Ra, and PDGF-BB were associated with IBD endoscopic activity, and of IP-10 with extraintestinal manifestations of IBD. Combined therapy of 5-ASA + Adalimumab produced significant upregulation of IL-4, IL-5, IL-15, and PDGF-BB. This information may be useful for deciding on the course of pharmacologic therapy for patients with IBD and for generating new therapy alternatives to improve the outcome of patients with IBD.
Keywords: bowel disease, Crohn disease, cytokine, inflammation, ulcerative colitis
1. Introduction
Inflammatory bowel disease (IBD), which includes ulcerative colitis (UC), Crohn disease (CD), and indeterminate colitis, is a long-term condition that involves inflammation of the gastrointestinal tract.[1] The incidence of IBD has dramatically increased during the 20th century[2]: the annual incidence of UC and CD varies between 19.2 to 24.3 and 12.7 to 20.2 cases per 100,000 inhabitants in Europe and is 6.3 and 20.2 cases per 100,000 inhabitants in Asia and the Middle East,[3,4] respectively.
The etiology of IBD has been studied extensively over recent last decades but the causal factors of this pathology are still unclear.[2] Both UC and CD are characterized by periods of disease activity and remission, and their extraintestinal manifestations (EIMs) include musculoskeletal (peripheral or axial arthropathy), cutaneous (erythema nodosum, pyoderma gangrenosum), ocular (scleritis, episcleritis, uveitis), and hepatobiliary conditions.[5,6]
There is evidence that the EIM associated with active intestinal disease, mostly respond to therapy aimed at controlling disease activity, whereas those that occur whether the condition is inactive or quiescent run with a course independent of treatment for the intestinal disease.[7] Some previous reports indicate that IBD pathogenesis, involves an altered immune response to the gut microbiota in genetically susceptible individuals, and has also been related to specific bacterial infection.[8,9] This altered immunologic function comprises innate and adaptive responses, and the signaling molecules of the immune system such as cytokines, chemokines, and growth factors, play essential roles in the pathophysiology of IBD.[10] The mucosa of patients with CD is dominated by CD4+ lymphocytes with Th1 phenotype, characterized by the production of interferon gamma (IFN-γ) and interleukin 2 (IL-2). In contrast, UC may be dominated by CD4+ lymphocytes with an atypical Th2 phenotype, characterized by the production of transforming growth factor beta (TGF-β) and IL-5, but not IL-4.[8,11,12] The actual treatments used for IBD are directed to reduce and/or modulate this chronic inflammatory process. The primary drugs used are aminosalicylates, corticosteroids, and immune suppressors.[13,14] Mesalazine (5-aminosalicylic acid, 5-ASA) is commonly used for mild to moderately active UC, but it is reported that use of this drug in UC does not represent any additional advantage over Sulfasalazine for the induction of remission in active UC.[4] Antibodies such as Adalimumab, Infliximab, and Certolizumab against the proinflammatory cytokine tumor necrosis factor alpha (TNF-α, a critical target in IBD) have been shown to improve the quality of life of patients with IBD.[15] Similarly thiopurines like Azathioprine show a better response, leading to patient remission when used in combination with anti-TNF-α treatment.[16] Nevertheless, some patients do not respond to biologic therapy because of factors related to some clinical conditions, such as immune system status, among others. For this reason, patient monitoring during therapy is necessary, including evaluation of drug levels in plasma.[15] There are some descriptions of cytokine or chemokine profiles in IBD and their role in the development and course of the illness,[17–19] but there is no consensus regarding which molecules are modulated at circulating levels in UC and CD according to its clinical findings. Moreover, there is no information about the systemic modulation of molecular profiles associated with the pharmacologic therapy or their molecular correlation with the clinical features of IBD. Determining the immune response modulation after treatment and/or correlation with clinical manifestations of disease could be essential for making decisions on the course of the pharmacologic therapy. In this study, the profile of 27 protein markers and their association with IBD and/or its EIM was evaluated. The correlations between serum cytokines, chemokines, and growth factor levels, and their clinical variables, and modulation with IBD treatment were also explored.
2. Materials and methods
2.1. Ethical approval and consent to participate
The study was approved by the Committee on Education, Research, Training and Ethics of the ISSSTE General Hospital for the study of human subjects (Approval ID: OFC226/2016-2-001). All participants provided written informed consent for their participation in the study, in accordance with the Helsinki Declaration.
2.2. Study population
A case–control study was carried out. A total of 53 participants, 34 cases (23 UC and 11 CD) and 19 controls, were enrolled as part of a screening study for adverse IBD outcomes in the Gastroenterological Service of the ISSSTE (Instituto de Seguridad y Servicios Sociales de los Trabajadores del Estado) General Hospital of Zacatecas in Zacatecas, Mexico, between July and October 2016.[20] The case group was integrated by patients with diagnosis of IBD according with clinical endoscopic and pathologic criteria.[21] Clinical activity for each IBD case was identified and classified by appropriate scales (UC Mayo, Crohn disease activity index [CDAI], Truelove–Witts). The endoscopic classification for the IBD group was established using Mayo clinic index and UC endoscopic index of severity.[22,23] The control group included healthy subjects screened for indications of colon cancer in accordance with World Gastroenterology Organization guidelines[24] and with absence of treatment with antiinflammatory drugs. The exclusion criteria for both groups were participants with diagnoses of comorbidities, such as diabetes, autoimmune disease, or with any associated inflammatory or infectious disease, such as tuberculosis or cytomegalovirus, urinary tract infection, among others. Epidemiologic and clinical data, including EIM of the disease and laboratory parameters, were obtained from clinical records.
2.3. Pharmacologic therapy
The control subjects had no indication of any treatment. Pharmacologic therapy and doses for the IBD group were selected according to the guidelines of Diagnosis and treatment of IBD: First Latin American Consensus of the Pan American Crohn's and Colitis Organisation.[25] Accordingly, 17 patients were taking orally monotherapy with a maintenance dose of 1.5 to 2 g 5-ASA per day. Five subjects had biologic therapy (Adalimumab) with maintenance subcutaneous dosage of 40 mg administered every 15 days. Finally, 12 patients were prescribed combined medicine orally of Azathioprine 50 mg + 5-ASA 1.5 g dose per day.
2.4. Sample collection and processing
A blood sample was donned by each participant at the moment of their recruitment and it was collected in 1 tube without anticoagulant. The blood samples were centrifuged at 3000 rpm for 15 minutes at room temperature (RT). Serum was collected, aliquoted, and stored at −80°C until use. Tissue samples from colon segments were obtained from each participant with IBD diagnosis using Multibite biopsy forceps (Boston Scientific, Boston, MA) and embedded in Tissue-Tek OCT Compound (Sakura Finetek, Torrance, CA). For both study groups, the colonoscopy procedure was made according with American Society for Gastrointestinal Endoscopy guidelines.[26] The tissue samples were used for histopathology evaluation to establish the IBD diagnosis.
2.5. Quantification of cytokines, chemokines, and growth factors
Concentrations of 27 biomarkers were analyzed in the study groups using the Pro Human Cytokine 27-Plex immunoassay (Bio-Rad, Hercules, CA) which included the following markers: eotaxin, fibroblast growth factor 2, granulocyte colony-stimulating factor (G-CSF), granulocyte-macrophage CSF (GM-CSF), IFN-γ, IL-1β, IL-1 receptor antagonist (IL-1Ra), IL-2, IL-4, IL-5, IL-6, IL-7, IL-8, IL-9, IL-10, IL-12 (p70), IL13, IL-15, IL-17, interferon-induced protein 10 (IP-10), monocyte chemoattractant protein 1 (MCP-1, also known as MCAF), macrophage inflammatory protein 1 (MIP-1), MIP-1, platelet-derived growth factor BB (PDGF-BB), chemokine ligand 5 (CCL-5 or RANTES), TNF-α, and vascular endothelial growth factor (VEGF).
Serum marker quantification was carried out as follows: 200 μL aliquots of samples were centrifuged at 13,000 rpm for 5 minutes at RT to remove any precipitate. The appropriate analyte standards and samples were diluted in standard diluent and sample diluent, respectively. A standard curve composed of 8 points was prepared from the recombinant analyte standard. Standard curves, blanks, and samples were added to a 96-well plate containing antibodies that were chemically attached to fluorescent-labeled microbeads. The samples were incubated in the dark at RT with constant motion for 1 hour. The plate was washed 3 times, a detection antibody was added to each well, and the plate was incubated in the dark for 30 minutes at RT with shaking, followed by 3 washes. Streptavidin-phycoerythrin was added to each well and the plate was incubated in the dark for 10 minutes at RT with shaking. The beads were resuspended in 125 μL of buffer, and the reaction was quantified using the BioPlex200 Multiplex System platform. Each sample was analyzed in duplicate and the data automatically analyzed and processed using Bio-Plex Manager 6.1 software.
2.6. Data analysis
Statistical analysis of the data was carried out comparing risk factors and clinical and personal characteristics using a Chi-squared or Fisher exact test for categorical variables, and a Student t test, Mann–Whitney U test, or analysis of variance (ANOVA) as appropriate, for numerical variables. ANOVA was coupled to Holm–Sidak or Dunn's method in the multiple comparison procedure. The usefulness of serum IP-10 levels to correctly classify the groups according to the presence of EIM was evaluated using a receiver operating characteristic (ROC) curve analysis. In this analysis, IP-10 sensitivity and specificity values were used to calculate the related area under the curve (AUC) and the positive (PPV) and negative (NPV) predictive values at fixed protein concentration cutoff. The odds ratio (OR) was calculated using the cutoff fixed. To evaluate the relationship between 2 variables a Spearman rank order correlation test was carried out. Heatmaps for the visual representation of the pharmacologic therapies were constructed from the serum levels of proteins of interest using the scale type column for protein concentration and without clustering method. The color ranges were normalized from −1 to 1 in the heatmaper software (http://www.heatmapper.ca/).[27]P-values <.05 were considered as statistically significant. Data analysis was done using the software Sigma Plot v.11 (Systat Software Inc, San Jose, CA) and GraphPad Prism v.5.03 (GraphPad Software, Inc, La Jolla, CA).
3. Results
3.1. Clinical findings
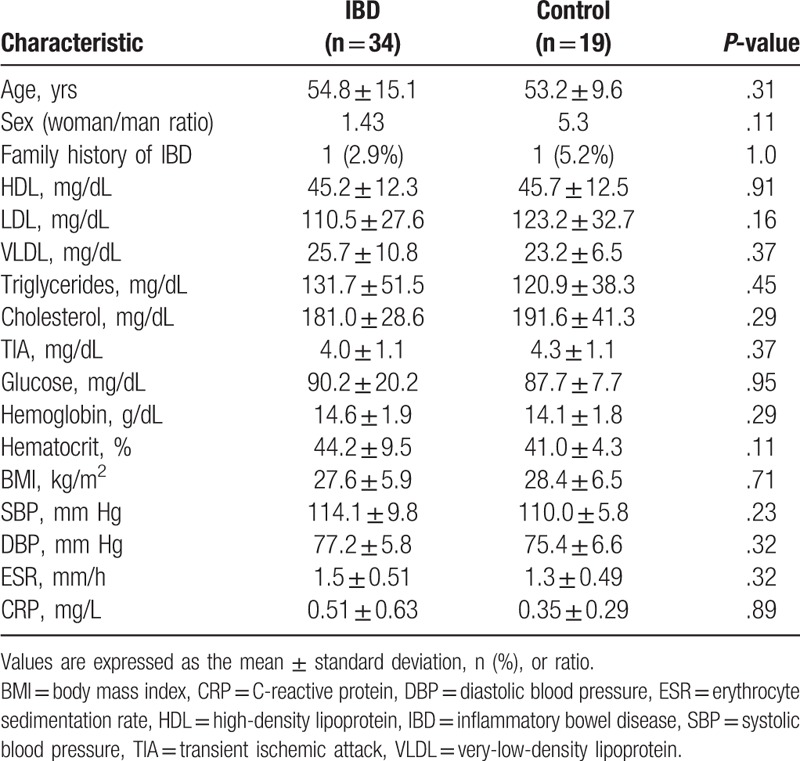
Fifty-three participants were included in the study: 34 patients had diagnoses of IBD (23 with UC and 11 with CD) and the remaining 19 were classified as controls. The general and clinical findings of the study population are shown in Table 1. The mean age was 54.8 years (range: 26–78) for the cases, and 53.2 years (range: 31–49) for the controls (P = .312). There were no differences between study groups in risk factors and/or clinical variables such as sex, family history of IBD, tobacco smoking, body mass index, hemoglobin, glucose, triglycerides, total cholesterol, high-density lipoprotein, low-density lipoprotein, very-low-density lipoprotein (VLDL), or systolic/diastolic blood pressure (P > .05).
Table 1.
General characteristics of the study population.
In the case group, clinical activity in UC using the Truelove–Witts scale was as follows: 14 patients were in remission, 6 showed mild activity, and 3 had moderate activity. For all patients with CD, clinical activity observed using the CDAI scale was CDAI < 150 points (Table 2). Maximal UC endoscopic involvement (E1) was observed in 7 cases, E2 was observed in 8 subjects, and E3 was observed in the remaining 8 UC cases. The location of the lesions in the CD participants according to the Montreal classification was in the small bowel for 3 participants, in the colon for 4 cases, and in the ileum-colonic region for the remaining 4 CD subjects. The UC endoscopic activity by Mayo scale classification showed that 8 cases were in remission, 14 presented mild activity, and 1 had moderate endoscopic activity. The CD endoscopic activity by simple endoscopic scale (CD score of 0) was observed in 5 subjects; scores of 1 and 2 were observed in 5 and 1 CD cases, respectively (Table 2).
Table 2.
Classification of inflammatory bowel disease cases according to clinical and endoscopic scores (n = 34).
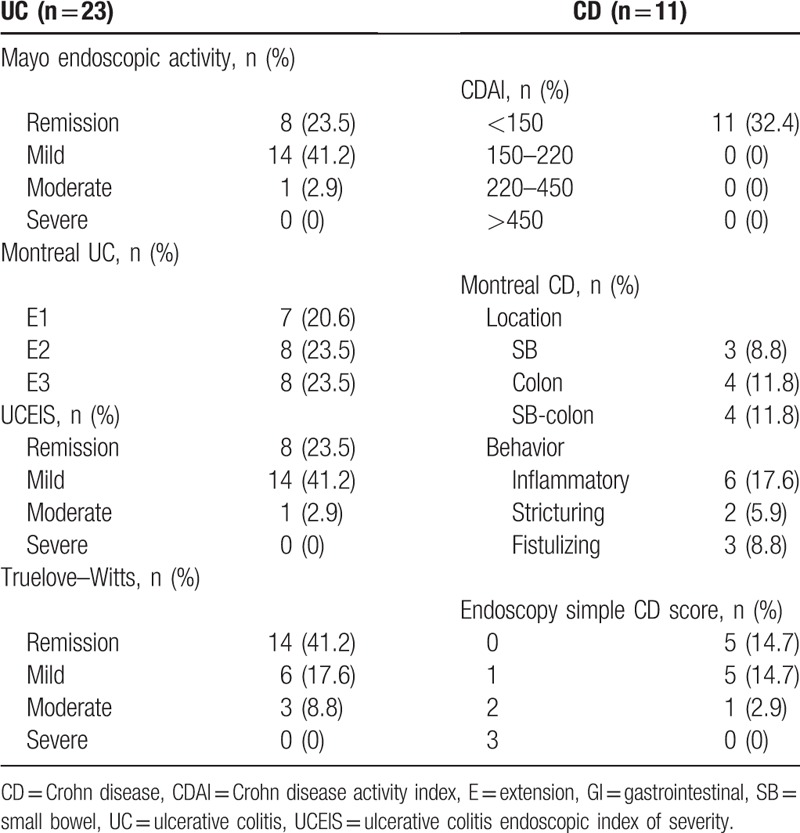
There were 7 cases with EIM (CD: 3; UC: 4); the only EIM identified being arthritis in all 7 subjects. A total of 71.4% of these participants were women. The mean age for the patients with EIM was 56.42 years (range: 31–73 years). The mean of the years of IBD diagnosis was 6.7 (1–11 years) and the average age at the beginning of EIM was 49.1 years (30–65 years).
3.2. Comparison of cytokines/chemokines/growth factors between study groups
To identify differences in the 27 serum biomarkers, protein levels were compared between participants classified as UC, CD, and controls, respectively. The results are shown in Table 3 and Figure 1. Compared with controls, serum levels of eotaxin, IL-15, MCP-1, and PDGF-BB were elevated in patients with CD (P < .05) but there were no elevated serum levels for any of the 27 markers in patients with UC (P > .05). Between IBD group (without classification) and controls, there were differences in serum PDGF-BB (P = .03) but not in any of the other 26 markers (data not shown).
Table 3.
Comparison of the serum protein concentrations between study groups.
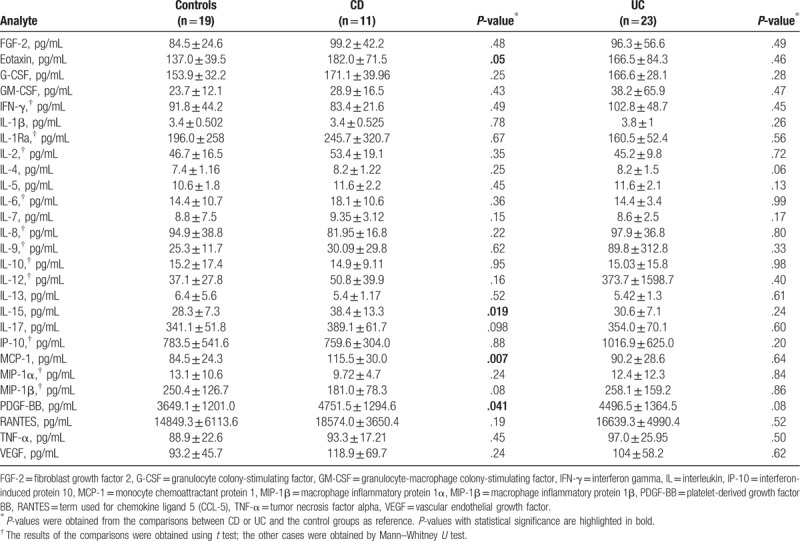
Figure 1.
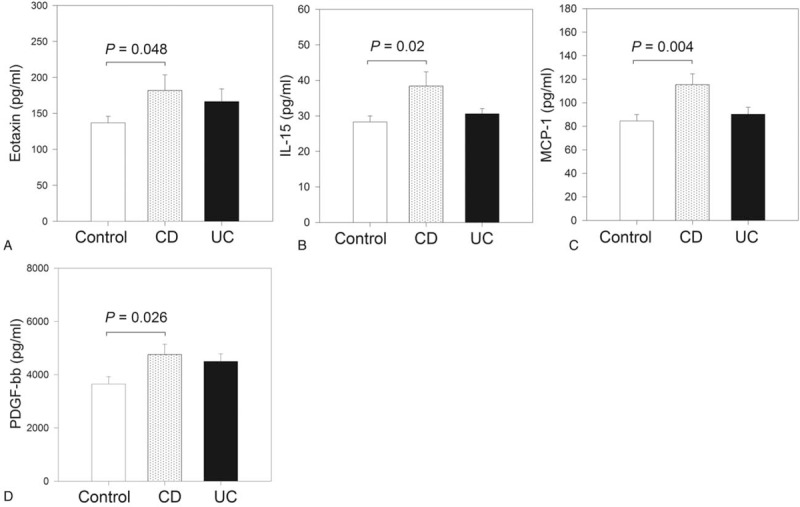
Serum levels of the protein markers with differences between study groups. Study population was stratified as controls (n = 19), Crohn disease (CD; n = 11), and ulcerative colitis (UC; n = 23), and their serum levels of 27 protein markers were compared. Figure shows the results of the markers with differences between groups: Eotaxin (A), interleukin (IL)-15 (B), monocyte chemoattractant protein 1 (MCP-1) (C), and platelet-derived growth factor BB (PDGF-BB) (D).
3.3. Modulation of serum levels of 27 markers according to the presence/absence of endoscopic activity
To evaluate the marker modulation with disease activity, the IBD cases were subclassified according to the presence or absence of endoscopic activity, and serum levels of the 27 markers were evaluated by taking the control group as a reference. The result of this analysis is shown in Figure 2. With the control group as reference, the group with endoscopic activity showed higher serum levels of G-CSF (P = .04), IL-1Ra (P = .04), and PDGF-BB (P = .02). Differences in the serum levels of the remaining 24 markers between study groups were not observed (P > .05).
Figure 2.

Analysis of the association between serum levels of markers of interest and endoscopic activity. Study population was stratified as controls (n = 19), presence of endoscopic activity (n = 22), and absence of endoscopic activity (n = 12), and the serum levels of 27 protein markers were compared between groups. Considering the control group as reference, the group with endoscopic activity shows higher serum levels of granulocyte colony-stimulating factor (G-CSF) (A), interleukin (IL)-1Ra (B), and platelet-derived growth factor BB (PDGF-BB) (C).
3.4. Location of disease and modulation of serum levels of protein markers evaluated
To evaluate if there were differences between the markers included in the study according to the clinic location of disease, IBD cases were subclassified as right colitis, colon, ileum-colonic, terminal ileum, and pancolitis. The serum levels of the 27 markers included in the study were evaluated between IBD location groups with the controls as reference. The result of this analysis is shown in Figure 3. Taking the control group as reference, right colitis shows higher serum levels of IL-15 (P < .05). Serum levels of IL-17 and G-SCF were higher in patients with IBD located in terminal ileum when compared with that observed in controls (P < .05). Modulation of the remaining proteins between groups of colon, ileum-colonic, or pancolitis was not observed (P > .5).
Figure 3.
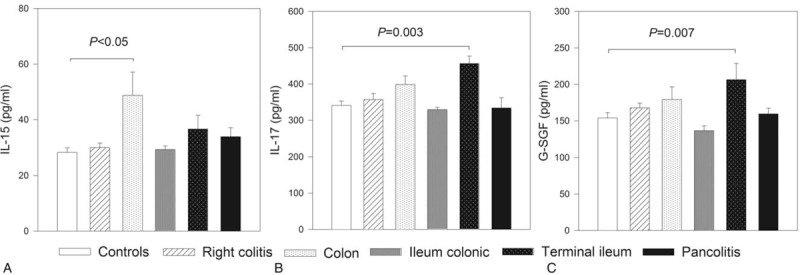
Modulation of the serum protein markers according with location of disease. Study population was stratified according with the location of inflammatory bowel disease, and their serum levels of 27 protein markers were compared. Figure shows the results of the markers with differences between at least 2 groups: interleukin (IL)-15 (A), IL-17 (B), monocyte chemoattractant protein 1 (MCP-1) (C), and granulocyte colony-stimulating factor (G-CSF) (D).
3.5. Association between serum markers and EIM of IBD
To evaluate the association between EIM of disease and the serum levels of the 27 markers included in the study, the IBD cases were stratified according to the presence or absence of EIM and the serum levels of 27 protein markers were compared between study groups. Differences in IP-10 serum levels between groups with and without EIM were identified (P = .04) (Fig. 4). Significant changes in serum levels of the remaining markers between groups with and without EIM were not found (P > .05; data not shown).
Figure 4.
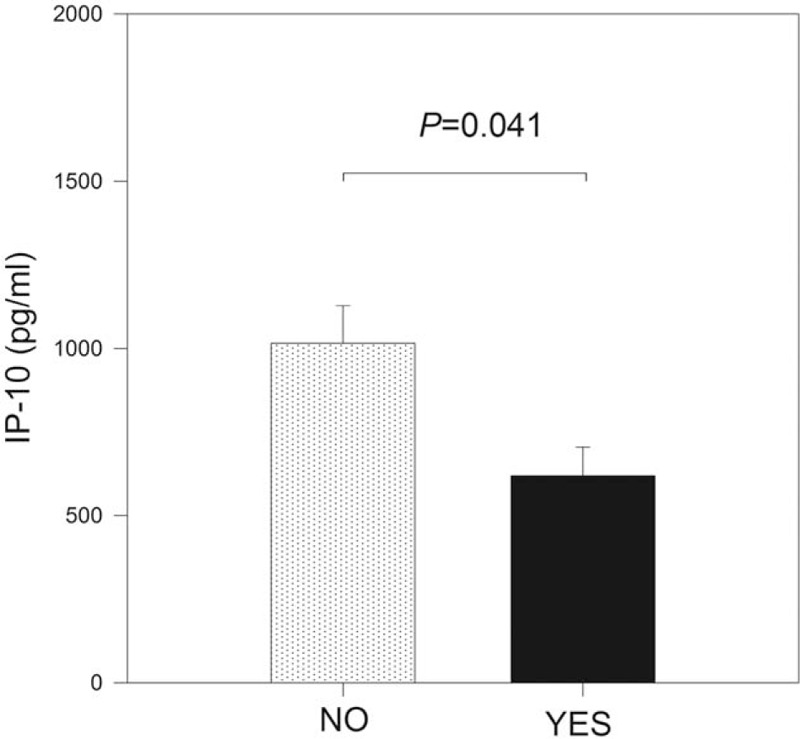
Interferon-induced protein 10 (IP-10) modulation according with extraintestinal manifestations (EIMs) of inflammatory bowel disease (IBD). Study population was stratified according with the presence or absence of EIM of IBD, and the serum levels of 27 protein markers were compared. Figure shows the results of the IP-10. IP-10 serum levels were lower in patients with EIM of IBD (P = .04).
The usefulness of serum IP-10 levels to correctly classify the groups according to the presence of EIM was evaluated using a ROC analysis. With a cutoff value of 653.6 pg/mL, the results showed an AUC of 0.757 (95% confidence interval [CI] = 0.57–0.95) and the sensitivity and specificity values were calculated in 85.7% and 74.1%, respectively. The PPV and NPV were 46.2% and 95.2%, respectively. Serum levels of IP-10 < 653.6 pg/mL significantly increased the odds of the presence of EIM by 17.1 times among the study population (OR = 17.1, 95% CI = 1.7–168.5, P = .007).
3.6. Regulation of cytokines, chemokines, and growth factors according to pharmacologic therapy
To evaluate if the cytokine, chemokine, and growth factor profiles were modulated according to the pharmacologic therapy in patients with IBD, participants were subclassified into therapy groups 5-ASA, 5-ASA + Azathioprine, and 5-ASA + Adalimumab (Table 4). The 27 markers were grouped as chemokines, antiinflammatory, proinflammatory, and growth factors, and their serum levels were compared between groups using the controls as reference. The results are shown in Figure 5.
Table 4.
General description of the treatment of the inflammatory bowel disease group.
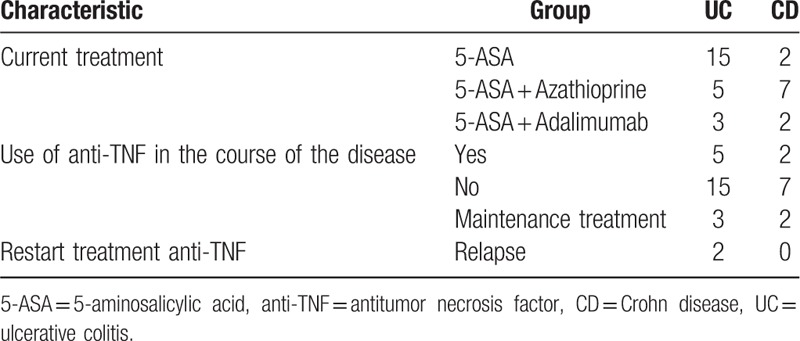
Figure 5.

Serum levels of protein markers in the study population classified according with its pharmacologic therapy. The inflammatory bowel disease cases were classified according their pharmacologic therapy and the markers included in the study were compared between groups. Figure shows the results of these analyses for the markers classified as (A) chemokines, (B) antiinflammatory cytokines, (C) proinflammatory cytokines, and (D) growth factors. P-values were obtained from the comparison of circulating levels of the protein markers evaluated in the study, considering the control group as reference. ∗P < .05, ∗∗P < .005. 5-ASA = 5-aminosalicylic acid, FGF-2 = fibroblast growth factor 2, G-CSF = granulocyte colony-stimulating factor, GM-CSF = granulocyte-macrophage CSF, IFN-γ = interferon gamma, IL = interleukin, IP-10 = interferon-induced protein 10, MCP-1 = monocyte chemoattractant protein 1, MIP-1 = macrophage inflammatory protein 1, PDGF-BB = platelet-derived growth factor BB, RANTES = term used for chemokine ligand 5 (CCL-5), TNF-α = tumor necrosis factor alpha, VEGF = vascular endothelial growth factor.
The IP-10 was differentially modulated by the therapy with 5-ASA (Fig. 5A; P = .03). The chemokines eotaxin and MIP-1β show higher values in the 5-ASA + Azathioprine group than in controls, whereas MCP-1 values were lower (Fig. 5A; P < .05). Compared with controls, the antiinflammatory cytokine IL-4 was upregulated by 5-ASA + Adalimumab (Fig. 5B; P = .007). The proinflammatory cytokines IL-6 and IL-7 were increased in the 5-ASA + Azathioprine group (Fig. 5C; P < .05), whereas IL-15 and IL-5 were elevated in the 5-ASA + Adalimumab treatment (Fig. 5C). Growth factor PDGF-BB was also upregulated for combined therapy 5-ASA + Adalimumab (Fig. 5D). A summary of the treatment findings and modulation of significant cytokines, chemokines, and growth factors in IBD is shown in Figure 6.
Figure 6.
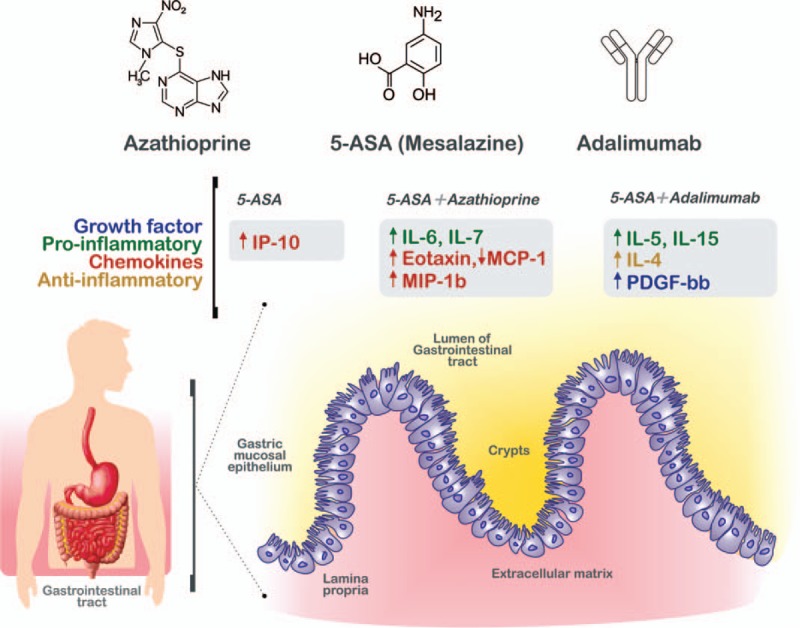
Protein regulation in serum in inflammatory bowel disease (IBD) after treatments. IBD groups were classified according with their pharmacologic therapy as follows: controls, 5-aminosalicylic acid (5-ASA), 5-ASA + Azathioprine, and 5-ASA + Azathiopirine + Adalimumab. The growth factors (blue), proinflammatory cytokines (green), chemokines (orange), and antiinflammatory cytokines (yellow) are displayed in the figure according with their upregulation (arrows up) or downregulation (arrows down) and the pharmacologic therapy group. The up- or downregulation was obtained from the protein serum levels comparisons between IBD cases and controls. Compared with controls, the combined therapy with 5-ASA + Azathiopirine + Adalimumab showed a remarkable effect on the circulating cytokine modulation.
To evaluate the combined effect of the presence of endoscopic activity and the different treatments, in a statistical approximation, only the participants with presence of endoscopic activity were included. These participants were substratified into therapy groups (5-ASA, 5-ASA + Azathioprine, and 5-ASA + Adalimumab) and then, the serum protein levels were compared between groups. There were no differences in serum levels of the proteins evaluated in patients with presence of endoscopic activity between groups of pharmacologic treatment (P > .05; data not shown).
3.7. Analysis of correlation between serum levels of cytokines and clinical findings in IBD
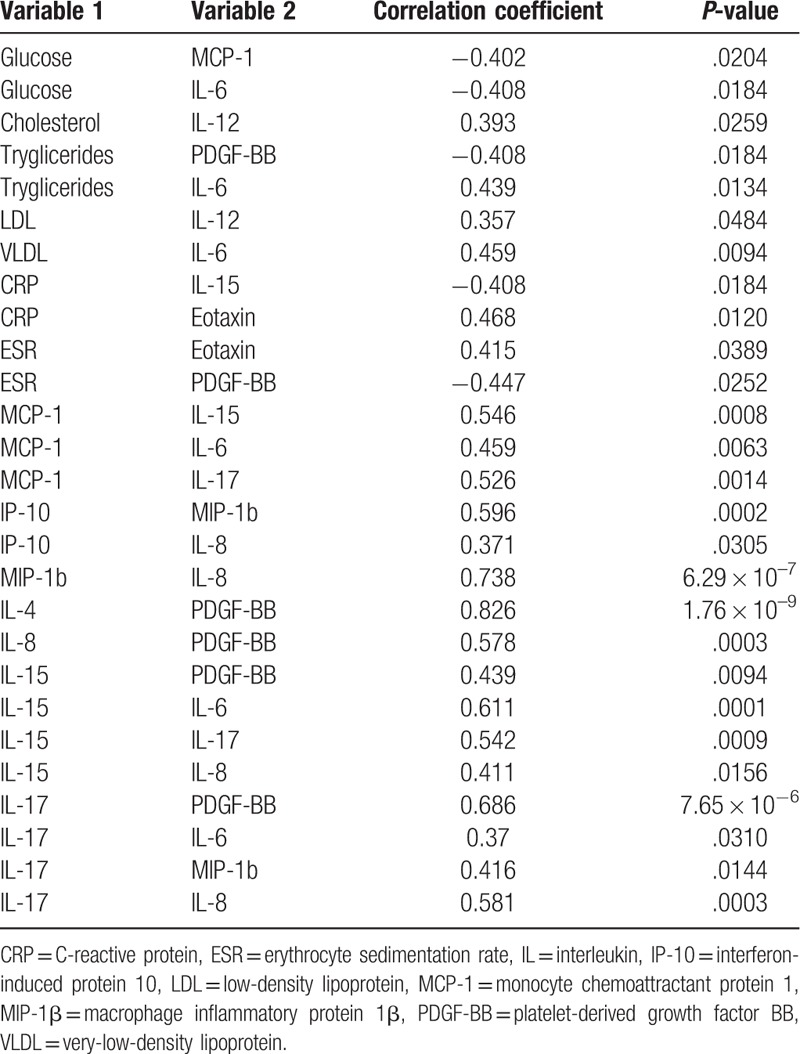
To evaluate the relationship between cytokine, chemokine, and growth factor serum levels and the clinical findings of the participants, a correlation analysis was performed using the Spearman rank order test. There were significant correlations between several pairs of variables (Table 5): positive correlation between IL-6 and production of triglycerides VLDL, MCP-1, IL-15, and IL-17 (r = 0.37–0.611; P < .05); IL-6 serum levels correlated inversely with blood glucose (r = −0.408; P = .018); cytokine IL-8 correlated positively with production of IP-10, MIP-1β, IL-15, and IL-17 (P < .05), with that for MIP-1β being the more significant (r = 0.738; P = 6.29 × 10⁻⁷); growth factor PDGF-BB was correlated positively with IL-4, IL-8, IL-15, and IL-17 (r = 0.439–0.826; P < .005) and negatively with triglycerides (r = −0.408; P = .018) and erythrocyte sedimentation rate (ESR: r = −0.447; P = .025); and C-reactive protein showed significant correlation with IL-15 and eotaxin, respectively. The most significant correlation identified in our study was that observed for IL-4 and PDGF-BB (r = 0.826; P = 1.76 × 10⁻⁹).
Table 5.
Correlation analysis between cytokines and laboratory findings of inflammatory bowel disease cases.
4. Discussion
Finding molecular biomarkers that would allow proper diagnosis, classification, and modulation of IBD according to clinical features and treatment is necessary to counter the growing incidence of IBD worldwide. Accordingly, the present study evaluated the serum levels of 27 protein biomarkers and their comparison between study groups, their association with endoscopic activity, location and EIM of the disease, and their correlation with pharmacologic therapy and clinical findings.
Our results showed that compared with controls, serum IL-15, eotaxin, MCP-1, and PDGF-BB levels were higher in CD but not in patients with UC. There are some descriptions of cytokine profiles in IBD[8,11,18,19,28,29] but as those studies are not completely comparable with ours, only some similarities can be delineated. IL-15 enhances local T-cell activation, proliferation, and proinflammatory cytokine production by T cells and macrophages.[29] Elevated production of IL-15 by macrophages and peripheral blood mononuclear cells in inflamed mucosa in IBD has been observed previously.[29,30] Kirman and Nielsen demonstrated that IL-15 was detected in the sera of patients with UC but not in patients with CD. These apparent differences between studies may be explained because the characteristics of the patients and their treatment, since it has been shown the IL-15 production is modulated both by the IBD activity and with pharmacologic therapy of the patients.[30] Mir et al, in a study with 72 patients with IBD (35 UC and 37 CD), identified higher serum levels of eotaxin in CD and UC than in control subjects.[31] These results are similar to our results observed for patients with CD, and even though the eosinophil counts were not included in our study, our results support the hypothesis that high eotaxin levels may have a direct relation on eosinophil function and therefore in IBD pathogenesis, as has been suggested previously.[31] Using multiplex arrays, Korolkova et al evaluated the serum profile of 38 markers (cytokines, chemokines, and growth factors) in patients with UC and Crohn colitis (CC).[19] They reported increased serum levels of eotaxin, growth-regulated oncogene, and TNF-α in patients with UC, INF-γ, IL-6, and IL-7 in CC, and IL-8 in both UC and CC groups, respectively. Similar to our results, they also reported no cytokine difference between UC and CC[19]; however, the wide divergence in protein profiles identified between studies emphasizes the importance of considering differences between study designs and features of the participants during data interpretation.
In our study, taking the controls as reference, the subjects with endoscopic activity showed higher serum levels of G-CSF, IL-1Ra, and PDGF-BB. These 3 proteins have been associated previously with active IBD.[32,33] The G-CSF tissue levels are elevated in IBD and it has been demonstrated that therapeutic administration of G-CSF induces remission in a subgroup of patients with CD, supporting the role of a deficiency in innate immunity as the initiating event in CD.[9,32,34] High levels of IL-1 were associated with active UC and CD, and correlated with the severity of inflammation.[32] Moreover, a mucosal imbalance of intestinal IL-1 and IL-1Ra has been reported in patients with IBD, suggesting that insufficient production of endogenous IL-1Ra may contribute to the pathogenesis of chronic gut inflammation.[32] Serum PDGF is considered to be a marker of angiogenesis and inflammation[33]; in agreement with our results, it has been postulated that high levels of PDGF are an indicator of active IBD regardless of disease type, and are associated with its clinical and endoscopic activity.[33] Furthermore, in our study PDGF-BB also correlated with serum levels of IL-4, IL-8, IL-15, and IL-17 (Table 5), reflecting several molecular pathways acting in parallel in IBD.
Many patients with IBD develop extraintestinal symptoms.[5] The EIM may involve any organ and have a detrimental impact on the patient's functional status and quality of life.[5] In our study serum levels of IP-10 < 653.6 pg/mL significantly increased the odds of the presence of EIM by 17.1 times among the study population. Cytokine IP-10 is secreted from a variety of cells, including monocytes, endothelial cells, and fibroblasts, in response to interferon[35]; it is a chemoattractant for human monocytes and T cells, it promotes T-cell adhesion to endothelial cells, and may also participate in the regulation of angiogenesis during inflammation and tumorigenesis.[35] Singh et al detected increased expression of IP-10 and its receptor in mesenteric lymph nodes and inflamed colons of IL-10−/− mice using semiquantitative reverse transcription polymerase chain reaction analysis.[36] The CD-like colitis in this model was associated with increased serum amyloid A, IL-6, and Th1 cytokine levels, along with weight loss, all of which could be abrogated by anti-IP-10 treatment.[36] The authors concluded that anti-IP-10 treatment can successfully impede the development of IBD and that serum amyloid A levels can reveal the intensity of colitis. There are no studies that evaluate the association of circulating IP-10 and EIM of IBD, this study being the 1st to report this association. Because the only EIM identified in our study was arthritis, additional studies are needed to evaluate cytokine profiles related to other extraintestinal symptoms of IBD.
In this study, after combined therapy with 5-ASA + Adalimumab, the cytokines IL-4, IL-5, and IL-15 were upregulated (Figs. 5 and 6). While the elevation of antiinflammatory IL-4 and IL-5 could indicate an active Th2 response,[37,38] the increased serum levels of IL-15 may be related with a local IL-15 production by macrophages and/or other mononuclear cells in inflamed mucosa from patients with IBD.[29,30] Therefore, in addition to 5-ASA + Adalimumab, the presence of moderate and severe disease activity in IBD may lead to increased percentage of IL-15 expressing PBMC, which might be induced by in vivo cell activation and can lead to elevation of released IL-15 in serum.[30] Interestingly, the chemokines eotaxin and MIP-1β were higher in the 5-ASA + Azathioprine group, whereas MCP-1 values were lower than in controls. These results suggest that treatment with Adalimumab may have a role in the modulation of serum levels of these chemokines. Regarding, growth factor modulation according to the therapy, only PDGF-BB showed differences between groups; PDGF induces the growth of intestinal smooth muscle, whereas IL-1β and TNF-α induce the expression of PDGF-RB.[39] In addition to its role as an indicator of IBD activity, in our study PDGF-BB was correlated positively with 4 cytokines (IL-4, IL-8, IL-15, and IL-17) and negatively with triglycerides and ESR. In particular, only a few reports exist on PDGF-BB and its relation with IBD. Interestingly, 2 of the strongest correlations identified in our study were between PDGF-BB and both IL-4 (r = 0.826; P = 1.76 × 10⁻⁹) and IL-17 (r = 0.686, P = 7.65 × 10⁻⁶). Considering their role in inflammation and angiogenesis,[33] as well as the number of correlations with cytokines, the laboratory data, and the highly significant P-values obtained in our study, additional studies are needed to evaluate their participation in several steps of the pathogenesis of IBD. Besides PDGF-BB, cytokine IL-6 (a target for therapy and a marker of active IBD[40]) was more correlated with other laboratory findings (glucose, triglycerides, VLDL, MCP-1, IL-15, and IL-17), indicating that routine clinical data may predict the course of these markers and therefore the course of IBD. Finally, some study limitations should be highlighted:
-
1.
The number of patients with IBD included in the study was low and therefore validation of the proteins that differed between study groups is needed in an independent cohort.
-
2.
The determination of parameters to evaluate the diagnostic test (cutoffs, predictive values, sensitivity, specificity, etc) was not considered for that markers associated with IBD and/or with endoscopic activity because the differences were identified only between controls and CD (but not vs UC), or between controls and patients with IBD with the presence of active disease (but not vs patients with IBD without endoscopic activity). Therefore to eliminate, the groups without differences from the analyses may have a reduced applicability and/or could induce a misinterpretation of the results.
-
3.
Because this was a cross-sectional study, we could only identify markers modulated according with the treatment but not which of them are related with response to the treatment. Further longitudinal studies are needed to evaluate that association.
5. Conclusion
In this work, elevated serum levels of G-CSF, IL-1Ra, and PDGF-BB were associated with IBD endoscopic activity, whereas serum levels of IP-10 < 653.6 pg/mL significantly increased the odds of the presence of EIM by 17.1 times among the study population. Both PDGF-BB and IL-6 showed the strongest correlations with clinical features of IBD, such as ESR, triglycerides, glucose, and VLDL. We also observed a higher effect with the use of Adalimumab in combinatory therapy with 5-ASA on the modulation of production of IL-4, IL-5, IL-15, and PDGF-BB. This information may be useful for deciding on the course of pharmacologic therapy for patients with IBD and for generating new therapy alternatives to improve the outcome of patients with IBD.
Acknowledgments
The authors thank all the study participants. We also recognize the Department of Education of the General Hospital of ISSSTE for technical and logistic support. First author expresses her deepest gratitude to Maria de la Luz Fierro Ramos for having been and still being the best example in her life: as long as the memory exists, the presence will last and the feelings will remain eternal rest in peace mom.
Author contributions
Conceptualization: Margarita L. Martinez-Fierro, Fabiola Trejo-Vazquez, Gabriela A. Villela-Ramirez.
Data curation: Margarita L. Martinez-Fierro, Gabriela A. Villela-Ramirez, Ivan Delgado-Enciso, Iram P. Rodriguez-Sanchez.
Formal analysis: Margarita L. Martinez-Fierro, Gabriela A. Villela-Ramirez.
Funding acquisition: Margarita L. Martinez-Fierro, Idalia Garza-Veloz.
Investigation: Margarita L. Martinez-Fierro, Idalia Garza-Veloz, Maria del Refugio Rocha-Pizaña, Edith Cardenas-Vargas, Fabiola Trejo-Vazquez, Virginia Flores-Morales.
Methodology: Idalia Garza-Veloz, Fabiola Trejo-Vazquez, Gabriela A. Villela-Ramirez, Ivan Delgado-Enciso, Iram P. Rodriguez-Sanchez.
Project administration: Margarita L. Martinez-Fierro, Fabiola Trejo-Vazquez.
Resources: Miguel A. Cid-Baez, Yolanda Ortiz-Castro.
Software: Miguel A. Cid-Baez.
Supervision: Idalia Garza-Veloz, Edith Cardenas-Vargas, Fabiola Trejo-Vazquez, Virginia Flores-Morales, Yolanda Ortiz-Castro.
Visualization: Miguel A. Cid-Baez.
Writing – original draft: Margarita L. Martinez-Fierro, Idalia Garza-Veloz, Maria del Refugio Rocha-Pizaña.
Writing – review & editing: Idalia Garza-Veloz, Maria del Refugio Rocha-Pizaña, Edith Cardenas-Vargas, Miguel A. Cid-Baez, Fabiola Trejo-Vazquez, Virginia Flores-Morales, Gabriela A. Villela-Ramirez, Ivan Delgado-Enciso, Iram P. Rodriguez-Sanchez, Yolanda Ortiz-Castro.
Margarita L Martinez-Fierro orcid: 0000-0003-1478-9068.
Footnotes
Abbreviations: AUC = area under the curve, BMI = body mass index, CCL-5 = chemokine ligand 5, CD = Crohn disease, CDAI = Crohn disease activity index, CRP = C-reactive protein, DBP = diastolic blood pressure, E = extension, ESR = erythrocyte sedimentation rate, FGF-2 = fibroblast growth factor 2, G-CSF = granulocyte colony-stimulating factor, GI = gastrointestinal, GM-CSF = granulocyte-macrophage CSF, HDL = high-density lipoprotein, IBD = inflammatory bowel disease, IFN-γ = interferon gamma, IL = interleukin, IP-10 = interferon-induced protein 10, LDL = low-density lipoprotein, MCP-1 = monocyte chemoattractant protein 1, MIP-1 = macrophage inflammatory protein 1, PDGF-BB = platelet-derived growth factor BB, ROC = receiver operating characteristics, SB = small bowel, SBP = systolic blood pressure, SD = standard deviation, TIA = transient ischemic attack, TNF-α = tumor necrosis factor alpha, UC = ulcerative colitis, UCEIS = ulcerative colitis endoscopic index of severity, VEGF = vascular endothelial growth factor, VLDL = very-low-density lipoprotein.
How to cite this article: Martinez-Fierro ML, Garza-Veloz I, Rocha-Pizaña MR, Cardenas-Vargas E, Cid-Baez MA, Trejo-Vazquez F, Flores-Morales V, Villela-Ramirez GA, Delgado-Enciso I, Rodriguez-Sanchez IP, Ortiz-Castro Y. Serum cytokine, chemokine, and growth factor profiles and their modulation in inflammatory bowel disease. Medicine. 2019;98:38(e17208).
This study was funded in part by the CONACyT grants INFR-2014-01-225520 and INFR 2015-01-254106. The manuscript edition/publishing costs were covered in part with UAMH y CS support (to CA-UAZ-207).
The authors have no conflicts of interest to disclose.
References
- [1].Arase S, Watanabe Y, Setoyama H, et al. Disturbance in the mucosa-associated commensal bacteria is associated with the exacerbation of chronic colitis by repeated psychological stress; Is that the new target of probiotics? PLoS One 2016;11:e0160736. [DOI] [PMC free article] [PubMed] [Google Scholar]
- [2].Molodecky NA, Kaplan GG. Environmental risk factors for inflammatory bowel disease. Gastroenterol Hepatol 2010;6:339–46. [PMC free article] [PubMed] [Google Scholar]
- [3].Gomez-Gomez GJ, Masedo A, Yela C, et al. Current stage in inflammatory bowel disease: what is next? World J Gastroenterol 2015;21:11282–303. [DOI] [PMC free article] [PubMed] [Google Scholar]
- [4].Sutherland L, MacDonald JK. Oral 5-aminosalicylic acid for induction of remission in ulcerative colitis. Cochrane Database Syst Rev 2003;CD000543. [DOI] [PubMed] [Google Scholar]
- [5].Vavricka SR, Schoepfer A, Scharl M, et al. Extraintestinal manifestations of inflammatory bowel disease. Inflamm Bowel Dis 2015;21:1982–92. [DOI] [PMC free article] [PubMed] [Google Scholar]
- [6].Su CG, Judge TA, Lichtenstein GR. Extraintestinal manifestations of inflammatory bowel disease. Gastroenterol Clin N Am 2002;31:307–27. [DOI] [PubMed] [Google Scholar]
- [7].Carter MJ, Lobo AJ, Travis SP. Guidelines for the management of inflammatory bowel disease in adults. Gut 2004;53Suppl 5:V1–6. [DOI] [PMC free article] [PubMed] [Google Scholar]
- [8].Geremia A, Biancheri P, Allan P, et al. Innate and adaptive immunity in inflammatory bowel disease. Autoimmu Rev 2014;13:3–10. [DOI] [PubMed] [Google Scholar]
- [9].Bamias G, Corridoni D, Pizarro TT, et al. New insights into the dichotomous role of innate cytokines in gut homeostasis and inflammation. Cytokine 2012;59:451–9. [DOI] [PMC free article] [PubMed] [Google Scholar]
- [10].Baumgart DC, Carding SR. Inflammatory bowel disease: cause and immunobiology. Lancet 2007;369:1627–40. [DOI] [PubMed] [Google Scholar]
- [11].Monteleone G, Caprioli F. T-cell-directed therapies in inflammatory bowel diseases. Clin Sci (Lond) 2010;118:707–15. [DOI] [PubMed] [Google Scholar]
- [12].Podolsky DK. Inflammatory bowel disease. N Engl J Med 2002;347:417–29. [DOI] [PubMed] [Google Scholar]
- [13].Danese S. New therapies for inflammatory bowel disease: from the bench to the bedside. Gut 2012;61:918–32. [DOI] [PubMed] [Google Scholar]
- [14].Dahlen R, Magnusson MK, Bajor A, et al. Global mucosal and serum cytokine profile in patients with ulcerative colitis undergoing anti-TNF therapy. Scand J Gastroenterol 2015;50:1118–26. [DOI] [PubMed] [Google Scholar]
- [15].Naviglio S, Giuffrida P, Stocco G, et al. How to predict response to anti-tumour necrosis factor agents in inflammatory bowel disease. Expert Rev Gastroenterol Hepatol 2018;12:797–810. [DOI] [PubMed] [Google Scholar]
- [16].Axelrad JE, Roy A, Lawlor G, et al. Thiopurines and inflammatory bowel disease: current evidence and a historical perspective. World J Gastroenterol 2016;22:10103–17. [DOI] [PMC free article] [PubMed] [Google Scholar]
- [17].Muzes G, Molnar B, Tulassay Z, et al. Changes of the cytokine profile in inflammatory bowel diseases. World J Gastroenterol 2012;18:5848–61. [DOI] [PMC free article] [PubMed] [Google Scholar]
- [18].Singh UP, Singh NP, Murphy EA, et al. Chemokine and cytokine levels in inflammatory bowel disease patients. Cytokine 2016;77:44–9. [DOI] [PMC free article] [PubMed] [Google Scholar]
- [19].Korolkova OY, Myers JN, Pellom ST, et al. Characterization of serum cytokine profile in predominantly colonic inflammatory bowel disease to delineate ulcerative and Crohn's colitides. Clin Med Insights Gastroenterol 2015;8:29–44. [DOI] [PMC free article] [PubMed] [Google Scholar]
- [20].Trejo-Vazquez F, Garza-Veloz I, Villela-Ramirez GA, et al. Positive association between leptin serum levels and disease activity on endoscopy in inflammatory bowel disease: a case-control study. Exp Ther Med 2018;15:3336–44. [DOI] [PMC free article] [PubMed] [Google Scholar]
- [21].Lennard-Jones JE. Classification of inflammatory bowel disease. Scand J Gastroenterol Suppl 1989;170:2–6. [DOI] [PubMed] [Google Scholar]
- [22].Travis SP, Schnell D, Krzeski P, et al. Developing an instrument to assess the endoscopic severity of ulcerative colitis: the Ulcerative Colitis Endoscopic Index of Severity (UCEIS). Gut 2012;61:535–42. [DOI] [PMC free article] [PubMed] [Google Scholar]
- [23].D’Haens G, Sandborn WJ, Feagan BG, et al. A review of activity indices and efficacy end points for clinical trials of medical therapy in adults with ulcerative colitis. Gastroenterology 2007;132:763–86. [DOI] [PubMed] [Google Scholar]
- [24].Winawer SJ, Krabshuis J, Lambert R, et al. Cascade colorectal cancer screening guidelines: a global conceptual model. J Clin Gastroenterol 2011;45:297–300. [DOI] [PubMed] [Google Scholar]
- [25].Yamamoto-Furusho JK, Bosques-Padilla F, de-Paula J, et al. Diagnosis and treatment of inflammatory bowel disease: First Latin American Consensus of the Pan American Crohn's and Colitis Organisation. Rev Gastroenterol Mex 2017;82:46–84. [DOI] [PubMed] [Google Scholar]
- [26].Shergill AK, Lightdale JR, et al. American Society for Gastrointestinal Endoscopy Standards of Practice Committee. The role of endoscopy in inflammatory bowel disease. Gastrointest Endosc 2015;81:1101-21.e1-13. [DOI] [PubMed] [Google Scholar]
- [27].Babicki S, Arndt D, Marcu A, et al. Heatmapper: web-enabled heat mapping for all. Nucleic Acids Res 2016;44:W147–53. [DOI] [PMC free article] [PubMed] [Google Scholar]
- [28].Fuss IJ, Neurath M, Boirivant M, et al. Disparate CD4+ lamina propria (LP) lymphokine secretion profiles in inflammatory bowel disease. Crohn's disease LP cells manifest increased secretion of IFN-gamma, whereas ulcerative colitis LP cells manifest increased secretion of IL-5. J Immunol 1996;157:1261–70. [PubMed] [Google Scholar]
- [29].Liu Z, Geboes K, Colpaert S, et al. IL-15 is highly expressed in inflammatory bowel disease and regulates local T cell-dependent cytokine production. J Immunol 2000;164:3608–15. [DOI] [PubMed] [Google Scholar]
- [30].Kirman I, Nielsen OH. Increased numbers of interleukin-15-expressing cells in active ulcerative colitis. Am J Gastroenterol 1996;91:1789–94. [PubMed] [Google Scholar]
- [31].Mir A, Minguez M, Tatay J, et al. Elevated serum eotaxin levels in patients with inflammatory bowel disease. Am J Gastroenterol 2002;97:1452–7. [DOI] [PubMed] [Google Scholar]
- [32].Cominelli F, Pizarro TT. Interleukin-1 and interleukin-1 receptor antagonist in inflammatory bowel disease. Aliment Pharmacol Ther 1996;10Suppl 2:49–53. [DOI] [PubMed] [Google Scholar]
- [33].Krzystek-Korpacka M, Neubauer K, Matusiewicz M. Platelet-derived growth factor-BB reflects clinical, inflammatory and angiogenic disease activity and oxidative stress in inflammatory bowel disease. Clin Biochem 2009;42:1602–9. [DOI] [PubMed] [Google Scholar]
- [34].Alsultan A, Sokol RJ, Lovell MA, et al. Long term G-CSF-induced remission of ulcerative colitis-like inflammatory bowel disease in a patient with glycogen storage disease Ib and evaluation of associated neutrophil function. Pediatr Blood Cancer 2010;55:1410–3. [DOI] [PubMed] [Google Scholar]
- [35].Angiolillo AL, Sgadari C, Taub DD, et al. Human interferon-inducible protein 10 is a potent inhibitor of angiogenesis in vivo. J Exp Med 1995;182:155–62. [DOI] [PMC free article] [PubMed] [Google Scholar]
- [36].Singh UP, Singh S, Taub DD, et al. Inhibition of IFN-gamma-inducible protein-10 abrogates colitis in IL-10-/- mice. J Immunol 2003;171:1401–6. [DOI] [PubMed] [Google Scholar]
- [37].Lloyd CM, Snelgrove RJ. Type 2 immunity: expanding our view. Sci Immunol 2018;3: [DOI] [PubMed] [Google Scholar]
- [38].Huang Y, Chen Z. Inflammatory bowel disease related innate immunity and adaptive immunity. Am J Transl Res 2016;8:2490–7. [PMC free article] [PubMed] [Google Scholar]
- [39].Nair DG, Miller KG, Lourenssen SR, et al. Inflammatory cytokines promote growth of intestinal smooth muscle cells by induced expression of PDGF-Rbeta. J Cell Mol Med 2014;18:444–54. [DOI] [PMC free article] [PubMed] [Google Scholar]
- [40].Allocca M, Jovani M, Fiorino G, et al. Anti-IL-6 treatment for inflammatory bowel diseases: next cytokine, next target. Curr Drug Targets 2013;14:1508–21. [DOI] [PubMed] [Google Scholar]


