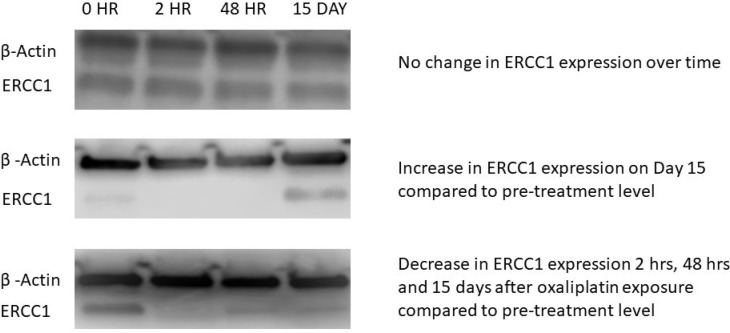
Figure 4. Western blot (WB) images from three representative patients.
The superior band indicates expression of a housekeeping gene, β -actin, which served as internal control. The inferior band represents the gene of interest, ERCC1. Each patient had expression analyzed at four time points: 0, 2, 48 Hour and 15 Day. The first patient did not show change in ERCC1 expression over time, assessed by band intensity remaining equal over time. Patient 2 had an increase in ERCC1 band intensity at the 15 Day time point compared to 0 Hour, while Patient 3 showed the maximum ERCC1 expression at 0 Hour. In this case, there was a decrease in expression over the other three time points.

