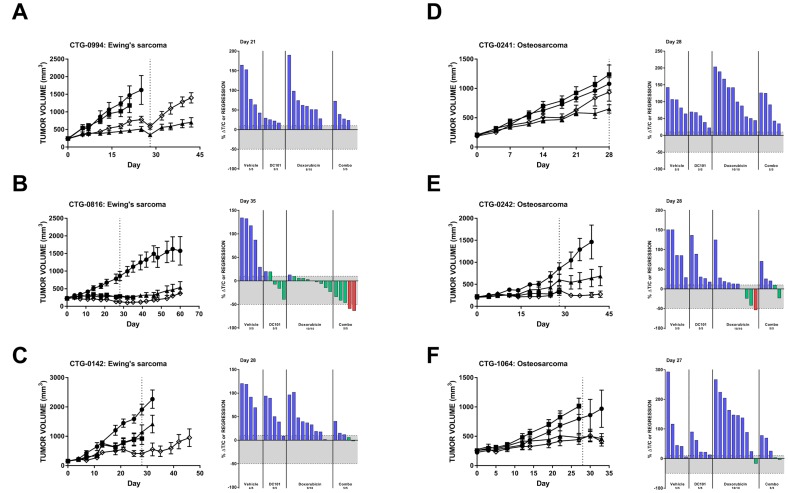
Figure 5. Preclinical models of Ewing’s sarcoma and osteosarcoma respond to DC101 alone and in combination with cytotoxic chemotherapy.
All animals were treated with control (●), DC101 (▲), doxorubicin (■), or the combination (◇). Treatment began at Day 0 and ended at Day 28 (dotted vertical line). For each panel, tumor growth curves are shown on the left and waterfall plots on the right. Error bars represent SEM. Waterfall plots were generated on the day indicated in the top left corner of the image (generally, the last day the majority of vehicle animals were still evaluable). Blue bars: progressive disease (PD; ≥10% ΔT/C). Green bars: stable disease (SD; <10% ΔT/C and <50% regression). Red bars: partial regression (PR; ≥50% regression and tumor volume ≥ 14 mm3).

