Abstract
To screen differentially expressed proteins in the blood dairy cows with inactive ovaries caused by a negative energy balance and to determine the roles of the identified proteins in the development of inactive ovaries.Holstein cows at 14 to 21 days postpartum in an intensive dairy farm were examined for their energy balance (EB) status by blood β-hydroxybutyrate (BHBA) and assigned to the inactive ovary (IO) group (n = 50) and the normal oestrus control (CON) group (n = 50) at 60 to 90 days postpartum by means of the oestrus manifestation, rectal examination and B-ultrasound examination. Fourteen differentially expressed proteins from 61 proteins in the plasma of dairy cows with IOs were identified by iTRAQ/LC-MS/MS and GO, KEGG, and PATHWAY analysis. Eleven expressed proteins were upregulated, and 3 expressed proteins were downregulated. Among the 10 differentially expressed proteins verified by Western blot or ELISA, the relative expression levels of ALDOB, IGFBP2, ITIH3 and LDHB in mixed samples and single samples were consistent with the proteomic protein results. PKM2, GPX3, ALDOB, RBP4 and AHSG were significantly different between the two groups (P < 0.05); APOA4 and SPAM1 were not significantly different (P > 0.05) but were still downregulated in the ovarian resting group. This study confirmed that 14 plasma differential proteins in the inactive ovaries of postpartum dairy cows were associated with follicular development, and these findings provide a foundation for further research on the mechanism and prevention of inactive ovaries in dairy cows.
Subject terms: Proteomics, Animal physiology
Introduction
Inactive ovaries in the postpartum period constitutes an abnormal condition in the oestrous cycle of dairy cows, resulting in no follicles on the surfaces of ovaries or no follicular deviation1. Inactive ovaries during early lactation in dairy cows are usually classified as Type I anoestrus postpartum based on follicular dynamics, in which the follicles may appear on the surface of the ovary but follicular growth stops1. This type of anoestrus increases the number of postpartum days and prolongs the calving interval of dairy cows when the anestrus time is long, from 60 to 90 days postpartum, which may bring about large economic losses to dairy farms. Follicular development in the oestrous cycle of cows is regulated by gonadotropins2–4. Gonadotrophin-dependent follicular development is closely related to follicle-stimulating hormone (FSH)2, luteinizing hormone (LH), oestradiol (E2)3 and progesterone (P4)4. Nutrition affects the hypothalamic-pituitary-ovarian axis directly through dietary nutrients or metabolic intermediates and then affects follicular development5. LH pulse disorder occurs in dairy cows with hypoglycaemia or a negative energy balance6. The reason for this association is unclear: if it occurs in the hypothalamus, it is considered to cause LH pulse and ovulation failure by inhibiting GnRH secretion, and if the negative balance affects the ovaries7, an increased supply of energy and nutrients can stimulate follicular development8. Studies have shown that nutrients act on the ovaries and stimulate follicular development. Glucose, fatty acids and several metabolic hormones can directly stimulate follicles to function6.
At present, the proteomic profiles of inactive ovaries postpartum due to negative energy balance (NEB) in dairy cows are unclear. Proteomics technology has been widely used in the dairy industry since the rapid development of new iTRAQ reagents and labelling strategies to expand the identification capacity of differentially expressed proteins by protein bioinformatics for the discovery and elucidation of disease markers9. Min et al.10 applied iTRAQ technology to study heat stress in cows. Dai et al.11 studied the mechanism of basal feed plus a high feed diet in the regulation of milk synthesis. Zhang et al.12 used iTRAQ technology to screen differential proteins between the endometrium and plasma of cows with endometritis. In view of the literature and our previous studies, we speculate that certain proteins in the blood of cows may change at 60–90 days postpartum, but to date, these proteins have not been reported. Therefore, in this study, iTRAQ/LC-MS/MS was used to explore differential proteins the blood of dairy cows with inactive ovaries during early lactation to determine the roles of these proteins in the development of inactive ovaries, thus providing a foundation for the establishment of an early warning system regarding inactive ovaries.
Materials And Methods
Experimental animals
All methods and animal care were performed in accordance with the relevant guidelines and regulations of the Institute of Animal Science, Chinese Academy of Agricultural Sciences. The study was carried out in an intensive dairy farm of Heilongjiang Province, China, in accordance with the relevant guidelines and regulations of the Institute of Animal Science, Chinese Academy of Agricultural Sciences. The cows were fed a total mixed ration diet during early lactation, which consisted of 8–9 kg of concentrate, 19 kg of silage, 3.5–4.0 kg of hay, and 350 g fat. Their nutritional level on a DM basis included 55.60% DM, 16% crude protein, 7.322 MJ∙kg−1 net lactation production, 5.60% fat, 39.10% NDF, 20.30% ADF, 180 g of calcium, and 116 g of phosphorus. The basal diet was formulated to meet the nutrient requirements according to the Feeding Standards of Dairy Cattle in China.
The experimental animal selection and grouping are shown in Fig. 1 according to the criteria of postpartum inactive ovaries and oestrus in dairy cows13–15.
Figure 1.
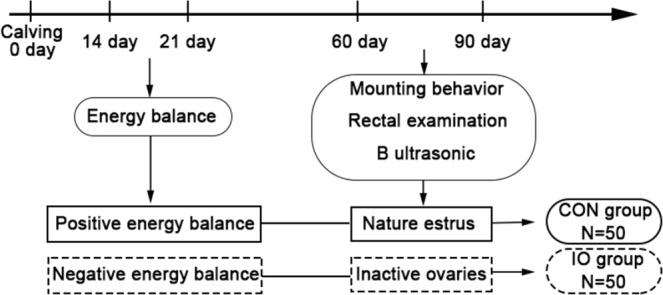
Schematic of the selection of experimental animals.
The inactive ovary (IO) group (n = 50): Cows with a high plasma BHBA content (>1.20 mmol/L) at 14–21 days postpartum were in a negative energy balance state, were tracked to 60 days postpartum and had no oestrous signs13,14. A rectal examination and B-ultrasound examination were performed at 60–90 days postpartum by a trained professional; if the cow had no follicular development or follicular retardation (less than 4 mm) for 7 days13,15, it was assigned to the IO group, and then, all background data, including age, parity, milk yield, disease, and body condition, were collected. If these cows underwent oestrus between 60 and 90 days postpartum and experienced other diseases after calving, they were removed from the IO group.
The normal control oestrus (CON) group (n = 50): Cows with a low plasma BHBA content (>1.20 mmol/L) at 14–21 days postpartum were in a positive energy balance state, tracked to 60 days postpartum and had spontaneously oestrous signs13,14. The results of the rectal examination, B-ultrasonography, and follicular diameter measurements of the oestrous cows were the opposite of those in the cows with inactive ovaries13,15. The oestrous cows were assigned to the CON group, and then, the background data collected for the IO group were also collected for the CON group. If these cows had other diseases after calving, they were removed from the CON group.
The background data of the two groups of cows, including days in milking, follicular diameter (mm), parity, number of artificial inseminations, body condition score, milk yield (kg/day) 60–90 days after calving, and BHBA (mmol/L) at 14–21 days and 60–90 days after calving, are shown in Table 1.
Table 1.
Basic information for the experimental animals in the two groups of cows.
| Parameters (Mean (SD)) | IO (N = 50) | CON (N = 50) | P |
|---|---|---|---|
| Days of milking | 72.90 (8.322) | 73.82 (9.064) | 0.735 |
| Follicular diameter (mm) | 2.25 (1.37) | 10.82 (2.30) | 0.000 |
| Parity | 3.06 (1.21) | 3.19 (1.35) | 0.755 |
| Number of artificial inseminations | 1.75 (0.91) | 1.19 (1.06) | 0.607 |
| Body condition score | 2.66 (0.25) | 2.80 (0.18) | 0.053 |
| Milk yield (kg/day) | 34.16 (12.53) | 33.04 (7.11) | 0.721 |
The inactive ovary group (IO); the healthy normal oestrous control group (CON).
Sample collection
Blood samples from the two groups of dairy cows were collected via the tail vein before morning feeding. Ten millilitres of blood samples per cow were collected with EDTANa2 and centrifuged at 3000 × g/min for 10 minutes to obtain plasma samples. Fifteen plasma samples from each group were used in the proteomics analysis, while the other 35 blood samples were allocated to biochemical analysis and verification of plasma differential proteins by ELISA or Western blot (WB).
Biochemical analysis
The BHBA, AST, NEFA, and GLU levels in the plasma of the two groups of cows were measured by commercial test kits (CHINA, Yicheng Company) and an automatic biochemical analyser (CHINA, Nanjing Jiancheng Bioengineering Institute).
iTRAQ labelling proteomics experiments
Five plasma samples from each group were mixed to become a mixed sample, to which lysis buffer was added. The mixed plasma sample was placed under sonication for 60 seconds with a frequency of 0.2 seconds and an amplitude of 22%, extracted at room temperature for 30 minutes, and centrifuged at 20 °C for 20 minutes at 15,000 × g. The supernatant was then carefully collected to determine its protein concentration by the Bradford method15. In this experiment, a human plasma/plasma high abundance protein kit (MERCK, USA) was used to remove high abundance proteins in the mixed supernatant samples for iTRAQ-labelling proteomics experiments. Three mixed samples per group (IO group: IO1, IO2, and IO3; CON group: CON1, CON2, and CON3) were used as biological replicates at two time points; the IOs were 116–118, and the CONs were 114–115. Protein solution (200 μg) from a mixed supernatant sample was used to perform proteolysis according to the instructions of the iTRAQ-labelling kit (4352135, AB Sciex).
LC-MS/MS mass spectrometry analysis
Pre-separator
Reversed-phase chromatography separation under high pH conditions: The mixed labelled sample with 100 μL of solution (98% ddH2O, 2% acetonitrile, pH = 10) was centrifuged at 14,000 × g for 20 minutes to obtain the supernatant for separation. Separation was carried out using 400 μL of enzymatically decomposed BSA (column temperature, 45 °C; detection wavelength, 214 nm). A total of 100 μL of the prepared sample was loaded at a flow rate of 0.7 mL/min16.
Nanoscale reversed-phase chromatography-Q Exactive for protein analysis: The fraction obtained by reversed-phase separation under high pH conditions was reconstituted with 20 μL of 2% methanol and 0.1% formic acid and centrifuged at 12,000 × g for 10 minutes. The supernatant was then drawn to load 10 μL of the supernatant sample. The loading pump flow rate was 350 nL/min, for 15 minutes, and the separation flow rate was 350 nL/min15.
Data analysis
SPSS software (IBM, V 20.0) was used to compare the basic information of the two groups of experimental cows and their blood sample results by means of the independent sample t-test.
Mass spectrometry of iTRAQ was performed by Thermo Q-Exactive mass spectrometry, and the resulting mass spectrometry raw files were processed using the commercial software Proteome Discoverer 1.4 (Thermo) and the UniProt database (http://www.uniprot.org). The differential proteins were screened using mass spectrometry software (Thermo) based on a 5% FDR17.
Functional analysis of differentially expressed proteins using bioinformatics
This study used the DAVID (https://david.ncifcrf.gov/) online data software for GO analysis, the STRING (https://string-db.org/) online software for the protein network interaction analysis and, mainly, the KEGG Pathway database application with the DAVID online data software for signalling pathway analysis18.
Differential protein verification
Differential proteins screened by the proteomics and bioinformatics experiments were verified by an Western Blot (WB) analysis, in which a differential protein was resolved in one lane of a gel. As in the proteomics experiments, six mixed samples was used in WB analysis. The WB experiment was performed according to the conventional method19. Based on the bioinformatics analysis of differential protein function, four representative differential proteins were selected for WB verification, in which 30 μg per sample was loaded in a lane for WB experiments. The verification of a differential protein was conducted be means of gel electrophoresis; one gel contained 9 lanes, in addition to the lane for the protein marker. For the experiment, 6 mixed samples was used to WB analysis. The differential proteins included fructose-bisphosphate aldolase (ALDOB), insulin-like growth factor binding protein (IGFBP-2), inter-alpha-trypsin inhibitor heavy chain H3 (ITIH3), and L-lactate dehydrogenase (LDHB), which were immunoblotted using respective monoclonal antibodies (18065-ap-1 ALDOB antibody from US Proteintech, US; ab4244 IGFBP-2 antibody from UK Abcam, 21247-ap-1 ITIH3 antibody from US Proteintech, and SAB2101329 LDHB antibody from Japan SIGMA). The density of the grey bands of differential proteins in the WB were calculated using ImageJ2x (Rawak Software, Inc. Germany) and subjected to statistical analysis by the independent sample t-test in SPSS software (IBM, V20.0).
Commercial ELISA kits were used to measure the concentrations of the five differentially expressed proteins in 15 untreated plasma samples per group. These differential proteins were α-2-HS glycoprotein (JEB-15398 ELISA kit), apolipoprotein A4 (JEB-15400 ELISA kit), fructose diphosphate aldolase (JEB-15230 ELISA kit), glutathione peroxidase, hyaluronidase (JEB-15220 ELISA kit), pyruvate kinase and retinol binding protein (JEB-15397 ELISA kit). These ELISA kits were from Nanjing Jinyibai Company in China. Differences between the two groups were compared using SPSS software (IBM, V20.0) and the independent sample t-test.
Innovation statement
Inactive ovaries in postpartum dairy cows constitute an economically important reproductive condition that can reduce the efficiency of cow production and reproduction, and this condition has garnered a large amount of attention in the dairy industry of many developed countries. If any step after calving is abnormal between the follicular growth, selection and ovulation stages and fertilization and pregnancy stages, infertility may ensue. The literature and our previous studies have found that a negative energy balance in postpartum cows can increase the rate of anestrus at 50–60 days postpartum, which may be related to metabolic disorders, such as abnormal metabolism of lipids, amino acids and steroids. The authors of this paper have put forth the hypothesis that the expression of some proteins in the blood of cows with inactive ovaries are different from that of normal oestrus cows at 60–90 days after calving. Thus, in this study, proteomics technology was used to screen differential proteins in the blood of cows with inactive ovaries. Our study found that in the blood of cows with inactive ovaries at 60–90 days postpartum, there were changes in 61 proteins, 14 of which were related to inactive ovaries.
Results
Background information and biochemical parameters
According to the background information of the CON group and IO group in Table 1, there was no significant difference in days of milking, age, number of artificial inseminations, body condition score, or milk yield between the two groups of cows. However, the plasma biochemical parameter levels of the inactive ovary group (IO) and the healthy control group are shown in Table 2. There was a significant difference in the plasma BHBA concentration between the two groups of cows at 14–21 days postpartum, suggesting that the cows in the IO group experienced a negative energy balance at 14–21 days postpartum, although there was no difference in plasma BHBA levels of the two groups of cows at 60–90 days after calving. The energy balance in the two groups of dairy cows is briefly summarized in Fig. 1.
Table 2.
Plasma levels of energy and liver function parameters in the two groups of cows.
| Indicator | IO (N = 35) | CON (N = 35) | P |
|---|---|---|---|
| AST (U/L) | 92.06 ± 17.95 | 98.94 ± 23.26 | 0.189 |
| Glu (mmol/L) | 3.75 ± 1.40 | 3.65 ± 0.55 | 0.686 |
| NEFA (mmol/L) | 0.21 ± 0.17 | 0.26 ± 0.15 | 0.150 |
| BHBA (mmol/L) (14–21days postpartum) | 1.56 (0.14) | 0.57 (0.22) | 0.000** |
| BHBA (mmol/L) (60–90 days postpartum) | 0.61 (0.14) | 0.48 (0.16) | 0.073 |
β-hydroxybutyrate (BHBA), Aspartate aminotransferase (AST), glucose (GLu), Nonesterified fatty acid (NEFA).
Screening and identification of differential proteins
In this study, a calculation of the average difference of multiples was used to screen differential proteins. In Table 3, 61 differentially expressed proteins were obtained according to a mean fold change >1.2, mean fold change <0.8, and p < 0.05. The proteins with a mean fold change >1 were upregulated in the IO group, while the proteins with a mean fold change <1 were downregulated.
Table 3.
Differentially expressed proteins between the two groups of cows.
| NO. | ID | ABBREVIATION | MFC | U/D | P value |
|---|---|---|---|---|---|
| 1 | Q2TBU0 | HP | 0.36 | D | 0.000 |
| 2 | A0JNP2 | SCGB1D | 0.48 | D | 0.000 |
| 3 | P23805 | CGN1 | 0.54 | D | 0.000 |
| 4 | P02676 | FGB | 0.55 | D | 0.000 |
| 5 | A5PJE3 | FGA | 0.56 | D | 0.000 |
| 6 | Q3SZZ9 | FGG | 0.58 | D | 0.000 |
| 7 | E1BJF9 | SAA | 0.62 | D | 0.000 |
| 8 | Q3SYR8 | IGJ | 0.63 | D | 0.000 |
| 9 | O97941 | C3 | 0.65 | D | 0.000 |
| 10 | A6QQ07 | BTD | 0.65 | D | 0.003 |
| 11 | A6QNW3 | PIGR | 0.69 | D | 0.000 |
| 12 | A5D984 | PKM2 | 0.69 | D | 0.000 |
| 13 | P01966 | HBA | 0.70 | D | 0.000 |
| 14 | G3X8D7 | GPX3 | 0.70 | D | 0.000 |
| 15 | Q9TS74 | PEI | 0.71 | D | 0.000 |
| 16 | Q17QH1 | APOF | 0.72 | D | 0.000 |
| 17 | A5D9D2 | C4BPA | 0.73 | D | 0.000 |
| 18 | Q9BGI3 | PRDX2 | 0.74 | D | 0.000 |
| 19 | K7QM77 | ATP6 | 0.75 | D | 0.000 |
| 20 | F1MR06 | ATP1A3 | 0.78 | D | 0.020 |
| 21 | P01030 | C4 | 0.78 | D | 0.019 |
| 22 | Q1RMN8 | IGL | 0.79 | D | 0.000 |
| 23 | Q6Q0I7 | F11 | 0.79 | D | 0.011 |
| 24 | Q3SZZ7 | FGL1 | 0.79 | D | 0.000 |
| 25 | M5FJT7 | GNPTG | 0.80 | D | 0.016 |
| 26 | A6QNW7 | CD5L | 0.80 | D | 0.000 |
| 27 | Q32L76 | SAA4 | 0.80 | D | 0.000 |
| 28 | F1MXS8 | COL3A1 | 0.81 | D | 0.005 |
| 29 | Q3ZCH5 | AZGP1 | 1.20 | U | 0.000 |
| 30 | Q3Y5Z3 | ADIPOQ | 1.20 | U | 0.000 |
| 31 | F1MTT3 | F12 | 1.20 | U | 0.000 |
| 32 | P56652 | ITIH3 | 1.21 | U | 0.000 |
| 33 | F1N3Q7 | APOA4 | 1.21 | U | 0.000 |
| 34 | A9UIB1 | PON1 | 1.23 | U | 0.000 |
| 35 | P80195 | GLYCAM1 | 1.23 | U | 0.001 |
| 36 | P18902 | RBP4 | 1.24 | U | 0.000 |
| 37 | A5PK73 | ALDOB | 1.24 | U | 0.000 |
| 38 | P34955 | SERPINA1 | 1.24 | U | 0.000 |
| 39 | P15467 | RNASE4 | 1.26 | U | 0.000 |
| 40 | A8DBT6 | CD14 | 1.27 | U | 0.000 |
| 41 | Q9XSG3 | IDH1 | 1.28 | U | 0.008 |
| 42 | Q862Q0 | SPM | 1.28 | U | 0.002 |
| 43 | F1N2P8 | IGFBP2 | 1.29 | U | 0.000 |
| 44 | B0JYN3 | LDHB | 1.29 | U | 0.000 |
| 45 | Q3SZH5 | AGT | 1.31 | U | 0.000 |
| 46 | P12763 | AHSG | 1.32 | U | 0.000 |
| 47 | P19034 | APOC2 | 1.32 | U | 0.000 |
| 48 | K4JDT2 | A2M | 1.36 | U | 0.000 |
| 49 | F1MNV5 | KNG1 | 1.37 | U | 0.000 |
| 50 | P33433 | HRG | 1.38 | U | 0.013 |
| 51 | Q28065 | C4bBPA | 1.42 | U | 0.000 |
| 52 | P25326 | CTSS | 1.43 | U | 0.000 |
| 53 | K7QF89 | BoLA | 1.43 | U | 0.000 |
| 54 | Q58D62 | FETUB | 1.49 | U | 0.000 |
| 55 | Q58DL9 | PLTP | 1.51 | U | 0.008 |
| 56 | O02659 | MBL | 1.60 | U | 0.001 |
| 57 | Q0VCM4 | PYGL | 1.64 | U | 0.003 |
| 58 | D4QBB3 | HBB | 1.74 | U | 0.000 |
| 59 | F1MTV1 | SPAM1 | 1.87 | U | 0.000 |
| 60 | Q3MHN5 | GC | 2.86 | U | 0.000 |
| 61 | Q8JTX9 | LW012 | 6.11 | U | 0.000 |
MFC: Mean fold change; U: upregulated expressed proteins: D: downregulated expressed proteins.
Identification of key differentially expressed proteins associated with inactive ovaries
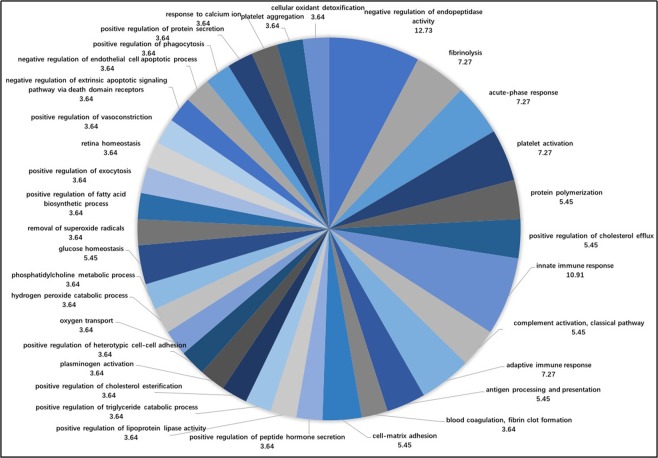
Figure 2 shows that the proportion of accessions from the Biology Process analysis included 34 annotations. In the GO analysis, the biological processes with higher proportions were negative regulation of endopeptidase activity (12.73%), innate immune response (10.91%), fibrinolysis (7.27%), acute phase response (7.27%), and platelet activation (7.27%).
Figure 2.
The proportions of accessions from the biological process analysis.
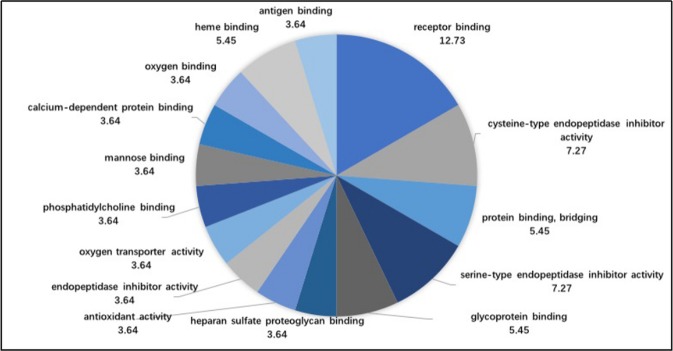
Figure 3 shows that the molecular function analysis included 15 annotations. The five biological processes were receptor binding (12.73%), cysteine endopeptidase inhibitor activity (7.27%), serine endopeptidase inhibitor activity (7.27%), protein binding (5.45%) and glycoprotein binding (5.45%).
Figure 3.
The proportions of accessions from the molecular function analysis.
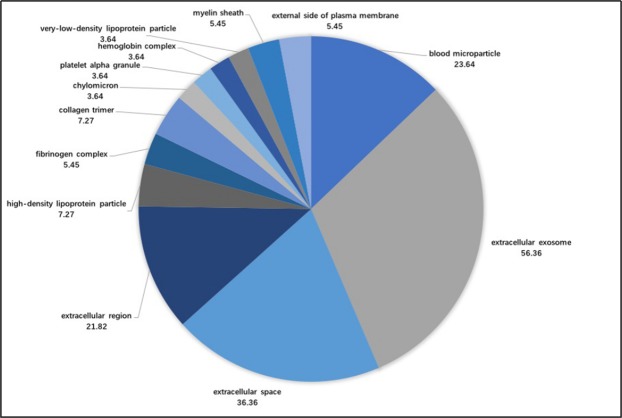
Figure 4 shows that the cell composition included 13 annotations. The biological processes with higher proportions were extracellular exosome (56.36%), extracellular space (36.36%), blood, microparticles (23.64%), extracellular regions (21.82%) and high-density lipoprotein particles (7.27%).
Figure 4.
The proportions of accessions from the cellular component analysis.
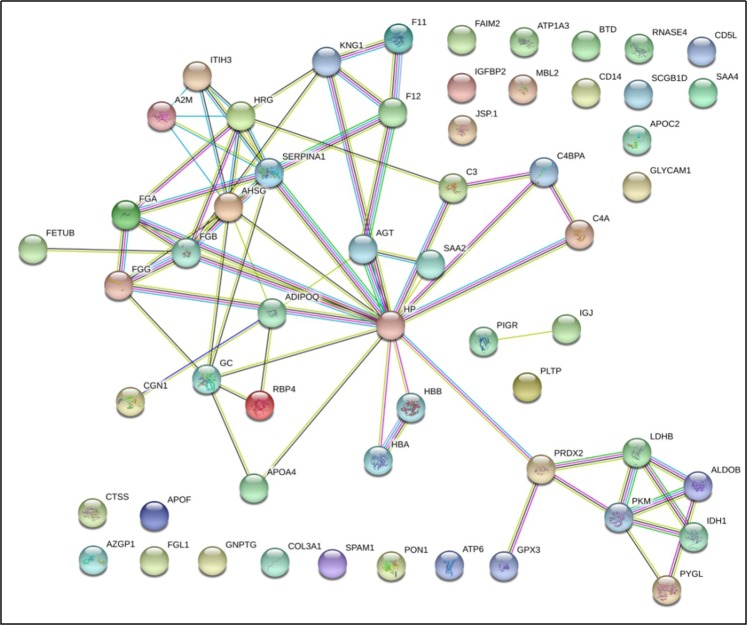
The protein network interactions of 61 differential proteins are shown in Fig. 5. Three proteins were not matched in the database (PEI, SPM and LW012), 57 nodes were obtained, and 68 proteins were annotated with each other. The proteins with p < 10−16 were enriched.
Figure 5.
The network interaction diagram of the differentially expressed proteins. The interaction map contains only differentially expressed proteins, resulting in 57 nodes, 68 protein interactions, and a protein interaction enrichment of p < 10–16. The interrelated centre is the interaction between HP and PRDX2.
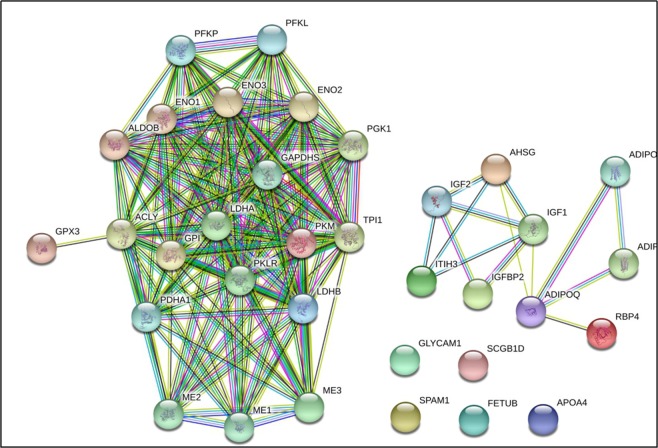
Based on the bioinformatics analysis of 61 differential proteins (including the GO, protein interaction and Pathway analyses), as well as the search of literature and data related to differential proteins, 14 differential proteins related to inactive ovaries were identified, including three downregulated proteins, namely, GPX3, SCGB1D and PKM2, and 11 upregulated proteins, namely, ADIPOQ, AHSG, APOA4, FETUB, ALDOB, SPAM1, LDHB, RBP4, IGFBP2, ITIH3 and GLYCAM1.
Figure 6 shows that the interaction centre is HP and PRDX2. The pathway analysis of differentially expressed proteins is shown in Table 4 and includes 11 metabolic pathways. After bioinformation research was performed, it was found that glycolysis/gluconeogenesis, amino acid biosynthesis, the glucagon signalling pathway, and vitamin digestion and absorption may be associated with inactive ovaries.
Figure 6.
The network interaction diagram of 14 key proteins. Fourteen differentially expressed proteins were screened and analysed, including three downregulated proteins, namely, GPX3, SCGB1D, and PKM2, and 11 upregulated proteins, namely, ADIPOQ, AHSG, APOA4, FETUB, ALDOB, SPAM1, LDHB, RBP4, IGFBP2, ITIH3, and GLYCAM1. The differential proteins aggregated on the left belong to the interaction of proteins in the sugar metabolism pathway. The IGFBP2 protein and the IGF family of proteins are found on the right side, suggesting that the related differential proteins are involved in the secretion, metabolism, and function of reproductive hormones.
Table 4.
Signalling pathway analysis of the differentially expressed proteins.
| KEGG ID | Description | Count | p value | Proteins |
|---|---|---|---|---|
| bta04610 | Complement and coagulation cascades | 10 | 0.000 | C4bBPA/KNG1/C4/FGB/FGG/F12/MBL/C4BPA/FGA/SERPINA1/A2M |
| bta04611 | Platelet activation | 4 | 0.016 | FGB/FGG/FGA/COL3A1 |
| bta05150 | Staphylococcus aureus infection | 3 | 0.025 | FGB/FGG/MBL |
| bta00010 | Glycolysis/Gluconeogenesis | 3 | 0.029 | ALDOB/PKM2/LDHB |
| bta04145 | Phagosome | 4 | 0.030 | CGN1/MBL/CTSS/CD14 |
| bta01230 | Biosynthesis of amino acids | 3 | 0.039 | IDH1/ALDOB/PKM2 |
| bta05133 | Pertussis | 3 | 0.041 | C4bBPA/C4/C4BPA/CD14 |
| bta01130 | Biosynthesis of antibiotics | 4 | 0.055 | IDH1/ALDOB/PKM2/LDHB |
| bta04922 | Glucagon signaling pathway | 3 | 0.060 | PYGL/PKM2/LDHB |
| bta01200 | Carbon metabolism | 3 | 0.077 | IDH1/ALDOB/PKM2 |
| bta04977 | Vitamin digestion and absorption | 2 | 0.089 | APOA4/BTD |
Proteomics validation
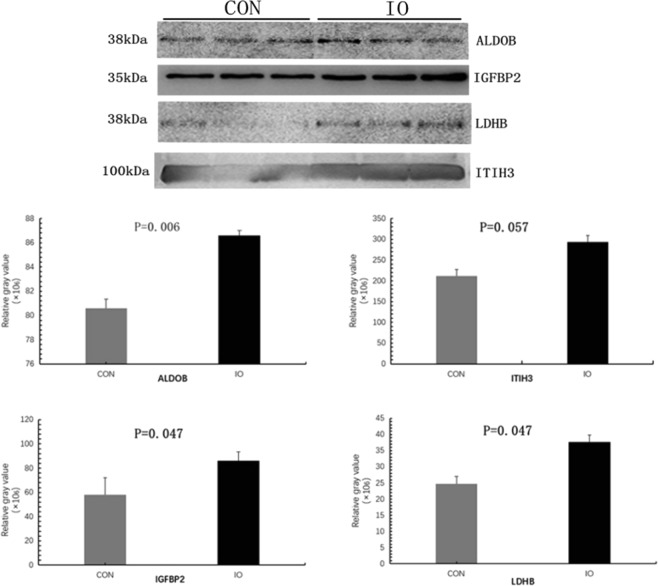
Four proteins (ALDOB, IGFBP2, ITIH3, and LDHB) from the proteomics analysis were validated by Western blot and protein band gel densitometric analysis, and the grey value analysis is shown in Fig. 7. The relative expression levels of the four proteins in the mixed sample was consistent with the results of the proteomics test.
Figure 7.
WB and Grey value analysis for ALDOB, IGFBP2, LDHB, and ITIH3. CON is a mixed sample of the healthy normal oestrous control group; IO is a mixed sample of the inactive ovary group.
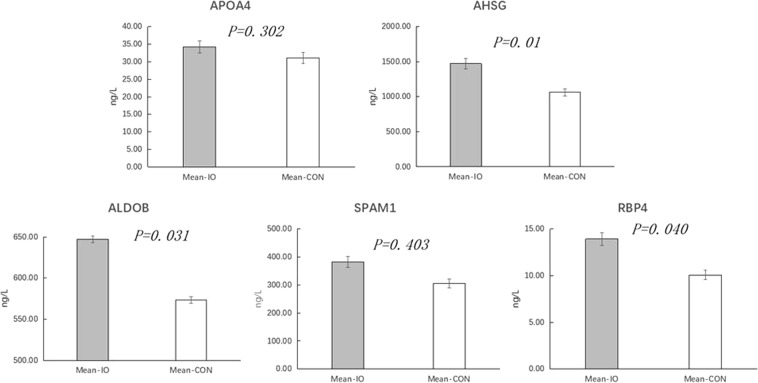
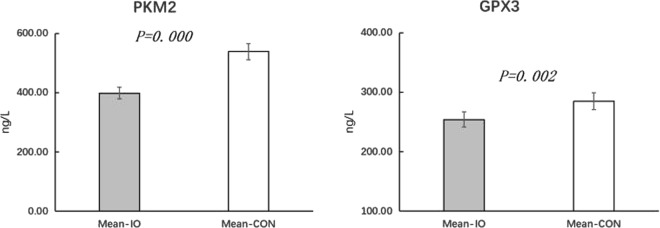
In addition, seven differentially expressed proteins were validated using the ELISA method, as shown in Figs 8 and 9. In the inactive ovary group, PKM2 and GPX3 were significantly downregulated (P < 0.01), AHSG was significantly upregulated (P < 0.01), and ALDOB and RBP4 were significantly upregulated (P < 0.05). However, APOA4 and SPAM1 were not significantly downregulated in the inactive ovary group (P > 0.05).
Figure 8.
Concentrations of the upregulated AHSG, APOA4, ALDOB, SPAM1 and RBP4 proteins. AHSG is alpha 2-HS glycoprotein; APOA4 is glutathione peroxidase 3; ALDOB is fructose diphosphate aldolase; SPAM1 is hyaluronidase; RBP4 is retinol binding protein 4; Mean-IO is the mean value of the sample in the IO group; and mean-CON is the average of the CON samples. The ordinate is protein content.
Figure 9.
Concentrations of the downregulated PKM2 and GPX3 proteins. PKM2 is pyruvate kinase; GPX3 is glutathione peroxidase 3; Mean-IO is the mean value of the samples from the IO group; Mean-CON is the mean value of the samples from the CON group; and the y-axis is the concentration.
Discussion
In this study, iTRAQ/LC-MS/MS was used to identify 14 major differentially expressed proteins in the blood of the inactive ovaries of dairy cows. Ten differentially expressed proteins were verified by WB or ELISA experiments, and the results were consistent with the proteomics results. In the inactive ovary group, the concentrations of ALDOB in the mixed samples and single samples were significantly increased (P < 0.01), the levels of LDHB and IGFBP2 were significantly increased (P < 0.05), and the concentration of ITIH3 was not significantly increased (P > 0.05). Bioinformatics analysis revealed that the four differentially expressed proteins participate in glucose metabolism, especially the metabolic pathway of glycolysis, as blood glucose can play a role in follicular development. Next, the four differential proteins were examined to determine the relationship between the glycolytic process in follicles a ovarian rest.
ADIPOQ is a protein that is mainly produced by white adipose tissue and may regulate ovarian function and early pregnancy20. In dairy cows, ADIPOQ and its receptors are present in different cell types, including oocytes, follicular membranes, granulosa cells, cumulus cells, and luteal cells21. Moreover, the physiological state of the ovaries is related to the expression pattern of ADIPOQ and its receptor on the surface of follicular cells and luteal cells22. In fact, in the follicular phase and the luteal phase, the expression levels of adiponectin, ADIPOQ receptor 1 and ADIPOQ receptor 2 are higher in granulosa cells and cumulus cells in the dominant follicle than in the atretic follicle23. ADIPOQ may also reduce the steroid production induced by insulin through the ERK1/2 MAPK pathway, but ADIPOQ only inhibits steroid production in bovine follicular cells24. In this study, the plasma level of ADIPOQ was upregulated in dairy cows with inactive ovaries. This suggests that an indirect effect on follicular development may be induced by insulin and IGF-125, which needs further confirmation.
Glutathione peroxidase belongs to a family of phylogenetically related enzymes, and the catalytic centre of mammalian GPX1-4 is selenocysteine. Glutathione is a substrate for GPX3, a major antioxidant enzyme that protects cells from lipid hydrogen peroxide and H2O226 and catalyses the reduction of free hydroperoxides and other hydroperoxides27. Excessive oxidative stress induces apoptosis in follicular cells and induces atresia28. GPX3 prevents apoptosis from oxidative stress and promotes follicular growth. In this experiment, the plasma level of GPX3 was downregulated in dairy cows with inactive ovaries, suggesting that oxidative stress in ovarian quiescence may cause the failure of follicular development to form a cumulus structure that promotes oocyte production.
The insulin-like growth factor (IGF) system consists of several members, including IGF-1 and IGF-2, two receptors, and at least six binding proteins (IGFBP2, IGFBP2, IGFBP3, IGFBP4, IGFBP5, and IGFBP6). IGFBPs are present in biological fluids and function by inhibiting or enhancing the actions of two IGFs (IGF1 and IGF2) in target cells29. The regulation of the bioavailability of IGFBP by IGFBPs is essential for the in vitro culture of bovine oocytes and follicles30. The expression of IGF1 receptor in bovine follicular granulosa cells and ovarian follicular cells increases in the final stages of follicular development and decreases at the onset of occlusion31. Although IGF1 and insulin play a key role in late follicular development, IGFBP2 expression is upregulated in cows with inactive ovaries, and the follicles under these conditions stop developing at an early stage.
Retinol binding protein 4 (RBP4) is also known as vitamin A binding protein 432. The transport and metabolism of retinoids is mediated and regulated by specific binding proteins, which have the potential to locally regulate follicular development, including oocyte maturation33. Retinoic acid is an activated form of retinol and is also an oxidized form. Retinoic acid can reduce the levels of FSH receptors and LH receptors induced by FSH in granulosa cells. The acquisition of LH receptors and FSH receptors is critical for follicular development, oocyte maturation, ovulation and luteinization. Therefore, an increase in vitamin A and its derivatives can affect the development of follicles. In this experiment, the plasma level of RBP4 increased in the cows with inactive ovaries, but the mechanism RBP4 actions in the inactive ovaries of dairy cows needs further exploration in the future.
In summary, among the four major differential proteins, ADIPOQ, IGFBP2 and RBP4 may affect follicular development by influencing the biological processes of reproductive hormones, while GPX3 affects follicular development through oxidative stress. However, it is still unclear how these differential proteins interact in follicular development and inactive ovaries during the early lactation of dairy cows.
Conclusions
This study is the first to identify 61 types of differentially expressed proteins in the serum of cows with inactive ovaries based on iTRAQ and LC-MS/MS. Among these proteins, 14 were closely related to inactive ovaries; GPX3, SCGB1D and PKM2 were downregulated, and ADIPOQ, AHSG, APOA4, FETUB, ALDOB, SPAM1, LDHB, RBP4, IGFBP2, ITIH3 and GLYCAM1 were upregulated. This implies that the 14 differentially expressed proteins are closely associated with the development of inactive ovaries during early lactation in dairy cows. However, there will be many future research studies on how these differential proteins play a role in the development of inactive ovaries.
Acknowledgements
This study was supported by the National Key R&D program of China (Grant No:2017TFD0502200) and the National Science Foundation of China (Grant No: 31772804).
Author Contributions
Chang Zhao wrote this article and completed the study. Shi Shu mainly completed the data analysis of this study. Yunlong Bai and Dong Wang completed the work of collecting samples from cattle farms. Professor Cheng Xia and Professor Chuang Xu provided help and guidance for the writing of this article.
Competing Interests
The authors declare no competing interests.
Footnotes
Publisher’s note Springer Nature remains neutral with regard to jurisdictional claims in published maps and institutional affiliations.
Chang Zhao and Shi Shu contributed equally.
Contributor Information
Cheng Xia, Email: Xcwlxyf2014@163.com.
Chuang Xu, Email: xuchuang7175@163.com.
References
- 1.Peter AT, Vos PL, Ambrose DJ. Postpartum anestrus in dairy cattle. Theriogenology. 2009;71(9):1333. doi: 10.1016/j.theriogenology.2008.11.012. [DOI] [PubMed] [Google Scholar]
- 2.Ginther OJ, et al. Role of low circulating FSH concentrations in controlling the interval to emergence of the subsequent follicular wave in cattle. Reproduction. 2002;124:475–482. doi: 10.1530/rep.0.1240475. [DOI] [PubMed] [Google Scholar]
- 3.Mihm M, et al. Identification of potential intrafollicular factors involved in selection of dominant follicles in heifers. Biol Reprod. 2000;63:811–9. doi: 10.1095/biolreprod63.3.811. [DOI] [PubMed] [Google Scholar]
- 4.Xu Z, et al. Expression of follicle-stimulating hormone and luteinizing hormone receptor messenger ribonucleic acids in bovine follicles during the first follicular wave. Biol Reprod. 1995;53:951. doi: 10.1095/biolreprod53.4.951. [DOI] [PubMed] [Google Scholar]
- 5.Scaramuzzi RJ, et al. A review of the effects of supplementary nutrition in the ewe on the concentrations of reproductive and metabolic hormones and the mechanisms that regulate folliculogenesis and ovulation rate. Reprod Nutr Dev. 2006;46:339. doi: 10.1051/rnd:2006016. [DOI] [PubMed] [Google Scholar]
- 6.Jorritsma R, et al. Associations between energy metabolism, LH pulsatility and first ovulation in early lactating cows. Reprod Domest Anim. 2005;40:68–72. doi: 10.1111/j.1439-0531.2004.00558.x. [DOI] [PubMed] [Google Scholar]
- 7.Letelier C, et al. Glucogenic supply increases ovulation rate by modifying follicle recruitment and subsequent development of preovulatory follicles without effects on ghrelin secretion. Reproduction. 2008;136:65. doi: 10.1530/REP-08-0010. [DOI] [PubMed] [Google Scholar]
- 8.Viñoles C, et al. Short-term nutritional supplementation of ewes in low body condition affects follicle development due to an increase in glucose and metabolic hormones. Reproduction. 2005;129:299–309. doi: 10.1530/rep.1.00536. [DOI] [PubMed] [Google Scholar]
- 9.Hardt M, et al. Assessing the effects of diurnal variation on the composition of human parotid saliva: quantitative analysis of native peptides using iTRAQ reagents. Anal Chem. 2005;77:4947. doi: 10.1021/ac050161r. [DOI] [PubMed] [Google Scholar]
- 10.Min L, et al. Plasma-based proteomics reveals immune response, complement and coagulation cascades pathway shifts in heat-stressed lactating dairy cows. J Proteomics, 14699–108 (2016). [DOI] [PubMed]
- 11.Dai W, et al. Complementary transcriptomic and proteomic analyses reveal regulatory mechanisms of milk protein production in dairy cows consuming different forages. Sci Rep-UK. 2017;14:44234. doi: 10.1038/srep44234. [DOI] [PMC free article] [PubMed] [Google Scholar]
- 12.Zhang SD, et al. Differential proteomic profiling of endometrium and plasma indicate the importance of hydrolysis in bovine endometritis. J Dairy Sci. 2017;100:9324–9337. doi: 10.3168/jds.2016-12365. [DOI] [PubMed] [Google Scholar]
- 13.Xu C, et al. Metabolic profiles using (1)H-nuclear magnetic resonance spectroscopy in postpartum dairy cows with ovarian inactivity. Theriogenology. 2016;86(6):1475–1481. doi: 10.1016/j.theriogenology.2016.05.005. [DOI] [PubMed] [Google Scholar]
- 14.Mann S, et al. Dry period plane of energy: Effects on feed intake, energy balance, milk production, and composition in transition dairy cows. J Dairy Sci. 2015;98:3366–3382. doi: 10.3168/jds.2014-9024. [DOI] [PubMed] [Google Scholar]
- 15.Cheng J, et al. Strong, sudden cooling alleviates the inflammatory responses in heat-stressed dairy cows based on iTRAQ proteomic analysis. Int J Biometeorol. 2017;62:1–6. doi: 10.1007/s00484-017-1439-5. [DOI] [PubMed] [Google Scholar]
- 16.Liu X, et al. iTRAQ-based analysis of sperm proteome from normozoospermic men achieving the rescue-ICSI pregnancy after the IVF failure. Clin Proteom. 2018;15:27. doi: 10.1186/s12014-018-9203-3. [DOI] [PMC free article] [PubMed] [Google Scholar]
- 17.Zhang Z, et al. Interconversion of Peptide Mass Spectral Libraries Derivatized with iTRAQ or TMT Labels. J Proteome Res. 2016;15(9):3180–3187. doi: 10.1021/acs.jproteome.6b00406. [DOI] [PubMed] [Google Scholar]
- 18.Huang Da Wei, Sherman Brad T, Lempicki Richard A. Systematic and integrative analysis of large gene lists using DAVID bioinformatics resources. Nature Protocols. 2008;4(1):44–57. doi: 10.1038/nprot.2008.211. [DOI] [PubMed] [Google Scholar]
- 19.Kim B. Western Blot Techniques. Methods in Molecular Biology. 2017;1606:133. doi: 10.1007/978-1-4939-6990-6_9. [DOI] [PubMed] [Google Scholar]
- 20.Palin MF, Bordignon VV, Murphy BD. Adiponectin and the control of female reproductive functions. Vitam Horm. 2012;90:239. doi: 10.1016/B978-0-12-398313-8.00010-5. [DOI] [PubMed] [Google Scholar]
- 21.Maillard V, et al. Effect of adiponectin on bovine granulosa cell steroidogenesis, oocyte maturation and embryo development. Reprod Biol Endocrin. 2010;8:23. doi: 10.1186/1477-7827-8-23. [DOI] [PMC free article] [PubMed] [Google Scholar]
- 22.Tabandeh MR, Hosseine A, Saeb M. Changes in the gene expression of adiponectin and adiponectin receptors (AdipoR1 and AdipoR2) in ovarian follicular cells of dairy cow at different stages of development. Theriogenology. 2010;73:659–69. doi: 10.1016/j.theriogenology.2009.11.006. [DOI] [PubMed] [Google Scholar]
- 23.Tabandeh MR, Golestani N, Kafi M. Gene expression pattern of adiponectin and adiponectin receptors in dominant and atretic follicles and oocytes screened based on brilliant cresyl blue staining. Anim Reprod Sci. 2012;131:30. doi: 10.1016/j.anireprosci.2012.02.006. [DOI] [PubMed] [Google Scholar]
- 24.Lagaly D, Aad P, Grado-ahuir J. Role of adiponectin in regulating ovarian theca and granulosa cell function. Mol cell endocrinol. 2008;284:38–45. doi: 10.1016/j.mce.2008.01.007. [DOI] [PubMed] [Google Scholar]
- 25.Szklarczyk D, Franceschini A. STRING v10: protein-protein interaction networks, integrated over the tree of life. Nucleic Acids Res. 2015;43:D447. doi: 10.1093/nar/gku1003. [DOI] [PMC free article] [PubMed] [Google Scholar]
- 26.Chaiswing L, Oberley TD. Extracellular/microenvironmental redox state. Antioxid Redox Sign. 2010;13:449–465. doi: 10.1089/ars.2009.3020. [DOI] [PubMed] [Google Scholar]
- 27.Yu BP. Cellular defenses against damage from reactive oxygen species. Physiol Rev. 1994;74:139. doi: 10.1152/physrev.1994.74.1.139. [DOI] [PubMed] [Google Scholar]
- 28.Tilly JL, Tilly KI. Inhibitors of oxidative stress mimic the ability of follicle-stimulating hormone to suppress apoptosis in cultured rat ovarian follicles. Endocrinology. 1995;136:242. doi: 10.1210/endo.136.1.7828537. [DOI] [PubMed] [Google Scholar]
- 29.Monget P, Fabre S, Mulsant P. Regulation of ovarian folliculogenesis by IGF and BMP system in domestic animals. Domest Anim Endocrinol. 2002;23:139–154. doi: 10.1016/S0739-7240(02)00152-2. [DOI] [PubMed] [Google Scholar]
- 30.Thomas FH, Campbell BK, Armstrong DG. Effects of IGF-I bioavailability on bovine preantral follicular development in vitro. Reproduction. 2007;133:1121. doi: 10.1530/REP-06-0382. [DOI] [PubMed] [Google Scholar]
- 31.Armsstrong DG, Gutierrezc G, Baxter G. Expression of mRNA encoding IGF-I, IGF-II and type 1 IGF receptor in bovine ovarian follicles. J Endocrinol. 2000;165:101–13. doi: 10.1677/joe.0.1650101. [DOI] [PubMed] [Google Scholar]
- 32.Napoli JL. Retinoic acid biosynthesis and metabolism. Faseb Journal Official Publication of the Federation of American Societies for Experimental Biology. 1996;10:993. doi: 10.1096/fasebj.10.9.8801182. [DOI] [PubMed] [Google Scholar]
- 33.Rhinne M, Dolle P. Retinoic acid signaling during development. Development. 2012;139:843–858. doi: 10.1242/dev.065938. [DOI] [PubMed] [Google Scholar]


