Abstract
The aim of the present study was to identify key genes in colorectal cancer (CRC) that could be used to reliably diagnose this disease and to explore the potential underlying mechanisms in silico. The gene expression profiles of primary human cancer datasets GSE21510 and GSE32323 were downloaded from the Gene Expression Omnibus database. The limma R software package was used to identify differentially expressed (DE) genes. Gene Ontology and Kyoto Encyclopedia of Genes and Genomes (KEGG) pathway enrichment analyses were performed on DE genes using the Database for Annotation, Visualization and Integrated Discovery. The Search Tool for the Retrieval of Interacting Genes/Proteins database was used to construct a protein-protein interaction (PPI) network of the DE genes. Survival rate was analyzed and visualized using The Cancer Genome Atlas (TCGA). A total of 1,126 genes were significantly DE in the present study. All DE genes were enriched in KEGG pathways including ‘cell cycle’, ‘mineral absorption’, ‘pancreatic secretion’, ‘pathways in cancer’, ‘metabolic pathways’, ‘aldosterone-regulated sodium reabsorption’ and ‘Wnt signaling pathway’. A total of 5 hub genes enriched in cell cycle and tumor-associated pathways, including E2F2, SKP2, MYC, CDKN1A and CDKN2B, were significantly DE and validated between tumor and normal tissues. CDKN1A and CDKN2B were identified within the PPI network using the Molecular Complex Detection algorithm. Survival and content distribution analyses of 362 clinical samples from TCGA revealed that CDKN1A effectively predicted the prognosis of patients. The present study identified key genes and potential signaling pathways involved in CRC. These findings may provide new insights for survival assessment during the clinical diagnosis of CRC.
Keywords: colorectal cancer, bioinformatic analysis, biomarker, survival rate
Introduction
Biomarkers are biomolecules in the blood or other body fluids and tissues used to identify a disease state (1). The occurrence or prognosis of a disorder or disease is reflected by the normal or abnormal expression of these biomarkers (2). Current research on biomarkers has focused primarily on the expression levels of mRNA, microRNA (miRNA) and long non-coding RNA (lncRNA), and predicting the associated pathological changes and phenotypes (3–5).
Colorectal cancer (CRC) has become the third most common malignant cancer among males and females worldwide (6). Epidemiological studies have reported a 5-year survival rate of 54% for CRC (7). A recent study found that the 5-year survival rate of CRC has increased by 10% and, due to the different stages of the disease and different characteristics, this disease remains a serious public health issue (8).
There is currently no efficacious neoadjuvant treatment, surgery, chemotherapy, radiotherapy, or immunotherapy for colon cancer. At present, to the best of our knowledge, there are no accurate tumor markers for colon cancer and identification of such biomarkers may contribute to early cancer diagnosis and screening (9,10). Identification of mRNAs and lncRNAs as potential biomarkers requires complex and expensive deep sequencing processes for validation (11). Therefore, the current study aimed to identify genetic biomarkers and therapeutic targets that can be used to detect CRC and predict patient survival.
Materials and methods
Data collection
GSE21510 (12) and GSE32323 (13) gene expression data were analyzed using the Affymetrix Human Genome U133 Plus 2.0 Array. The GSE21510 dataset includes data from 123 patients with CRC and 25 healthy controls, whereas the GSE32323 dataset includes 17 samples from patients with CRC and 17 samples from healthy controls. Both microarray datasets were retrieved from the Gene Expression Omnibus database (https://www.ncbi.nlm.nih.gov/geo/).
Identification of differentially expressed (DE) genes
R (version 3.5.2) (14) and R Studio (version 1.1.383) (15) were used for data analysis. Prior to the analysis of DE genes, principal component analysis which was performed using ggord package (version 1.0.0; zenodo.org/badge/latestdoi/35334615) on the samples from the two datasets to ensure that the data can be used. DE genes between patients with colon cancer and normal subjects were identified using the limma (version 3.25.15; bioinf.wehi.edu.au/limma) software package in R with the empirical Bayesian approach for linear models (16). The empirical Bayesian approach is equivalent to shrinkage of the estimated sample variances towards a pooled estimate, resulting in a far more stable inference when the number of arrays is small (17). Only genes which met the criteria of P<0.01 and |log2 fold-change| >1.5 were selected as DE genes in the present study. Venn diagram was used to visualize intersection of genes from GSE21510 and GSE32323 datasets. Finally, 1,126 genes were selected for further analysis.
Functional and pathway enrichment analysis
Pathway analysis was based on the Kyoto Encyclopedia of Genes and Genomes (KEGG) database (www.genome.jp/kegg) with P<0.05. Clusterprofiler (version 3.13.0) (18) was used to analyze pathway enrichment and obtain false discovery rates.
Construction of the biological network
Protein-protein interaction (PPI) network data were downloaded from the Search Tool for the Retrieval of Interacting Genes/Proteins (STRING version 11.0) database (19). A PPI was used to visualize how proteins interact with each other. At the same time, the main proteins in the network were annotated. A network was constructed so that the connections between target DE genes could be visualized.
Gene distribution, tumor stage and survival analysis
STRING analysis using a spring model was used to generate confidence scores, two genes which were significantly differentially expressed, based on the confidence scores, were identified through analysis of the PPI network. Two large clinical sample databases, The Cancer Genome Atlas (TCGA; cancergenome.nih.gov) and Genotype-Tissue Expression (GTEx; gtexportal.org), were used to determine the survival of patients with CRC expressing CDKN1A and CDKN2B, and patients without these genes by searching the key words ‘colon cancer’. The distribution of these two genes was verified in the TGCA colon cancer database. The database here were based upon data generated by the TCGA Research Network (https://www.cancer.gov/tcga). The expression levels of CDKN1A and CDKN2B were also determined at different clinical stages according to the Tumor-Node-Metastasis staging system (20) in CRC. Expression level analysis was performed using a one-way ANOVA, using the pathological stage as variable for calculating differential expression. Gene Expression Profiling Interactive Analysis (GEPIA; gepia.cancer-pku.cn) was used to map the survival plots, and the patient's clinical information was obtained from TCGA (21).
Results
Identification of DE genes
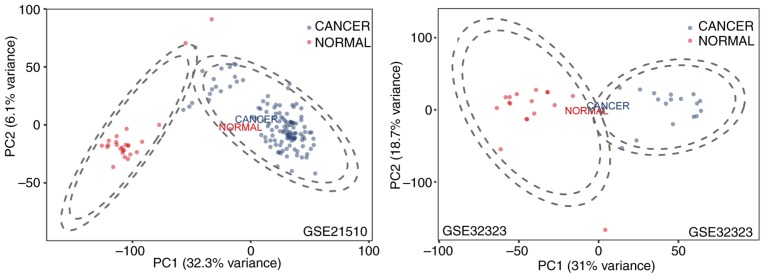
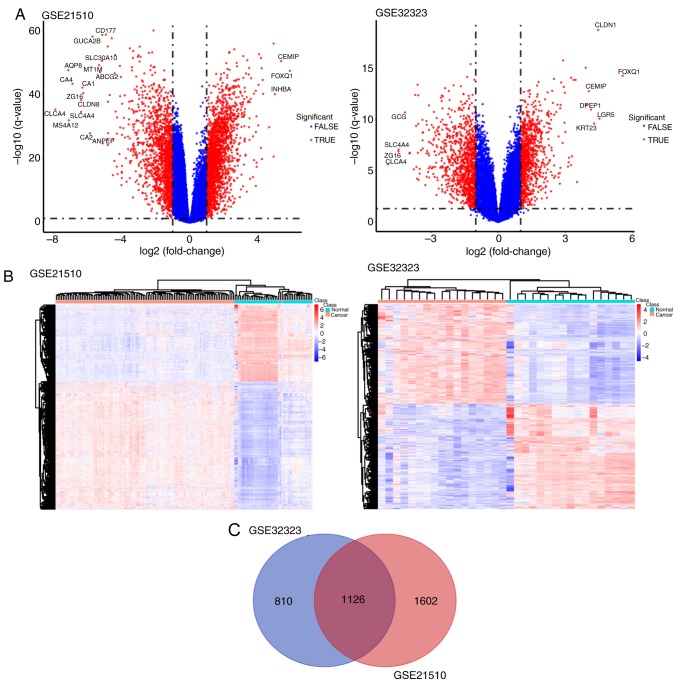
The results of the principal component analysis revealed that differential tissue analysis can be performed between normal and tumor tissue samples (Fig. 1). GSE32323 and GSE21510 datasets were selected and underwent DE gene analysis using the limma package in R. A total of 1,936 genes were identified as either upregulated or downregulated in the GSE32323 dataset and 2,728 DE genes were identified in the GSE21510 dataset (fold change ≥1.5 or ≤-1.5; P<0.01). Among the identified DE genes, 1,126 were designated and listed as common significantly DE genes through the Venn diagram analysis. All genes plotted in red represented DE genes and the remaining genes were plotted in blue (Fig. 2A). The DE genes are presented in Fig. 1. Significantly DE genes were presented in a heatmap and clustering was observed between cancer and normal samples (Fig. 2B). The corresponding Venn diagram is presented in Fig. 2C.
Figure 1.
Principal component analysis of GSE21510 and GSE32323 datasets. PC, principal component.
Figure 2.
(A) Genes were well clustered between cancer and normal tissue samples as shown in the volcano plot. All genes plotted in red represented DE genes and the remaining genes were plotted in blue. (B) The significantly changed DE genes of GSE21510 and GSE32323 were presented in the heatmap. (C) The common DE genes between GSE21510 and GSE32323. DE genes, differentially expressed genes.
KEGG pathway analysis of DE genes and construction of the PPI network
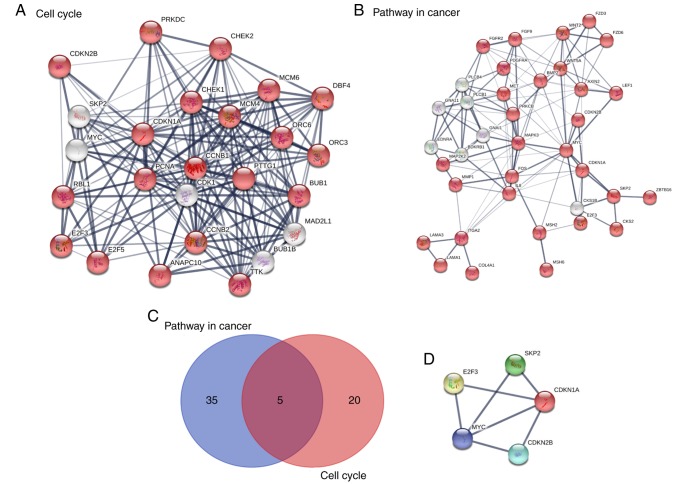
A total of 1,126 genes were subjected to KEGG pathway analysis. All DE gene names were submitted to the STRING database. The DE genes were significantly enriched in the ‘cell cycle’, ‘mineral absorption’, ‘pancreatic secretion’, ‘pathways in cancer’, ‘metabolic pathways’, ‘aldosterone-regulated sodium reabsorption’ and ‘Wnt signaling pathway’. In terms of the signaling pathway enrichment, these DE genes were enriched in the cell cycle and tumor-associated pathways (Table I). An intersection between these two signaling pathways was determined using Venn diagrams. E2F transcription factor 2 (E2F2), S-phase kinase associated protein 2 (SKP2), MYC, cyclin-dependent kinase inhibitor 1A (CDKN1A) and cyclin-dependent kinase inhibitor 2B (CDKN2B) were indicated to be the common hub genes (Fig. 3).
Table I.
Functional and pathway enrichment analysis of the differentially expressed genes in colorectal cancer.
| Term | Genes | False discovery rate | P-value |
|---|---|---|---|
| hsa04110: Cell cycle | CDK1, E2F2, E2F5, DBF4, RBL1, SKP2, PRKDC, TTK, CHEK1, ANAPC10, CHEK2, PTTG1, MCM4, MCM6, CCNB1, CDKN1A, CCNB2, MAD2L1, CDKN2B, PCNA, BUB1, BUB1B, ORC6, MYC, ORC3 | 6.71×10⁻⁴ | 5.10×10⁻⁷ |
| hsa04978: Mineral absorption | SLC11A2, SLC26A3, CLCN2, MT1M, HMOX1, MT2A, MT1E, MT1H, MT1X, MT1G, MT1F | 0.57 | 4.36×10⁻⁴ |
| hsa04972: Pancreatic secretion | KCNMA1, CLCA1, CLCA4, SLC12A2, PRKCB, CEL, SLC26A3, PLCB4, ATP2A3, PLA2G2A, CPA3, CA2, SLC4A4, PLCB1, SLC9A1 | 2.29 | 1.76×10⁻³ |
| hsa05200: Pathways in cancer | FGFR2, WNT5A, CKS1B, E2F2, PPARD, GNAI1, FGF9, GNA11, CXCL8, BDKRB1, ZBTB16, MMP1, EDNRA, WNT2, FOS, PLCB4, CDKN2B, AXIN2, PLCB1, TRAF5, MYC, MSH6, BMP2, COL4A1, EPAS1, MAP2K2, MSH2, MET, SKP2, LEF1, ITGA2, FZD3, PRKCB, FZD6, LAMA1, CDKN1A, LAMA3, MAPK3, CKS2, PDGFRA | 3.20 | 2.47×10⁻³ |
| hsa01100: Metabolic pathways | B3GALT5, B3GALT4, ADH1C, ADH1B, GPAT3, PRIM1, ASPA, PTGIS, ST3GAL4, CPOX, NANP, LPCAT2, GLCE, PLCE1, NME1, AKR1B10, PLA2G2A, ACAA1, PRPS1, XDH, GCNT3, AHCY, GCNT2, GNE, CTPS2, PPAT, B3GNT6, CDA, GCSH, DNMT3B, MAOA, AK1, MAOB, HGD, GART, TST, CEL, POLD4, GGT6, RPE, HMGCS2, MTR, AHCYL2, PC, ATP5D, CYP2C18, ANPEP, PSPH, CKB, ST6GALNAC6, TDO2, PLCB4, HPSE, P4HA1, MGLL, TWISTNB, PLCB1, ATP6V0D1, HYAL1, POLR1D, ACADS, DHRS9, POLR1C, POLR1B, ST6GALNAC1, ACADVL, ATP6V1C2, ADO, PTGDS, ADK, TGDS, AOC1, UGP2, ALPI, SORD, FUT8, HSD17B2, UGDH, UPP1, PIPOX, GLS2, DGKA, ALDH1A1, CKMT2, FUT3, FUT1, PLCD1, UGT2A3, ACSL4, PAPSS2, PLA2G16, NAT2, SI, PCK1, GBA3, GBA2, MBOAT1, SMPD1, PSAT1, PAICS | 3.87 | 2.99×10⁻³ |
| hsa04310: Wnt signaling pathway | WNT5A, PPARD, MMP7, LEF1, FZD3, PRKCB, FZD6, WNT2, GPC4, PLCB4, SFRP1, SFRP2, WIF1, RUVBL1, AXIN2, PLCB1, MYC | 14.59 | 1.19×10⁻² |
Figure 3.
Pathway enrichment analysis and PPI network construction for (A) cell cycle and (B) pathway in cancer signal pathways. The red point indicates the nodes or genes in the signaling pathway. (C) A total of 5 hub genes were identified in the Venn diagram analysis. (D) PPI network of the 5 selected hub genes. PPI, protein-protein interaction; DE genes, differentially expressed genes.
Common hub gene expression and cancer stage analysis
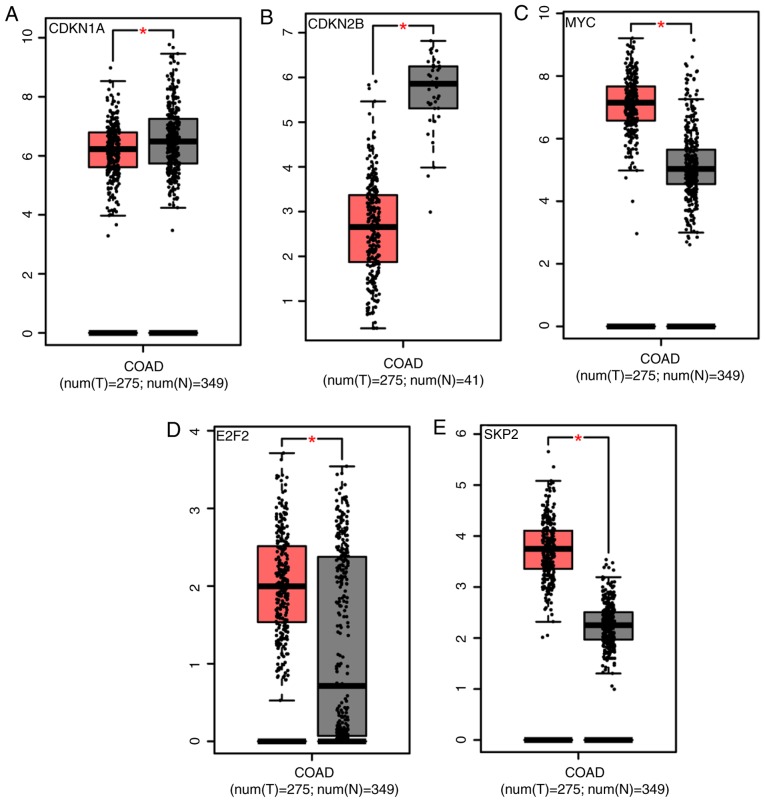
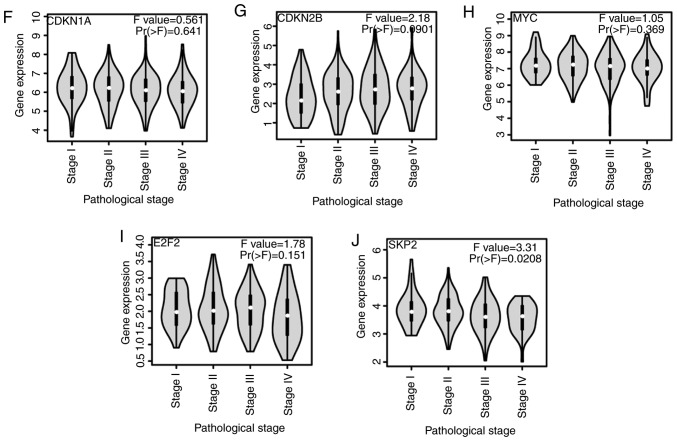
Differential expression analysis of genes was performed through the TCGA and Genotype-Tissue Expression (GTEx) databases, in order to verify that the five aforementioned common hub genes serve important roles in the development of colon cancer. A total of 275 cancer samples and 349 normal samples were selected from the TCGA and GTEx databases. E2F2, SKP2, MYC and CDKN1A showed significantly increased expression in tumor samples compared with normal tissue, while CDKN2B had significantly reduced expression in tumor samples compared with normal tissue in the TCGA database (Fig. 4A-E). Using patient information included in the TCGA and GTEx databases, the present study revealed that these five genes were expressed in different stages of colon cancer (Fig. 4F-J); however, there was no statistically significant difference between the stages (F-value >0.05).
Figure 4.
Expression of (A) CDKN1A, (B) CDKN2B, (C) MYC, (D) E2F2 and (E) SKP2 in clinical colon cancer (red, tumor; gray, normal). The expression level changes in different stages of (F) CDKN1A, (G) CDKN2B, (H) MYC (I) E2F2 and (J) SKP2. Differential gene expression analysis was analyzed using a one-way ANOVA, with the pathological stage as the variable used for calculating differential expression. Samples were obtained from The Cancer Genome Atlas and Genotype-Tissue Expression datasets. |Log fold-change| cut-off=1; *P<0.05. CDKN1A, cyclin-dependent kinase inhibitor 1A; COAD, colon adenocarcinoma; T, tumor; N, normal; CDKN2B, cyclin-dependent kinase inhibitor 2B; E2F2, E2F transcription factor 2; SKP2, S-phase kinase associated protein 2.
Survival analysis
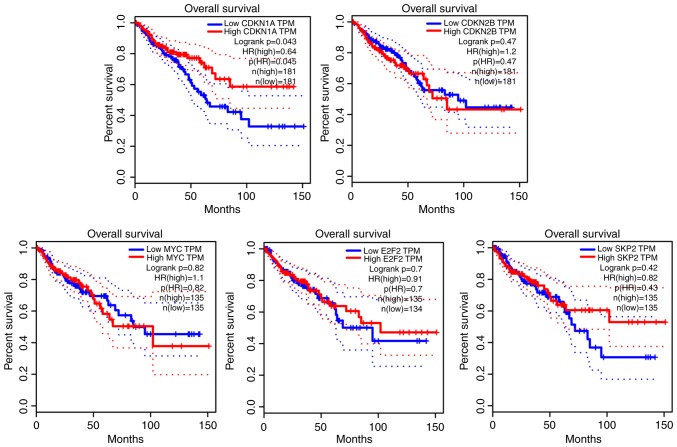
Clinical information regarding 362 cases of colon cancer was retrieved from the TGCA database. Data analysis revealed that 181 patients with high CDKN1A expression had significantly improved survival (P<0.05). However, the differential expression of CDKN2B, MYC, E2F2 and SKP2 was not significantly associated with the survival of patients from the TGCA database (P>0.05). The results of the survival analysis are presented in Fig. 5.
Figure 5.
Survival time of CDKN1A, CDKN2B, E2F2, SKP2 and MYC in clinical patients. Data were obtained from The Cancer Genome Atlas. Patients with high expression of CDKN1A had significantly prolonged survival time. P<0.05. CDKN1A, cyclin-dependent kinase inhibitor 1A. The solid line represents the results of the Log-rank test analysis data. The results of the cox proportional hazard ratio and the 95% confidence interval information are indicated by the dashed lines. The median was used as a threshold for high and low expression TPM, transcripts per million; HR, hazard ratio; CDKN2B, cyclin-dependent kinase inhibitor 2B; E2F2, E2F transcription factor 2; SKP2, S-phase kinase associated protein 2.
Discussion
The present study analyzed data from GSE21510 and GSE32323 gene expression datasets. Comparison of data from patients with CRC and healthy patients resulted in identification of 1,126 DE genes with P<0.01 and fold-change ≥1.5 or ≤-1.5. All DE genes between CRC and non-CRC samples were used for PPI network construction, and for KEGG pathway enrichment and survival analyses.
The interrelated pathways were subsequently analyzed. The identified genes interacted directly or indirectly with others. The analyzed DE genes were associated with a number of pathways. ‘Cell cycle’, ‘mineral absorption’, ‘pancreatic secretion’, ‘pathways in cancer’ and ‘Wnt signaling pathway’ were the top pathways in the enrichment analysis. ‘Cell cycle’ and ‘pathways in cancer’ associated with the MAPK and p53 signaling pathways are the most important components of cancer research (22,23). In addition, the Wnt signaling pathway plays an important role in numerous biological processes, including embryonic development, cell cycle regulation, inflammation and cancer (24). These alterations converge into an increased tumorigenicity, sustained proliferation and enhanced metastatic potential.
Analysis of the enriched signaling pathways of DE genes from different clinical samples lead to the identification of five hub genes, E2F2, SKP2, MYC, CDKN1A and CDKN2B. TGCA and GTEx datasets were used to further verify that these hub genes were DE genes and served important roles in colon cancer. The results revealed that five hub genes were differentially expressed between tumors and normal tissues. MYC plays a role in cell cycle progression, apoptosis and cellular transformation (25). Furthermore, MYC enhances protein synthesis by regulating genes involved in ribosome biogenesis and protein translation (26). A number of lncRNAs and transcription factors could affect tumor growth by acting on MYC. E2F2 was reported to interact with retinoblastoma protein to regulate the expression of genes involved in the cell cycle (27). Altered copy number and activity of this gene have been observed in liver and lung cancer (28). However, to the best of our knowledge, the function of E2F2 in CRC has not been verified. SKP2 is a member of the F-box protein family and SKP2-mediated degradation of cytoglobin has been identified as the key mechanism for controlling its oscillating levels during the cell cycle (29). CDKN1A and CDKN2B are potent cyclin-dependent kinase inhibitors and serve roles in the regulation of cell cycle progression at the G1 stage (30,31). CDKN1A and CDKN2B have been reported in relation to breast (32), liver (33) and prostate cancer (34). Although an association between CDKN1A and CDKN2B and colon and rectal cancer has been reported, the majority of studies reported activities specific to potent cyclin-dependent kinase inhibitors (32,35,36). Furthermore, the majority of these studies were based on the roles of miRNA and lncRNA. Li et al (37) discussed the effect of lncSNHG6 on p21 and CRC. Zhang et al (38) revealed that upregulation of miRNA-1258 regulated the cell cycle and inhibited cell proliferation in CRC. Chen et al (39) reported that baicalein downregulated ezrin and inhibited the proliferation of human CRC cell line HCT116. Therefore, the expression status of CDKN1A and CDKN2B is important in CRC.
There are numerous studies on tumor biomarkers. Del et al (40) reported that KRAS and NRAS proto-oncogene GTPase genes were associated with poor response to anti-epidermal growth factor receptor therapies in patients with metastatic CRC. Furthermore, Xie et al (41) reported that phospholipase A and acyltransferase 3 may increase the risk of CRC in the Chinese population, while Yu et al (42) reported that Bcl-2 was associated with favorable prognosis. These reports mainly discussed the association between biomarkers and colon cancer, taking into consideration two primary aspects. First, some biomarkers may account for the phenotypic characteristics of tumors and second, some biomarkers may predict the prognosis of patients with cancer (43). However, the present study did not focus on indicators that can reflect both the tumor phenotype and the clinical prognosis of patients with cancer.
E2F2, SKP2, MYC, CDKN1A and CDKN2B, the hub genes identified in GSE21510 and GSE32323, were ubiquitously expressed in colon cancer at different stages of tumorigenesis. The mRNA expression levels of these five hub genes were further validated in genomic datasets. Furthermore, the hub DE genes exhibited the strongest association network among the TCGA datasets. However, based on the PPI network and the results in (31), it can be hypothesized that E2F2, SKP2, MYC, CDKN1A and CDKN2B may not be independent prognostic factors for CRC. Integrative survival analysis indicated that CDKN1A was associated with favorable prognosis (hazard ratio, 0.64; 95% confidence interval; log-rank, P=0.043). Therefore, CDKN1A is an indicator of tumor characteristics and may be used to predict patient prognosis. A previous study also indicated that differential expression of CDKN1A affected prognosis in the survival analysis of patients with gastric cancer (44). In this study, the GSE21510 and GSE32323 datasets were analyzed. However, the limited size of clinical samples may not be sufficient to reflect all different types of CRC. Therefore, further examination will be conducted, in order to verify the results of the present study.
At present, a limited number of tumor biomarkers can simultaneously predict tumor phenotype and patient prognosis. Based on the current results, CDKN1A may be a suitable tumor biomarker. CDKN1A may serve a predictive role for colon cancer phenotype and prognosis and the marker may be detected without deep sequencing using a kit or a chip, although this requires additional study. Future studies will aim to identify more tumor biomarkers and targets for the diagnosis and treatment of CRC.
Acknowledgements
The authors would like to acknowledge the technical guidance of Dr Chris Lou and Professor You Zai. The authors would also like to thank pathologist Dr Si Haipeng for her guidance on this experiment.
Funding
This study was supported by National Nature Science Foundation of China (grant nos. 81774266 and 81804058).
Availability of data and materials
The datasets used and/or analyzed during the current study are available from the corresponding author on reasonable request.
Authors' contributions
HZ conceived and designed the experiments. HZ and YJ performed the experiments. HZ and WL analyzed the data. WL and MW were significant contributors in the manuscript. MW participated in the design of this experiment and participated in the review of proofreading and manuscripts of experimental data. MW agreed to be responsible for all aspects of the work to ensure proper investigation and resolution of issues related to the accuracy or completeness of any part of the work. All authors have read and approved the final version of this manuscript.
Ethics approval and consent to participate
Not applicable.
Patient consent for publication
Not applicable.
Competing interests
The authors declare that they have no competing interests.
References
- 1.Hodson L, Skeaff CM, Fielding BA. Fatty acid composition of adipose tissue and blood in humans and its use as a biomarker of dietary intake. Prog Lipid Res. 2008;47:348–380. doi: 10.1016/j.plipres.2008.03.003. [DOI] [PubMed] [Google Scholar]
- 2.Yang C, Zhang J, Ding M, Xu K, Li L, Mao L, Zheng J. Ki67 targeted strategies for cancer therapy. Clin Transl Oncol. 2018;20:570–575. doi: 10.1007/s12094-017-1774-3. [DOI] [PubMed] [Google Scholar]
- 3.Li J, Zhang Z, Chen F, Hu T, Peng W, Gu Q, Sun Y. The diverse oncogenic and tumor suppressor roles of microRNA-105 in cancer. Front Oncol. 2019;9:518. doi: 10.3389/fonc.2019.00518. [DOI] [PMC free article] [PubMed] [Google Scholar]
- 4.Dong P, Xiong Y, Yue J, Hanley SJB, Kobayashi N, Todo Y, Watari H. Long Non-coding RNA NEAT1: A novel target for diagnosis and therapy in human tumors. Front Genet. 2018;9:471. doi: 10.3389/fgene.2018.00471. [DOI] [PMC free article] [PubMed] [Google Scholar]
- 5.Panoutsopoulou K, Avgeris M, Scorilas A. miRNA and long non-coding RNA: Molecular function and clinical value in breast and ovarian cancers. Expert Rev Mol Diagn. 2018;18:963–979. doi: 10.1080/14737159.2018.1538794. [DOI] [PubMed] [Google Scholar]
- 6.Arnold M, Sierra MS, Laversanne M, Soerjomataram I, Jemal A, Bray F. Global patterns and trends in colorectal cancer incidence and mortality. Gut. 2017;66:683–691. doi: 10.1136/gutjnl-2015-310912. [DOI] [PubMed] [Google Scholar]
- 7.Jemal A, Bray F, Center MM, Ferlay J, Ward E, Forman D. Global cancer statistics. CA Cancer J Clin. 2011;61:69–90. doi: 10.3322/caac.20107. [DOI] [PubMed] [Google Scholar]
- 8.Song N, Kim K, Shin A, Park JW, Chang HJ, Shi J, Cai Q, Kim DY, Zheng W, Oh JH. Colorectal cancer susceptibility loci and influence on survival. Genes Chromosomes Cancer. 2018;57:630–637. doi: 10.1002/gcc.22674. [DOI] [PubMed] [Google Scholar]
- 9.Lech G, Słotwiński R, Słodkowski M, Krasnodębski IW. Colorectal cancer tumour markers and biomarkers: Recent therapeutic advances. World J Gastroenterol. 2016;22:1745–1755. doi: 10.3748/wjg.v22.i5.1745. [DOI] [PMC free article] [PubMed] [Google Scholar]
- 10.Puccini A, Berger MD, Zhang W, Lenz HJ. What we know about stage II and III colon cancer: It's still not enough. Target Oncol. 2017;12:265–275. doi: 10.1007/s11523-017-0494-5. [DOI] [PMC free article] [PubMed] [Google Scholar]
- 11.Lan J, Sun L, Xu F, Liu L, Hu F, Song D, Hou Z, Wu W, Luo X, Wang J, et al. M2 macrophage-derived exosomes promote cell migration and invasion in colon cancer. Cancer Res. 2019;79:146–158. doi: 10.1158/0008-5472.CAN-18-0014. [DOI] [PubMed] [Google Scholar]
- 12.Tsukamoto S, Ishikawa T, Iida S, Ishiguro M, Mogushi K, Mizushima H, Uetake H, Tanaka H, Sugihara K. Clinical significance of osteoprotegerin expression in human colorectal cancer. Clin Cancer Res. 2011;17:2444–2450. doi: 10.1158/1078-0432.CCR-10-2884. [DOI] [PubMed] [Google Scholar]
- 13.Khamas A, Ishikawa T, Shimokawa K, Mogushi K, Iida S, Ishiguro M, Mizushima H, Tanaka H, Uetake H, Sugihara K. Screening for epigenetically masked genes in colorectal cancer Using 5-Aza-2′-deoxycytidine, microarray and gene expression profile. Cancer Genomics Proteomics. 2012;9:67–75. [PubMed] [Google Scholar]
- 14.R Core Team. R, corp-author. R Foundation for Statistical Computing; Vienna, Austria: 2012. A language and environment for statistical computing. [Google Scholar]
- 15.RStudio Team. RStudio, corp-author. RStudio, Inc.; Boston, MA: 2015. Integrated development for R. [Google Scholar]
- 16.Ritchie ME, Phipson B, Wu D, Hu Y, Law CW, Shi W, Smyth GK. Limma powers differential expression analyses for RNA-sequencing and microarray studies. Nucleic Acids Res. 2015;43:e47. doi: 10.1093/nar/gkv007. [DOI] [PMC free article] [PubMed] [Google Scholar]
- 17.Krüger T. Editorial change at statistical applications in genetics and molecular biology. Stat Appl Genet Mol. 2018;17(pii) doi: 10.1515/sagmb-2018-0046. doi: 10.1515/sagmb-2018-0046. [DOI] [PubMed] [Google Scholar]
- 18.Yu G, Wang L, Han Y, He Q. clusterProfiler: An R package for comparing biological themes among gene clusters. OMICS. 2012;16:284–287. doi: 10.1089/omi.2011.0118. [DOI] [PMC free article] [PubMed] [Google Scholar]
- 19.Szklarczyk D, Franceschini A, Wyder S, Forslund K, Heller D, Huerta-Cepas J, Simonovic M, Roth A, Santos A, Tsafou KP, et al. STRING v10: Protein-protein interaction networks, integrated over the tree of life. Nucleic Acids Res. 2015;43((Database Issue)):D447–D452. doi: 10.1093/nar/gku1003. [DOI] [PMC free article] [PubMed] [Google Scholar]
- 20.Henson DE, Hueman MT, Chen D, Patel JA, Wang H, Schwartz AM. The anatomy of the TNM for colon cancer. J Gastrointest Oncol. 2017;8:12–19. doi: 10.21037/jgo.2016.11.10. [DOI] [PMC free article] [PubMed] [Google Scholar]
- 21.Tang Z, Li C, Kang B, Gao G, Li C, Zhang Z. GEPIA: A web server for cancer and normal gene expression profiling and interactive analyses. Nucleic Acids Res. 2017;45:W98–W102. doi: 10.1093/nar/gkx247. [DOI] [PMC free article] [PubMed] [Google Scholar]
- 22.Zhao X, Ponomaryov T, Ornell KJ, Zhou P, Dabral SK, Pak E, Li W, Atwood SX, Whitson RJ, Chang AL, et al. RAS/MAPK activation drives resistance to Smo inhibition, metastasis, and tumor evolution in Shh pathway-dependent tumors. Cancer Res. 2015;75:3623–3635. doi: 10.1158/0008-5472.CAN-14-2999-T. [DOI] [PMC free article] [PubMed] [Google Scholar]
- 23.Ma D, Chen X, Zhang PY, Zhang H, Wei LJ, Hu S, Tang JZ, Zhou MT, Xie C, Ou R, et al. Upregulation of the ALDOA/DNA-PK/p53 pathway by dietary restriction suppresses tumor growth. Oncogene. 2018;37:1041–1048. doi: 10.1038/onc.2017.398. [DOI] [PubMed] [Google Scholar]
- 24.Duchartre Y, Kim Y, Kahn M. The Wnt signaling pathway in cancer. Crit Rev Oncol Hematol. 2016;99:141–149. doi: 10.1016/j.critrevonc.2015.12.005. [DOI] [PMC free article] [PubMed] [Google Scholar]
- 25.Kalkat M, Resetca D, Lourenco C, Chan P, Wei Y, Shiah Y, Vitkin N, Tong Y, Sunnerhagen M, Done SJ, et al. MYC protein interactome profiling reveals functionally distinct regions that cooperate to drive tumorigenesis. Mol Cell. 2018;72:836–848.e7. doi: 10.1016/j.molcel.2018.09.031. [DOI] [PubMed] [Google Scholar]
- 26.Stine ZE, Walton ZE, Altman BJ, Hsieh AL, Dang CV. MYC, metabolism, and cancer. Cancer Discov. 2015;5:1024–1039. doi: 10.1158/2159-8290.CD-15-0507. [DOI] [PMC free article] [PubMed] [Google Scholar]
- 27.Zhou J, Cheng M, Wu M, Boriboun C, Jujo K, Xu S, Zhao TC, Tang Y, Kishore R, Qin G. Contrasting roles of E2F2 and E2F3 in endothelial cell growth and ischemic angiogenesis. J Mol Cell Cardiol. 2013;60:68–71. doi: 10.1016/j.yjmcc.2013.04.009. [DOI] [PMC free article] [PubMed] [Google Scholar]
- 28.Gao Y, Feng B, Lu L, Han S, Chu X, Chen L, Wang R. MiRNAs and E2F3: A complex network of reciprocal regulations in human cancers. Oncotarget. 2017;8:60624–60639. doi: 10.18632/oncotarget.17364. [DOI] [PMC free article] [PubMed] [Google Scholar]
- 29.Lee SW, Li CF, Jin G, Cai Z, Han F, Chan CH, Yang WL, Li BK, Rezaeian AH, Li HY, et al. Skp2-dependent ubiquitination and activation of LKB1 is essential for cancer cell survival under energy stress. Mol Cell. 2015;57:1022–1033. doi: 10.1016/j.molcel.2015.01.015. [DOI] [PMC free article] [PubMed] [Google Scholar]
- 30.Yao R, Han D, Sun X, Xie Y, Wu Q, Fu C, Yao Y, Li H, Li Z, Xu K. Scriptaid inhibits cell survival, cell cycle, and promotes apoptosis in multiple myeloma via epigenetic regulation of p21. Exp Hematol. 2018;60:63–72. doi: 10.1016/j.exphem.2017.12.012. [DOI] [PubMed] [Google Scholar]
- 31.Wall SJ, Zhong Z, DeClerck YA. The Cyclin-dependent kinase inhibitors p15INK4B and p21CIP are critical regulators of fibrillar collagen-induced tumor cell cycle arrest. J Biol Chem. 2007;282:24471–24476. doi: 10.1074/jbc.M702697200. [DOI] [PubMed] [Google Scholar]
- 32.Ansems M, Søndergaard JN, Sieuwerts AM, Looman MW, Smid M, de Graaf AM, de Weerd V, Zuidscherwoude M, Foekens JA, Martens JW, Adema GJ. DC-SCRIPT is a novel regulator of the tumor suppressor gene CDKN2B and induces cell cycle arrest in ERα-positive breast cancer cells. Breast Cancer Res Treat. 2015;149:693–703. doi: 10.1007/s10549-015-3281-y. [DOI] [PMC free article] [PubMed] [Google Scholar]
- 33.Wang D, Han S, Peng R, Jiao C, Wang X, Yang X, Yang R, Li X. Depletion of histone demethylase KDM5B inhibits cell proliferation of hepatocellular carcinoma by regulation of cell cycle checkpoint proteins p15 and p27. J Exp Clin Cancer Res. 2016;35:37. doi: 10.1186/s13046-016-0311-5. [DOI] [PMC free article] [PubMed] [Google Scholar]
- 34.Park J, Park M, Oh EH, Soung N, Lee SJ, Jung J, Lee O, Yun SJ, Kim W, Shin E, Kim EG. The p21-activated kinase 4-Slug transcription factor axis promotes epithelial-mesenchymal transition and worsens prognosis in prostate cancer. Oncogene. 2018;37:5147–5159. doi: 10.1038/s41388-018-0327-8. [DOI] [PubMed] [Google Scholar]
- 35.Dutto I, Tillhon M, Cazzalini O, Stivala LA, Prosperi E. Biology of the cell cycle inhibitor p21CDKN1A: Molecular mechanisms and relevance in chemical toxicology. Arch Toxicol. 2015;89:155–178. doi: 10.1007/s00204-014-1430-4. [DOI] [PubMed] [Google Scholar]
- 36.Basudan A, Priedigkeit N, Hartmaier RJ, Sokol ES, Bahreini A, Watters RJ, Boisen MM, Bhargava R, Weiss KR, Karsten MM, et al. Frequent ESR1 and CDK pathway copy number alterations in metastatic breast cancer. Mol Cancer Res. 2019;17:457–468. doi: 10.1158/1541-7786.MCR-18-0946. [DOI] [PMC free article] [PubMed] [Google Scholar]
- 37.Li Z, Qiu R, Qiu X, Tian T. SNHG6 promotes tumor growth via repression of P21 in colorectal cancer. Cell Physiol Biochem. 2018;49:463–478. doi: 10.1159/000492986. [DOI] [PubMed] [Google Scholar]
- 38.Zhang Z, Li J, Huang Y, Peng W, Qian W, Gu J, Wang Q, Hu T, Ji D, Ji B, et al. Upregulated miR-1258 regulates cell cycle and inhibits cell proliferation by directly targeting E2F8 in CRC. Cell Prolif. 2018;51:e12505. doi: 10.1111/cpr.12505. [DOI] [PMC free article] [PubMed] [Google Scholar]
- 39.Chen Z, Hou R, Gao S, Song D, Feng Y. Baicalein inhibits proliferation activity of human colorectal cancer cells HCT116 through downregulation of Ezrin. Cell Physiol Biochem. 2018;49:2035–2046. doi: 10.1159/000493714. [DOI] [PubMed] [Google Scholar]
- 40.Del CS, Sayagues JM, Bengoechea O, Anduaga MF, Alcazar JA, Gervas R, Garcia J, Orfao A, Bellvis LM, Sarasquete ME, Del Mar Abad M. Spatio-temporal tumor heterogeneity in metastatic CRC tumors: A mutational-based approach. Oncotarget. 2018;9:34279–34288. doi: 10.18632/oncotarget.26081. [DOI] [PMC free article] [PubMed] [Google Scholar]
- 41.Xie XN, Yu J, Zhang LH, Luo ZY, Ouyang DS, Zheng LJ, Wang CY, Yang L, Chen L, Tan ZR. Relationship between polymorphisms of the lipid metabolism-related gene PLA2G16 and risk of colorectal cancer in the Chinese population. Funct Integr Genomic. 2019;19:227–236. doi: 10.1007/s10142-018-0642-8. [DOI] [PubMed] [Google Scholar]
- 42.Yu C, Hong H, Lu J, Zhao X, Hu W, Zhang S, Zong Y, Mao Z, Li J, Wang M, et al. Prediction of target genes and pathways associated with cetuximab insensitivity in colorectal cancer. Technol Cancer Res Treat. 2018;17 doi: 10.1177/1533033818806905. doi: 10.1177/1533033818806905. [DOI] [PMC free article] [PubMed] [Google Scholar]
- 43.Xue W, Li J, Wang F, Han P, Liu Y, Cui B. A long non-coding RNA expression signature to predict survival of patients with colon adenocarcinoma. Oncotarget. 2017;8:101298–101308. doi: 10.18632/oncotarget.21064. [DOI] [PMC free article] [PubMed] [Google Scholar]
- 44.Lin Y, Wang X, Yu Y, Liu W, Xie F, Ouyang X, Huang Q. Expression and prognostic significance of cyclin-dependent kinase inhibitor 1A in patients with resected gastric adenocarcinoma. Oncol Lett. 2017;14:7473–7482. doi: 10.3892/ol.2017.7107. [DOI] [PMC free article] [PubMed] [Google Scholar]
Associated Data
This section collects any data citations, data availability statements, or supplementary materials included in this article.
Data Availability Statement
The datasets used and/or analyzed during the current study are available from the corresponding author on reasonable request.


