

Abstract
Background
Metabolomics is a promising molecular tool to identify novel etiologic pathways leading to cancer. Using a targeted approach, we prospectively investigated the associations between metabolite concentrations in plasma and breast cancer risk.
Methods
A nested case-control study was established within the European Prospective Investigation into Cancer cohort, which included 1624 first primary incident invasive breast cancer cases (with known estrogen and progesterone receptor and HER2 status) and 1624 matched controls. Metabolites (n = 127, acylcarnitines, amino acids, biogenic amines, glycerophospholipids, hexose, sphingolipids) were measured by mass spectrometry in pre-diagnostic plasma samples and tested for associations with breast cancer incidence using multivariable conditional logistic regression.
Results
Among women not using hormones at baseline (n = 2248), and after control for multiple tests, concentrations of arginine (odds ratio [OR] per SD = 0.79, 95% confidence interval [CI] = 0.70–0.90), asparagine (OR = 0.83 (0.74–0.92)), and phosphatidylcholines (PCs) ae C36:3 (OR = 0.83 (0.76–0.90)), aa C36:3 (OR = 0.84 (0.77–0.93)), ae C34:2 (OR = 0.85 (0.78–0.94)), ae C36:2 (OR = 0.85 (0.78–0.88)), and ae C38:2 (OR = 0.84 (0.76–0.93)) were inversely associated with breast cancer risk, while the acylcarnitine C2 (OR = 1.23 (1.11–1.35)) was positively associated with disease risk. In the overall population, C2 (OR = 1.15 (1.06–1.24)) and PC ae C36:3 (OR = 0.88 (0.82–0.95)) were associated with risk of breast cancer, and these relationships did not differ by breast cancer subtype, age at diagnosis, fasting status, menopausal status, or adiposity.
Conclusions
These findings point to potentially novel pathways and biomarkers of breast cancer development. Results warrant replication in other epidemiological studies.
Electronic supplementary material
The online version of this article (10.1186/s12916-019-1408-4) contains supplementary material, which is available to authorized users.
Keywords: Breast cancer, Metabolomics, Prospective study
Background
Breast cancer is the most common cancer among women worldwide [1]. Known modifiable hormonal and lifestyle risk factors, however, are estimated to be responsible for only around 30% of breast cancers in high-income countries [2–8], so a better understanding of the etiology of the disease and of the biological mechanisms is needed.
The metabolome reflects endogenous processes and environmental and lifestyle factors [9–13]. Metabolomics can detect subtle differences in metabolism; therefore, it is a promising tool to identify new etiological pathways. Previous prospective studies of breast cancer which have employed metabolomics have used both targeted (analyses of a pre-defined panel of metabolites) [14] or untargeted (where as many metabolites as possible are measured and then characterized [15]) approaches [16–18]. In previous studies, lysophosphatidylcholine a C18:0 [14], various lipids, acetone, and glycerol-derived compounds [16], 16a-hydroxy-DHEA-3-sulfate, 3-methylglutarylcarnitine [17], and caprate (10:0), were associated with breast cancer development [18]. The number of cases included in these studies was, however, limited (from 200 to 621) and heterogeneity by subtype was investigated in only one study [18].
In the current study, we employed a targeted metabolomics approach to prospectively investigate the associations between 127 metabolites measured by mass spectrometry in pre-diagnostic plasma samples and risk of breast cancer, overall, and by breast cancer subtype, accounting for established breast cancer risk factors.
Methods
Study population, blood collection, and follow-up
EPIC is an ongoing multi-center cohort study including approximately 520,000 participants recruited between 1992 and 2000 from ten European countries [19]. Female participants (n = 367,903) were aged 35–75 years old at inclusion. At recruitment, detailed information was collected on dietary, lifestyle, reproductive, medical, and anthropometric data [19]. Around 246,000 women from all countries provided a baseline blood sample. Blood was collected according to a standardized protocol in France, Germany, Greece, Italy, the Netherlands, Norway, Spain, and the UK [19]. Serum (except in Norway), plasma, erythrocytes, and buffy coat aliquots were stored in liquid nitrogen (− 196 °C) in a centralized biobank at IARC. In Denmark, blood fractions were stored locally in the vapor phase of liquid nitrogen containers (− 150 °C), and in Sweden, they were stored locally at − 80 °C in standard freezers.
Incident cancer cases were identified through record linkage with cancer registries in most countries and through health insurance records, cancer and pathology registries, and active follow-up of study subjects in France, Germany, and Greece. For each EPIC center, closure dates of the study period were defined as the latest dates of complete follow-up for both cancer incidence and vital status (dates varied between centers, from June 2008 to December 2012).
All participants provided written informed consent to participate in the EPIC study. This study was approved by the ethics committee of the International Agency for Research on Cancer (IARC) and all centers.
Selection of cases and controls
Subjects were selected among participants who were cancer-free (other than non-melanoma skin cancer) and had donated blood at recruitment into the cohort. Cancers were coded according to the Third Edition of the International Classification of Diseases for Oncology (code C50). Women diagnosed with first primary invasive breast cancer at least 2 years after blood collection and before December 2012, for whom estrogen receptor (ER), progesterone receptor (PR), and human epidermal growth factor receptor 2 (HER2) statuses of the tumors were available, were selected as cases for the current study.
For each breast cancer case, one control was chosen at random among appropriate risk sets comprising all female cohort members who were alive and without cancer diagnosis (except non-melanoma skin cancer) at the time of diagnosis of the index case. Using incidence density sampling, controls were matched to cases on center of recruitment, age (± 6 months), menopausal status (premenopausal, perimenopausal, postmenopausal, surgically postmenopausal [20]), phase of the menstrual cycle [20], use of exogenous hormone at blood collection, time of the day (± 1 h), and fasting status at blood collection (non-fasting (< 3 h since last meal), in between (3–6 h), fasting (> 6 h), unknown).
Initially, 1626 cases and 1626 controls were eligible for the study, but after the exclusion of pregnant women at blood collection, a final population of 1624 cases and 1624 controls were included in the analysis.
Laboratory measurements
All plasma samples were assayed in the Biomarkers laboratory at IARC, using the AbsoluteIDQ p180 platform (Biocrates Life Sciences AG, Innsbruck, Austria) and following the procedure recommended by the vendor. A QTRAP5500 mass spectrometer (AB Sciex, Framingham, MA, USA) was used to measure 147 metabolites (19 acylcarnitines, 21 amino acids, 13 biogenic amines, 79 glycerophospholipids, 14 sphingolipids and hexoses). Samples from matched case-control sets were assayed in the same analytical batch. Laboratory personnel were blinded to case-control status of the samples.
Selection of metabolites
Metabolites were analyzed in samples from 3247 distinct subjects (one subject included in 2 pairs). Completeness of measures and coefficients of variation (median = 5.3%, interquartile range = 1.4%) are shown in Additional file 1: Table S1. Values lower than the lower limit of quantification (LLOQ), or higher than the upper limit of quantification (ULOQ), as well as lower than batch-specific limit of detection (LOD) (for compounds measured with a semi-quantitative method: acylcarnitines, glycerophospholipids, sphingolipids), were considered out of the measurable range. Metabolites were excluded from the statistical analyses if more than 20% of observations were outside the measurable range (n = 20). A total of 127 metabolites (8 acylcarnitines, 20 amino acids, 6 biogenic amines, 78 glycerophospholipids, 14 sphingolipids and hexoses) were finally retained for statistical analyses. Of these 127 metabolites, 113 had all values included in the measurable range. For the remaining 14 metabolites, values outside the quantifiable range (all lower than LLOQ or LOD) were imputed with half the LLOQ or half the batch-specific LOD, respectively.
Statistical analysis
Characteristics of cases and controls were described using mean and standard deviation (SD) or frequency. Geometric means were used to describe non log-transformed metabolite concentrations among cases and controls. Log-transformed metabolite concentrations were used in all other analyses. Partial Pearson’s correlations between metabolites, adjusted for age at blood collection, were estimated among controls.
We used conditional logistic regression to estimate the risk of breast cancer per standard deviation (SD) increase in metabolite concentration. The analysis was conditioned on the matching variables. Likelihood ratio tests were performed to compare linear models with cubic polynomial models in order to assess departure from linearity. Multiple testing was addressed by controlling for family-wise error rate at α = 0.05 by permutation-based stepdown minP adjustment of P values, as this method better accounts for the dependence of the tests [21, 22]. For comparison with previous studies, we also adjusted the raw P values using Bonferroni correction (P < 0.05/127) and controlling for the false discovery rate (FDR) at α = 0.05 [23]. All statistical tests were two-sided.
Metabolites showing a statistically significant association with risk of breast cancer after correcting for multiple testing were categorized into quintiles based on the distribution of the concentrations among controls, and odds ratios (OR) for risk of breast cancer were estimated in each category. For tests of linear trend, participants were assigned the median value in each quintile and we modeled the corresponding variable as a continuous term. To identify potential confounders, models of the metabolites of interest (continuous and quintiles) were adjusted separately for each potential confounder and estimates obtained were compared with estimates from models with matching variables only. Only variables that changed parameter estimates by more than 10% were retained in the multivariable model. Variables tested were as follows: age at first menstrual period (continuous), number of full-term pregnancies (0/1/2/≥ 3), age at first full-term pregnancy (never pregnant/quartiles), breastfeeding (ever/never/never pregnant/missing; duration in quintiles), ever use of oral contraceptive (yes/no), ever use of MHT (yes/no/missing), smoking status (never/former/current), level of physical activity (Cambridge index [24]: inactive/moderately inactive/moderately active/active), alcohol consumption (nondrinkers/> 0–3/3–12/12–24 g/day), education level (no schooling or primary/technical, professional or secondary/longer education), energy intake (continuous, quintiles), height (continuous, quintiles), sitting height (missing/quartiles), weight (continuous, quintiles), body mass index (continuous, quintiles), waist circumference (continuous, quintiles), hip circumference (continuous, quintiles), and hypertension (yes/no). For these variables, missing values were assigned the median (continuous variables) or mode (categorical variables) if they represented less than 5% of the population, or were otherwise classified in a “missing” category (breastfeeding, ever use of MHT, sitting height). Only waist circumference (continuous), hip circumference (continuous), and weight (continuous) were included in the final models. Given the correlations between these variables (> 0.77), these variables were included separately in three different models.
For those metabolites showing a significant association with breast cancer risk after controlling for multiple testing, heterogeneity was investigated by menopausal status at blood collection, use of exogenous hormones at blood collection, fasting status at blood collection, age at diagnosis (age 50 or older/younger than age 50), breast cancer subtype (ER+PR+/−HER2+, ER+PR+/−HER2−, ER−PR−HER2+, ER−PR−HER2−), time between blood collection diagnosis (2–8.6 years/more than 8.6 years), and at recruitment waist circumference (WC) (< 80 cm/≥80 cm), BMI (< 25 kg/m2/≥25 kg/m2), and country, by introducing interaction terms in the models. Subgroup analyses were conducted on the raw models. For WC, unconditional logistic regression adjusted for each matching factor was used. P values were not corrected for multiple tests since heterogeneity was investigated only for metabolites showing statistically significant associations with risk overall, after correction for multiple testing.
A sensitivity analysis of all 127 metabolites was performed on hormone non-users (1124 cases and 1124 controls) and by cancer subtype.
Analyses were conducted using SAS software for Windows (version 9.4, Copyright© 2017, SAS Institute Inc.) and R software (packages Epi and NPC) [25, 26].
Results
Cases were diagnosed on average 8.3 years after blood collection, at a mean age of 60.8 years. The majority of tumors were ER-positive (80.7%), PR-positive (68.2%), and HER2-negative (78.2%) (Table 1). Mean concentrations of metabolites by case/control status are shown in Additional file 1: Table S2.
Table 1.
Main characteristics of the study population
| Variables | N | Controls | Cases |
|---|---|---|---|
| N = 1624 | N = 1624 | ||
| Mean (SD) or N (%) | Mean (SD) or N (%) | ||
| Age at blood collection (years) | 3248 | 52.5 (7.9) | 52.5 (8.0) |
| Length of follow-up from blood collection (years) | 3248 | – | 8.3 (2.8) |
| Age at diagnosis (years) | 1624 | – | 60.8 (8.3) |
| ER status | 1624 | ||
| Negative | – | 313 (19.3) | |
| Positive | – | 1311 (80.7) | |
| PR status | 1624 | ||
| Negative | – | 516 (31.8) | |
| Positive | – | 1108 (68.2) | |
| HER2 status | 1624 | ||
| Negative | – | 1270 (78.2) | |
| Positive | – | 354 (21.8) | |
| Age at first menstrual period (years) | 3248 | 13.1 (1.6) | 13.0 (1.5) |
| Number of full-term pregnancies | 3248 | ||
| 0 | 215 (13.2) | 244 (15.0) | |
| 1 | 253 (15.6) | 310 (19.1) | |
| 2 | 729 (44.9) | 686 (42.2) | |
| ≥ 3 | 427 (26.3) | 384 (23.6) | |
| Age at first full-term pregnancy (years) | 2789 | 24.9 (4.3) | 25.3 (4.4) |
| Ever breastfed | 3248 | ||
| No | 194 (11.9) | 206 (12.7) | |
| Yes | 1116 (68.7) | 1080 (66.5) | |
| Never pregnant | 215 (13.2) | 244 (15.0) | |
| Missing | 99 (6.1) | 94 (5.8) | |
| Use of exogenous hormones at blood collection | 3248 | ||
| No | 1124 (69.2) | 1130 (69.6) | |
| Yes | 492 (30.3) | 494 (30.4) | |
| Missing | 8 (0.5) | 0 (0.0) | |
| Menopausal status at blood collection | 3248 | ||
| Premenopausal | 434 (26.7) | 434 (26.7) | |
| Postmenopausal | 869 (53.5) | 872 (53.7) | |
| Perimenopausal | 321 (19.8) | 318 (19.6) | |
| Fasting status at blood collection (time since last meal) | 3248 | ||
| < 3 h | 737 (45.4) | 731 (45.0) | |
| 3–6 h | 284 (17.5) | 285 (17.5) | |
| > 6 h | 580 (35.7) | 580 (35.7) | |
| Unknown | 23 (1.4) | 28 (1.7) | |
| Alcohol consumption at recruitment (g/day) | 3248 | 8.9 (12.2) | 10.2 (13.5) |
| Education level | 3248 | ||
| Primary/no schooling | 610 (37.6) | 597 (36.8) | |
| Technical/professional/secondary | 687 (42.3) | 688 (42.4) | |
| Longer education | 327 (20.1) | 339 (20.9) | |
| Height (cm) | 3248 | 161.4 (6.6) | 162.0 (6.6) |
| Weight (kg) | |||
| Age at diagnosis < 50 years old | 382 | 63.8 (11.3) | 63.0 (10.9) |
| Age at diagnosis ≥ 50 years old | 2866 | 66.7 (10.8) | 68.4 (12.2) |
| Body mass index (kg/m2) | |||
| Age at diagnosis < 50 years old | 382 | 24.2 (4.1) | 23.9 (4.2) |
| Age at diagnosis ≥ 50 years old | 2866 | 25.7 (4.1) | 26.1 (4.6) |
| Waist circumference (cm) | |||
| Age at diagnosis < 50 years old | 382 | 76.8 (9.8) | 76.4 (10.3) |
| Age at diagnosis ≥ 50 years old | 2866 | 81.0 (10.4) | 82.5 (11.3) |
| Hip circumference (cm) | |||
| Age at diagnosis < 50 years old | 382 | 99.0 (8.6) | 98.3 (8.4) |
| Age at diagnosis ≥ 50 years old | 2866 | 101.4 (8.0) | 102.7 (9.1) |
ER estrogen receptor, HER2 human epidermal growth factor receptor 2, PR progesterone receptor
Overall, positive, moderate correlations were observed among some of the amino acids, phosphatidylcholines (PCs), lysoPCs, and sphingomyelins (see Additional file 1: Figure S1); the average absolute correlations within each class was 0.36, 0.39, 0.45, and 0.55, respectively (data not tabulated).
Associations of metabolites with breast cancer risk
Prior to correction for multiple testing, 29 metabolites were significantly associated with the risk of breast cancer with a raw P value lower than 0.05 (Fig. 1a and Table 2), mainly amino acids, PCs (inversely associated), and acylcarnitines (directly associated). However, after adjusting for multiple testing (Fig. 1b), only C2 (OR for 1 SD increment = 1.15, 95% CI = 1.06–1.24, corrected P value = 0.031) and phosphatidylcholine PC ae C36:3 (OR for 1 SD increment = 0.88, 95% CI = 0.82–0.95, corrected P value = 0.044) remained significantly associated with risk of breast cancer (Table 2). Adjustment for multiple testing using FDR procedure identified similar significant metabolites, while with Bonferroni correction, only C2 remained associated with risk of breast cancer with a borderline significant P value (Bonferroni P value = 0.051) (Table 2). Departure from linearity was suggested for glutamate, C0, kynurerine, and SDMA. However, when non-linear models were examined, and after controlling for multiple tests, no non-linear association remained significant (results not shown).
Fig. 1.
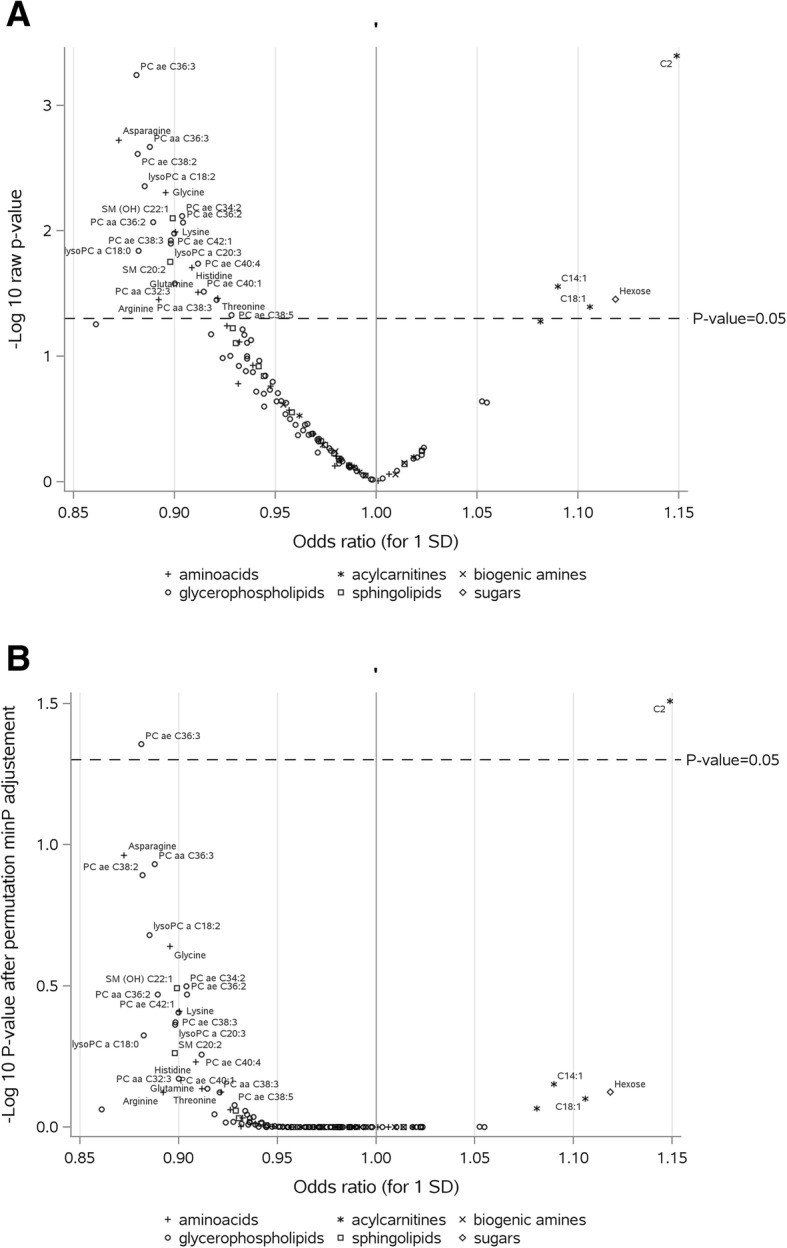
Odds ratios (ORs) for the associations between metabolites and breast cancer. a Raw P values. b Adjusted P values. PC: phosphatidylcholine; SM: sphingomyelin. ORs are estimated per standard deviation (SD) increase in log-transformed metabolite concentrations, from logistic regression conditioned on matching variables. a Statistical significance based on raw P values (significant metabolites above dotted line). b Statistical significance based on P values adjusted by permutation-based stepdown minP (see “Methods” section for details); adjusted P values above 0.05 (dotted line) were considered statistically significant after correction for multiple tests
Table 2.
Associations between metabolites (continuous) and risk of breast cancer, for metabolites with raw P values < 0.05
| Class | Metabolite | Odds ratio and 95% CI (for 1 SD)a | Raw P value | Permutation-based minP P valueb | Bonferroni P valuec | False discovery rate P valued |
|---|---|---|---|---|---|---|
| Amino acids | Arginine | 0.89 (0.80–0.99) | 0.035 | 0.753 | 1.000 | 0.166 |
| Asparagine | 0.87 (0.80–0.95) | 0.002 | 0.109 | 0.240 | 0.062 | |
| Glutamine | 0.91 (0.84–0.99) | 0.031 | 0.731 | 1.000 | 0.166 | |
| Glycine | 0.90 (0.83–0.97) | 0.005 | 0.229 | 0.629 | 0.090 | |
| Histidine | 0.91 (0.84–0.99) | 0.020 | 0.588 | 1.000 | 0.131 | |
| Lysine | 0.90 (0.83–0.98) | 0.010 | 0.389 | 1.000 | 0.102 | |
| Threonine | 0.92 (0.85–0.99) | 0.034 | 0.752 | 1.000 | 0.166 | |
| Acylcarnitines | C14:1 | 1.09 (1.01–1.18) | 0.028 | 0.704 | 1.000 | 0.166 |
| C18:1 | 1.11 (1.00–1.22) | 0.040 | 0.793 | 1.000 | 0.183 | |
| C2 | 1.15 (1.06–1.24) | 0.0004 | 0.031 | 0.051 | 0.036 | |
| Glycerophospholipids | PC aa C32:3 | 0.90 (0.82–0.99) | 0.026 | 0.674 | 1.000 | 0.166 |
| PC aa C36:2 | 0.89 (0.82–0.97) | 0.009 | 0.339 | 1.000 | 0.099 | |
| PC aa C36:3 | 0.89 (0.82–0.96) | 0.002 | 0.117 | 0.272 | 0.062 | |
| PC aa C38:3 | 0.92 (0.85–0.99) | 0.035 | 0.753 | 1.000 | 0.166 | |
| PC ae C34:2 | 0.90 (0.84–0.97) | 0.008 | 0.317 | 0.966 | 0.099 | |
| PC ae C36:2 | 0.90 (0.84–0.98) | 0.009 | 0.339 | 1.000 | 0.099 | |
| PC ae C36:3 | 0.88 (0.82–0.95) | 0.001 | 0.044 | 0.073 | 0.036 | |
| PC ae C38:2 | 0.88 (0.81–0.96) | 0.002 | 0.128 | 0.310 | 0.062 | |
| PC ae C38:3 | 0.90 (0.83–0.98) | 0.012 | 0.425 | 1.000 | 0.107 | |
| PC ae C38:5 | 0.93 (0.86–1.00) | 0.047 | 0.836 | 1.000 | 0.205 | |
| PC ae C40:1 | 0.92 (0.84–0.99) | 0.030 | 0.730 | 1.000 | 0.166 | |
| PC ae C40:4 | 0.91 (0.84–0.98) | 0.018 | 0.553 | 1.000 | 0.129 | |
| PC ae C42:1 | 0.90 (0.83–0.98) | 0.010 | 0.393 | 1.000 | 0.102 | |
| lysoPC a C18:0 | 0.88 (0.80–0.98) | 0.014 | 0.473 | 1.000 | 0.115 | |
| lysoPC a C18:2 | 0.89 (0.81–0.96) | 0.004 | 0.209 | 0.559 | 0.090 | |
| lysoPC a C20:3 | 0.90 (0.83–0.98) | 0.013 | 0.434 | 1.000 | 0.107 | |
| Sphingolipids | SM C20:2 | 0.90 (0.82–0.98) | 0.018 | 0.546 | 1.000 | 0.129 |
| SM (OH) C22:1 | 0.90 (0.83–0.97) | 0.008 | 0.322 | 1.000 | 0.099 | |
| Sugars | Hexose | 1.12 (1.01–1.24) | 0.035 | 0.752 | 1.000 | 0.166 |
SD standard deviation, CI confidence interval
Italicized text indicates a statistically significant association with breast cancer risk after adjustment of P values by permutation-based minP
aOdds ratios were estimated by logistic regression conditioned on center of recruitment, age, menopausal status at the time of blood collection, phase of the menstrual cycle at blood collection (for premenopausal women only), use of exogenous hormone at blood collection, time of the day at blood collection, and fasting status at blood collection
bMultiple testing controlled for family-wise error rate at α = 0.05 by permutation-based stepdown minP adjustment of P values
cMultiple testing controlled for family-wise error rate at α = 0.05 by Bonferroni adjustment of P values
dMultiple testing controlled for false discovery rate at α = 0.05
When C2 and PC ae C36:3 were further analyzed as categorical variables, results similar to those of the linear analysis were obtained; logistic regression conditioned on the matching variables showed a linear trend across quintiles of C2 (OR quintile 5 versus quintile 1 = 1.54, 95% CI = 1.21–1.95, P trend = 0.0002) and of PC ae C36:3 (OR quintile 5 versus quintile 1 = 0.73, 95% CI = 0.58–0.91, P trend = 0.0003) (Table 3). Adjusting for anthropometric variables in separate models had little effect on the risk estimates (Table 3).
Table 3.
Associations between C2 and PC ae C 36:3 and risk of breast cancer
| Cases/controls | Model 1c | Model 2—adjusted for WC | Model 3—adjusted for weight | Model 4—adjusted for HC | |
|---|---|---|---|---|---|
| OR (95% CI) | OR (95% CI) | OR (95% CI) | OR (95% CI) | ||
| C2 | |||||
| Per SD increment | 1624/1624 | 1.15 (1.06–1.24) | 1.14 (1.06–1.23) | 1.15 (1.06–1.24) | 1.14 (1.06–1.24) |
| C2 (quintiles)a | |||||
| 1 | 287/322 | 1.00 (ref.) | 1.00 (ref.) | 1.00 (ref.) | 1.00 (ref.) |
| 2 | 291/326 | 1.02 (0.81–1.28) | 1.00 (0.79–1.26) | 1.00 (0.80–1.27) | 1.00 (0.80–1.26) |
| 3 | 322/324 | 1.15 (0.91–1.44) | 1.12 (0.89–1.41) | 1.13 (0.90–1.42) | 1.13 (0.89–1.42) |
| 4 | 311/326 | 1.12 (0.89–1.41) | 1.09 (0.87–1.37) | 1.09 (0.87–1.37) | 1.10 (0.87–1.38) |
| 5 | 413/326 | 1.54 (1.21–1.95) | 1.51 (1.19–1.91) | 1.53 (1.20–1.93) | 1.52 (1.20–1.93) |
| P trendb | 0.0002 | 0.0005 | 0.0004 | 0.0004 | |
| PC ae C36:3 | |||||
| Per SD increment | 1624/1624 | 0.88 (0.82–0.95) | 0.90 (0.83–0.97) | 0.90 (0.83–0.96) | 0.89 (0.83–0.96) |
| PC ae C36:3 (quintiles)a | |||||
| 1 | 367/325 | 1.00 (ref.) | 1.00 (ref.) | 1.00 (ref.) | 1.00 (ref.) |
| 2 | 363/323 | 0.99 (0.80–1.23) | 1.01 (0.82–1.25) | 1.02 (0.82–1.26) | 1.02 (0.82–1.26) |
| 3 | 357/326 | 0.96 (0.77–1.19) | 0.98 (0.79–1.22) | 0.98 (0.79–1.22) | 0.97 (0.78–1.21) |
| 4 | 264/326 | 0.70 (0.56–0.88) | 0.73 (0.58–0.91) | 0.73 (0.58–0.91) | 0.72 (0.58–0.91) |
| 5 | 273/324 | 0.73 (0.58–0.91) | 0.77 (0.61–0.96) | 0.76 (0.61–0.96) | 0.75 (0.60–0.95) |
| P trendb | 0.0003 | 0.0020 | 0.0016 | 0.0010 | |
CI confidence interval, HC hip circumference, OR odds ratio, SD standard deviation, WC waist circumference
aQuintile cut-points were determined on control participants
For log-transformed C2, cut-points were as follows, in log(μmol/L): < 1.18/1.18–1.37/1.37–1.55/1.55–1.77/≥ 1.77. For log-transformed PC ae C36:3, cut-points were as follows, in log(μmol/L): < 1.81/1.81–1.94/1.94–2.04/2.04–2.16/≥ 2.16
bFor test of linear trends across quintiles, participants were assigned the median value in each category and the corresponding variable was modeled as a continuous term
cConditional logistic regression conditioned on matching factors
Stratification by hormone therapy
Statistically significant heterogeneity was observed by use of hormones at blood collection for the associations of C2 (P homogeneity = 0.035) and PC ae C36:3 (P homogeneity = 0.017) with breast cancer, with statistically significant associations restricted to hormone non-users (C2: OR per SD = 1.23, 95% CI = 1.11–1.35; PC ae C36:3: OR per SD = 0.83, 95% CI = 0.76–0.90) and no associations observed in users (C2: OR per SD = 1.03, 95% CI = 0.91–1.17; PC ae C36:3: OR per SD = 1.00, 95% CI = 0.88–1.13; Fig. 2).
Fig. 2.

Associations between C2 (a) and PC ae C36:3 (b) and breast cancer, by selected variables. CI: confidence interval; ER: estrogen receptor; HER2: human epidermal growth factor receptor 2; PC: phosphatidylcholine; PR: progesterone receptor; SM: sphingomyelin. Odds ratios (ORs) are estimated per standard deviation (SD) increase in log-transformed metabolite concentrations, from logistic regression conditioned on matching variables. Homogeneity was tested by adding an interaction term in the conditional logistic regression model for menopausal status, use of hormones at blood collection, fasting status, breast cancer subtype, and age at diagnosis (all matching factors or case characteristics). For waist circumference (non-matching factor), logistic regression adjusted for each matching factor was used
In an analysis of the 127 metabolites restricted to hormone non-users (n = 2248) (Fig. 3), we identified additional metabolites showing statistically significant inverse associations with risk of breast cancer after adjustment of P values for multiple testing, for which heterogeneity was also investigated. These metabolites were as follows: arginine (OR per SD = 0.79, 95% CI = 0.70–0.90; P homogeneity = 0.002), asparagine (OR per SD = 0.83, 95% CI = 0.74–0.92; P homogeneity = 0.12), PC aa C36:3 (OR per SD = 0.84, 95% CI = 0.77–0.93; P homogeneity = 0.12), PC ae C34:2 (OR per SD = 0.85, 95% CI = 0.78–0.94; P homogeneity = 0.04), PC ae C36:2 (OR per SD = 0.85, 95% CI = 0.78–0.88; P homogeneity = 0.04), and PC ae C38:2 (OR per SD = 0.84, 95% CI = 0.0.76–0.93; P homogeneity = 0.10).
Fig. 3.
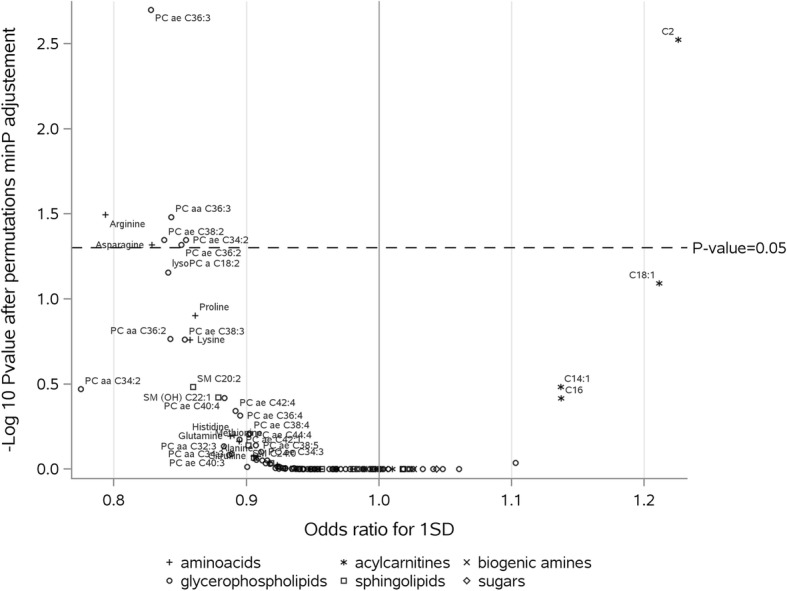
Adjusted P values for associations between metabolites and breast cancer, hormone non-users (1124 cases, 1124 controls). PC: phosphatidylcholine; SM: sphingomyelin. Odds ratios (ORs) are estimated per standard deviation (SD) increase in log-transformed metabolite concentrations, from logistic regression conditioned on matching variables. Raw P values were adjusted by permutation-based stepdown minP (see “Methods” section for details); adjusted P values above 0.05 (dotted line) were considered statistically significant after correction for multiple tests
No significant heterogeneity was observed for the association of C2 and PC ae C36:3 with breast cancer by menopausal status, fasting status at blood collection, breast cancer subtype, age at diagnosis, WC (P homogeneity all > 0.12, Fig. 2), country (P homogeneity of 0.50 for C2 and 0.12 for PC ae C36:3) or by time between blood collection and diagnosis (2–8.6/≥8.6 years (median); P homogeneity of 0.17 for C2 and 0.98 for PC ae C36:3) (data not shown).
Stratification by breast cancer subtypes for all metabolites (see Additional file 1: Figure S2) showed that no metabolite reached statistical significance after correction for multiple testing in each subtype, although for ER+PR+/−HER2− cases (n = 1084 cases), PC ae C36:3 and PC aa C36:3 had adjusted P values close to statistical significance (0.066 and 0.074, respectively).
Discussion
In this prospective analysis that investigated the association of 127 circulating metabolites with breast cancer incidence, among women not using hormones at baseline, and after control for multiple tests, acylcarnitine C2 was positively associated with risk of breast cancer, while levels of a set of phosphatidylcholines (ae C36:3, aa C36:3, ae C34:2, ae C36:2 and ae C38:2) and the amino acids arginine and asparagine were inversely associated with disease risk. In the overall population (hormone users and non-users), only C2 and PC ae C36:3 were associated with risk of breast cancer independently from breast cancer subtype, age at diagnosis, fasting and menopausal status at collection, or adiposity.
Acylcarnitine C2 plays a key role in the transport of fatty acids into the mitochondria for β-oxidation [27, 28]. In human intervention studies, plasma concentration levels have been seen to vary according to the activity of the fatty oxidation pathway [28, 29]. High C2 levels are associated to other known mechanisms involved in breast cancer development, such as hyperinsulinemia and insulin resistance [30], consistent with some studies showing increased plasma concentrations of acetylcarnitine in pre-diabetic or diabetic women [31–33]. An explanation for the associations observed only in women not using hormones, for C2 and for other metabolites, could be that due to their increased exposure to estrogens, MHT users are already at a higher risk of breast cancer than non-users [34], similarly to what is observed for BMI and postmenopausal breast cancer risk [35].
Phospholipids are a major component of cell membranes and play a major role in cell signaling and cell cycle regulation. Previous studies of phospholipids showed that PC ae C36:3 concentrations were decreased in type 2 diabetes [36, 37] and that lower serum levels were predictive of future diabetes [38]. Lower concentrations of PCs ae C38:2 and ae C34:2 were also observed in diabetic men compared to non-diabetics [37]. A biological basis for such inverse associations could rely on observed antioxidant effect of PCs [39].
In line with the inverse association observed between arginine and risk of breast cancer in hormone non-users, decreased plasma concentrations of arginine has been observed in breast cancer patients [40] compared with controls. Both human [41] and animal [42] studies have observed a reduction in anti-tumor immune responses in the context of arginine depletion in breast cancer, suggesting a link between arginine and immunity. In addition, higher plasma concentrations of arginine were correlated with lower estradiol and insulin-like growth factor 1 concentrations in premenopausal women [43], linking arginine to known mechanisms leading to breast cancer development. Regarding asparagine, a recent animal and in vitro study suggested that reduced asparagine bioavailability resulted in slower disease progression [44]. However, the role of asparagine in cancer development is not clear.
Prospective data on metabolomics and risk of breast cancer are limited [14, 16–18], and differences in approaches (targeted or untargeted metabolomics), analytical methods (NMR or MS), and samples (serum or plasma) make comparisons of the results difficult. Only one previous analysis used a similar targeted metabolomics approach with measurement of the same metabolites [14] and showed that lysophosphatidylcholine a C18:0 was inversely associated with risk of breast cancer after Bonferroni correction of P values, and that an inverse association close to statistical significance was observed for PC ae C38:1. However, none of the metabolites identified in the present work were associated with risk of breast cancer in this previous study, which did not investigate heterogeneity by use of hormones.
In a previous study applying NMR-based metabolomics analyses in the SU.VI.MAX cohort [16], several amino acids, lipoproteins, lipids, and glycerol-derived compounds were identified as significantly associated to breast cancer risk, suggesting that modifications in amino acid metabolism and energetic homeostasis in the context of setting up of insulin resistance could play a role in the disease. Results from the Prostate, Lung, Colorectal, and Ovarian Cancer Screening (PLCO) study, based on an MS-based metabolomics approach in serum samples, indicated that some metabolites correlated with alcohol intake (androgen pathway metabolites, vitamin E, and animal fats) [18], and with BMI (metabolites involved in steroid hormones metabolism and branched-chain amino acids) [17], were also associated with breast cancer risk.
Heterogeneity by subtype was investigated only in the PLCO study, showing that some metabolites (allo-isoleucine, 2-methylbutyrylcarnitine [17], etiocholanolone glucuronide, 2-hydroxy-3-mthylvalerate, pyroglutamine, 5α-androstan-3β, 17β-diol disulfate [18]) were associated with risk of ER+ breast cancer, but not with breast cancer overall, indicating that the etiology of breast cancer differs by subtype. In our work, however, we did not observe any heterogeneity of results according to receptor status of the cancers.
This study is the largest prospective investigation of metabolomics and risk of breast cancer to date. Strengths of this work include its large sample size, which allowed us to examine associations by breast cancer subtype. In addition, the exclusion of cases diagnosed less than 2 years after blood collection reduces the risk of reverse causation in our findings. Finally, the assessment of numerous lifestyle factors and anthropometric measures allowed us to examine and control for potential confounding.
A potential limitation to our work is that blood was collected from participants at one time point only. Nevertheless, the reliability of plasma metabolites analyzed here has been shown to be relatively stable over 4 months to 2 years, leading to the conclusion that a single measurement might be sufficient [45, 46, 47]. In addition, although fasting samples might be preferable over non-fasting samples, in our study, cases and controls were matched on fasting status and the results did not differ by fasting state. Another limitation is that the technologies that were used for some of the metabolites (such as PCs and lysoPCs) do not allow for a precise identification of the compounds measured, since the signal observed is not specific and may correspond to several compounds. Lastly, it is important to note that the aim of the present work was to screen metabolites associated with risk, but that further work is needed to identify the factors that influence biological levels of the metabolites associated with risk and to understand their biological connection with breast cancer development. Future studies should also integrate other molecular markers known to be linked to breast cancer to gain insight into biological mechanisms.
Conclusions
We observed a positive association between acetylcarnitine (C2) and risk of breast cancer, and an inverse association between PC ae C36:3 and risk of breast cancer. These associations were limited to women not using hormones, as were inverse associations with arginine, asparagine, PCs aa C36:3, ae C34:2, ae C36:2, and ae C38:2. These metabolites might be biomarkers of future breast cancer development. These results need to be replicated in other epidemiological studies, and more research is needed to identify determinants of these metabolites.
Additional files
Supplementary tables describing the completeness of the metabolites measures (Table S1.) and metabolites concentrations by case-control status (Table S2..); Supplementary figures showing age-adjusted correlations between metabolites in control participants (Figure S1.) and adjusted P values for associations between metabolites and different breast cancer subtypes (Figure S2.). Abbreviations: BMI: Body Mass Index; EPIC: European Prospective Investigation into Cancer and nutrition; ER: estrogen receptor; FDR: False Discovery Rate; HER2: Human epidermal growth factor receptor 2; IARC: International Agency for Research on Cancer; MHT: menopause hormone therapy; MS: Mass spectrometry; NMR: nuclear magnetic resonance; OR: odds ratio; PC: phosphatidylcholine; PR: progesterone receptor; SD: standard deviation; WC: waist circumference. (PDF 1041 kb)
Acknowledgements
The authors thank the National Institute for Public Health and the Environment (RIVM), Bilthoven, the Netherlands, and the EPIC-Norfolk center for their contribution and ongoing support to the EPIC Study, Bertrand Hémon and Carine Biessy for their help with the EPIC database, and all EPIC participants.
Authors’ contributions
The authors’ responsibilities were as follows. SR, LD, and IR conceived and designed the research. MH and VV analyzed the data. MH, SR, LD, and MJG were responsible for drafting the manuscript. AG, DA, and SR conducted and supervised metabolomics analyses. AS, PF, NCOM, EW, CCD, KO, AO, ATj, AF, JAR, GS, TK, RTF, HB, ATr, AK, GMar, GMas, SS, RT, PV, SP, CVG, THN, TMS, GS, JRQ, AA, MJS, PA, JMH, EA, JAS, RCT, KKT, and SC provided the original data, information on the respective populations, and advice on the study design and analysis and interpretation of the results. ER was the overall coordinator of the EPIC project, which was conceptualized, designed, and implemented in collaboration with the principal investigators in the collaborating centers. All authors read and approved the final manuscript.
Funding
This work was funded by the French National Cancer Institute (grant number 2015-166). Mathilde His’ work reported here was undertaken during the tenure of a postdoctoral fellowship awarded by the International Agency for Research on Cancer, financed by the Fondation ARC.
The coordination of EPIC is financially supported by the European Commission (DG-SANCO) and the International Agency for Research on Cancer. The national cohorts are supported by Danish Cancer Society (Denmark); Ligue Contre le Cancer, Institut Gustave Roussy, Mutuelle Générale de l’Education Nationale, Institut National de la Santé et de la Recherche Médicale (INSERM) (France); German Cancer Aid, German Cancer Research Center (DKFZ), Federal Ministry of Education and Research (BMBF), Deutsche Krebshilfe, Deutsches Krebsforschungszentrum and Federal Ministry of Education and Research (Germany); the Hellenic Health Foundation (Greece); Associazione Italiana per la Ricerca sul Cancro-AIRC-Italy and National Research Council (Italy); Dutch Ministry of Public Health, Welfare and Sports (VWS), Netherlands Cancer Registry (NKR), LK Research Funds, Dutch Prevention Funds, Dutch ZON (Zorg Onderzoek Nederland), World Cancer Research Fund (WCRF), Statistics Netherlands (The Netherlands); European Research Council (ERC-2009-AdG 232997), and Nordforsk, Nordic Centre of Excellence Programme on Food, Nutrition and Health (Norway); Regional Governments of Andalucía, Asturias, Basque Country, Murcia (no. 6236), Navarra, and the CERCA Program (Generalitat de Catalunya) (Spain); Swedish Cancer Society, Swedish Research Council and County Councils of Skåne and Västerbotten (Sweden); and Cancer Research UK (14136 to EPIC-Norfolk; C570/A16491 and C8221/A19170 to EPIC-Oxford), Medical Research Council (1000143 to EPIC-Norfolk, MR/M012190/1 to EPIC-Oxford) (United Kingdom). The funders were not involved in designing the study; collecting, analyzing or interpreting the data; or in writing or submitting the manuscript for publication. Where authors are identified as personnel of the International Agency for Research on Cancer/World Health Organization, the authors alone are responsible for the views expressed in this article and they do not necessarily represent the decisions, policy, or views of the International Agency for Research on Cancer/World Health Organization.
Availability of data and materials
EPIC data are available for investigators who seek to answer important questions on health and disease in the context of research projects that are consistent with the legal and ethical standard practices of IARC/WHO and the EPIC Centres. The primary responsibility for accessing the data belongs to the EPIC Centres that provided them. For information on how to submit an application for gaining access to EPIC data and/or biospecimens, please follow the instructions at http://epic.iarc.fr/access/index.php.
Ethics approval and consent to participate
This study complies with the Declaration of Helsinki. The study has been approved by the IARC Ethics Committee (ref IEC 14-02). Ethical review boards of IARC and all local institutions where participants had been recruited gave approval for the study, and all participants gave written informed consent for data collection and storage, as well as individual follow-up.
Consent for publication
Not applicable.
Competing interests
The authors declare that they have no competing interests.
Footnotes
Publisher’s Note
Springer Nature remains neutral with regard to jurisdictional claims in published maps and institutional affiliations.
References
- 1.Bray Freddie, Ferlay Jacques, Soerjomataram Isabelle, Siegel Rebecca L., Torre Lindsey A., Jemal Ahmedin. Global cancer statistics 2018: GLOBOCAN estimates of incidence and mortality worldwide for 36 cancers in 185 countries. CA: A Cancer Journal for Clinicians. 2018;68(6):394–424. doi: 10.3322/caac.21492. [DOI] [PubMed] [Google Scholar]
- 2.World Cancer Research Fund International / American Institute for Cancer Research . Continuous update project report: diet, nutrition and physical activity and breast cancer. 2017. [Google Scholar]
- 3.Gaudet MM, Gierach GL, Carter BD, Luo J, Milne RL, Weiderpass E, Giles GG, Tamimi RM, Eliassen AH, Rosner B, et al. Pooled analysis of nine cohorts reveals breast cancer risk factors by tumor molecular subtype. Cancer Res. 2018;78(20):6011–6021. doi: 10.1158/0008-5472.CAN-18-0502. [DOI] [PMC free article] [PubMed] [Google Scholar]
- 4.Parkin DM, Boyd L, Walker LC. 16. The fraction of cancer attributable to lifestyle and environmental factors in the UK in 2010. Br J Cancer. 2011;105(Suppl 2):S77–S81. doi: 10.1038/bjc.2011.489. [DOI] [PMC free article] [PubMed] [Google Scholar]
- 5.Brown KF, Rumgay H, Dunlop C, Ryan M, Quartly F, Cox A, Deas A, Elliss-Brookes L, Gavin A, Hounsome L, et al. The fraction of cancer attributable to modifiable risk factors in England, Wales, Scotland, Northern Ireland, and the United Kingdom in 2015. Br J Cancer. 2018;118(8):1130–1141. doi: 10.1038/s41416-018-0029-6. [DOI] [PMC free article] [PubMed] [Google Scholar]
- 6.Islami F, Goding Sauer A, Miller KD, Siegel RL, Fedewa SA, Jacobs EJ, McCullough ML, Patel AV, Ma J, Soerjomataram I, et al. Proportion and number of cancer cases and deaths attributable to potentially modifiable risk factors in the United States. CA Cancer J Clin. 2018;68(1):31–54. doi: 10.3322/caac.21440. [DOI] [PubMed] [Google Scholar]
- 7.IARC . Les cancers attribuables au mode de vie et à l’environnement en France métropolitaine. Lyon: International Agency for Research on Cancer; 2018. [Google Scholar]
- 8.Whiteman DC, Webb PM, Green AC, Neale RE, Fritschi L, Bain CJ, Parkin DM, Wilson LF, Olsen CM, Nagle CM, et al. Cancers in Australia in 2010 attributable to modifiable factors: summary and conclusions. Aust N Z J Public Health. 2015;39(5):477–484. doi: 10.1111/1753-6405.12471. [DOI] [PMC free article] [PubMed] [Google Scholar]
- 9.Carayol M, Leitzmann MF, Ferrari P, Zamora-Ros R, Achaintre D, Stepien M, Schmidt JA, Travis RC, Overvad K, Tjonneland A, et al. Blood metabolic signatures of body mass index: a targeted metabolomics study in the EPIC cohort. J Proteome Res. 2017;16(9):3137–3146. doi: 10.1021/acs.jproteome.6b01062. [DOI] [PMC free article] [PubMed] [Google Scholar]
- 10.van Roekel EH, Trijsburg L, Assi N, Carayol M, Achaintre D, Murphy N, Rinaldi S, Schmidt JA, Stepien M, Kaaks R, et al. Circulating metabolites associated with alcohol intake in the European Prospective Investigation into Cancer and Nutrition Cohort. Nutrients. 2018;10(5):E654. [DOI] [PMC free article] [PubMed]
- 11.Schmidt JA, Rinaldi S, Ferrari P, Carayol M, Achaintre D, Scalbert A, Cross AJ, Gunter MJ, Fensom GK, Appleby PN, et al. Metabolic profiles of male meat eaters, fish eaters, vegetarians, and vegans from the EPIC-Oxford cohort. Am J Clin Nutr. 2015;102(6):1518–1526. doi: 10.3945/ajcn.115.111989. [DOI] [PMC free article] [PubMed] [Google Scholar]
- 12.Ruoppolo M, Campesi I, Scolamiero E, Pecce R, Caterino M, Cherchi S, Mercuro G, Tonolo G, Franconi F. Serum metabolomic profiles suggest influence of sex and oral contraceptive use. Am J Transl Res. 2014;6(5):614–624. [PMC free article] [PubMed] [Google Scholar]
- 13.Stevens VL, Wang Y, Carter BD, Gaudet MM, Gapstur SM. Serum metabolomic profiles associated with postmenopausal hormone use. Metabolomics. 2018;14(7):97. [DOI] [PubMed]
- 14.Kuhn T, Floegel A, Sookthai D, Johnson T, Rolle-Kampczyk U, Otto W, von Bergen M, Boeing H, Kaaks R. Higher plasma levels of lysophosphatidylcholine 18:0 are related to a lower risk of common cancers in a prospective metabolomics study. BMC Med. 2016;14:13. doi: 10.1186/s12916-016-0552-3. [DOI] [PMC free article] [PubMed] [Google Scholar]
- 15.Patti GJ, Yanes O, Siuzdak G. Innovation: metabolomics: the apogee of the omics trilogy. Nat Rev Mol Cell Biol. 2012;13(4):263–269. doi: 10.1038/nrm3314. [DOI] [PMC free article] [PubMed] [Google Scholar]
- 16.Lecuyer L, Victor Bala A, Deschasaux M, Bouchemal N, Nawfal Triba M, Vasson MP, Rossary A, Demidem A, Galan P, Hercberg S, et al. NMR metabolomic signatures reveal predictive plasma metabolites associated with long-term risk of developing breast cancer. Int J Epidemiol. 2018;47(2):484–494. doi: 10.1093/ije/dyx271. [DOI] [PubMed] [Google Scholar]
- 17.Moore SC, Playdon MC, Sampson JN, Hoover RN, Trabert B, Matthews CE, Ziegler RG. A metabolomics analysis of body mass index and postmenopausal breast cancer risk. J Natl Cancer Inst. 2018;110(6):588–597. doi: 10.1093/jnci/djx244. [DOI] [PMC free article] [PubMed] [Google Scholar]
- 18.Playdon MC, Ziegler RG, Sampson JN, Stolzenberg-Solomon R, Thompson HJ, Irwin ML, Mayne ST, Hoover RN, Moore SC. Nutritional metabolomics and breast cancer risk in a prospective study. Am J Clin Nutr. 2017;106(2):637–649. doi: 10.3945/ajcn.116.150912. [DOI] [PMC free article] [PubMed] [Google Scholar]
- 19.Riboli E, Hunt KJ, Slimani N, Ferrari P, Norat T, Fahey M, Charrondiere UR, Hemon B, Casagrande C, Vignat J, et al. European Prospective Investigation into Cancer and Nutrition (EPIC): study populations and data collection. Public Health Nutr. 2002;5(6B):1113–1124. doi: 10.1079/PHN2002394. [DOI] [PubMed] [Google Scholar]
- 20.Kaaks R, Berrino F, Key T, Rinaldi S, Dossus L, Biessy C, Secreto G, Amiano P, Bingham S, Boeing H, et al. Serum sex steroids in premenopausal women and breast cancer risk within the European Prospective Investigation into Cancer and Nutrition (EPIC) J Natl Cancer Inst. 2005;97(10):755–765. doi: 10.1093/jnci/dji132. [DOI] [PubMed] [Google Scholar]
- 21.Westfall PH, Young SS. Resampling-based multiple testing: examples and methods for p-value adjustment. New York: Wiley; 1993. [Google Scholar]
- 22.Rempala Grzegorz A., Yang Yuhong. On permutation procedures for strong control in multiple testing with gene expression data. Statistics and Its Interface. 2013;6(1):79–89. doi: 10.4310/SII.2013.v6.n1.a8. [DOI] [PMC free article] [PubMed] [Google Scholar]
- 23.Benjamini Y, Hochberg Y. Controlling the false discovery rate - a practical and powerful approach to multiple testing. J Roy Stat Soc B Met. 1995;57(1):289–300. [Google Scholar]
- 24.Wareham NJ, Jakes RW, Rennie KL, Schuit J, Mitchell J, Hennings S, Day NE. Validity and repeatability of a simple index derived from the short physical activity questionnaire used in the European Prospective Investigation into Cancer and Nutrition (EPIC) study. Public Health Nutr. 2003;6(4):407–413. doi: 10.1079/PHN2002439. [DOI] [PubMed] [Google Scholar]
- 25.Caughey D. NPC: Nonparametric Combination of Hypothesis Tests_. R package version 1.1.0. 2016. [Google Scholar]
- 26.Carstensen BPM, Laara E, Hills M. Epi: a package for statistical analysis in epidemiology_. R package version 2.30. 2018. [Google Scholar]
- 27.Flanagan JL, Simmons PA, Vehige J, Willcox MD, Garrett Q. Role of carnitine in disease. Nutr Metab (Lond) 2010;7:30. doi: 10.1186/1743-7075-7-30. [DOI] [PMC free article] [PubMed] [Google Scholar]
- 28.Bene J, Hadzsiev K, Melegh B. Role of carnitine and its derivatives in the development and management of type 2 diabetes. Nutr Diabetes. 2018;8(1):8. doi: 10.1038/s41387-018-0017-1. [DOI] [PMC free article] [PubMed] [Google Scholar]
- 29.Schooneman MG, Vaz FM, Houten SM, Soeters MR. Acylcarnitines: reflecting or inflicting insulin resistance? Diabetes. 2013;62(1):1–8. doi: 10.2337/db12-0466. [DOI] [PMC free article] [PubMed] [Google Scholar]
- 30.Renehan AG, Zwahlen M, Egger M. Adiposity and cancer risk: new mechanistic insights from epidemiology. Nat Rev Cancer. 2015;15(8):484–498. doi: 10.1038/nrc3967. [DOI] [PubMed] [Google Scholar]
- 31.Adams SH, Hoppel CL, Lok KH, Zhao L, Wong SW, Minkler PE, Hwang DH, Newman JW, Garvey WT. Plasma acylcarnitine profiles suggest incomplete long-chain fatty acid beta-oxidation and altered tricarboxylic acid cycle activity in type 2 diabetic African-American women. J Nutr. 2009;139(6):1073–1081. doi: 10.3945/jn.108.103754. [DOI] [PMC free article] [PubMed] [Google Scholar]
- 32.Mai M, Tonjes A, Kovacs P, Stumvoll M, Fiedler GM, Leichtle AB. Serum levels of acylcarnitines are altered in prediabetic conditions. PLoS One. 2013;8(12):e82459. doi: 10.1371/journal.pone.0082459. [DOI] [PMC free article] [PubMed] [Google Scholar]
- 33.Wang-Sattler R, Yu Z, Herder C, Messias AC, Floegel A, He Y, Heim K, Campillos M, Holzapfel C, Thorand B, et al. Novel biomarkers for pre-diabetes identified by metabolomics. Mol Syst Biol. 2012;8:615. doi: 10.1038/msb.2012.43. [DOI] [PMC free article] [PubMed] [Google Scholar]
- 34.Feigelson HS, Jonas CR, Teras LR, Thun MJ, Calle EE. Weight gain, body mass index, hormone replacement therapy, and postmenopausal breast cancer in a large prospective study. Cancer Epidemiol Biomark Prev. 2004;13(2):220–224. doi: 10.1158/1055-9965.EPI-03-0301. [DOI] [PubMed] [Google Scholar]
- 35.IARC: Absence of excess body fatness. In: IARC handbooks of cancer prevention. Edited by IARC, vol. 16. Lyon: International Agency for Research on Cancer; 2018. [PubMed]
- 36.Zhang W, Randell EW, Sun G, Likhodii S, Liu M, Furey A, Zhai G. Hyperglycemia-related advanced glycation end-products is associated with the altered phosphatidylcholine metabolism in osteoarthritis patients with diabetes. PLoS One. 2017;12(9):e0184105. doi: 10.1371/journal.pone.0184105. [DOI] [PMC free article] [PubMed] [Google Scholar]
- 37.Suhre K, Meisinger C, Doring A, Altmaier E, Belcredi P, Gieger C, Chang D, Milburn MV, Gall WE, Weinberger KM, et al. Metabolic footprint of diabetes: a multiplatform metabolomics study in an epidemiological setting. PLoS One. 2010;5(11):e13953. doi: 10.1371/journal.pone.0013953. [DOI] [PMC free article] [PubMed] [Google Scholar]
- 38.Yang SJ, Kwak SY, Jo G, Song TJ, Shin MJ. Serum metabolite profile associated with incident type 2 diabetes in Koreans: findings from the Korean genome and epidemiology study. Sci Rep. 2018;8(1):8207. doi: 10.1038/s41598-018-26320-9. [DOI] [PMC free article] [PubMed] [Google Scholar]
- 39.Wallner S, Schmitz G. Plasmalogens the neglected regulatory and scavenging lipid species. Chem Phys Lipids. 2011;164(6):573–589. doi: 10.1016/j.chemphyslip.2011.06.008. [DOI] [PubMed] [Google Scholar]
- 40.Vissers YL, Dejong CH, Luiking YC, Fearon KC, von Meyenfeldt MF, Deutz NE. Plasma arginine concentrations are reduced in cancer patients: evidence for arginine deficiency? Am J Clin Nutr. 2005;81(5):1142–1146. doi: 10.1093/ajcn/81.5.1142. [DOI] [PubMed] [Google Scholar]
- 41.Brittenden J, Park KG, Heys SD, Ross C, Ashby J, Ah-See A, Eremin O. L-arginine stimulates host defenses in patients with breast cancer. Surgery. 1994;115(2):205–212. [PubMed] [Google Scholar]
- 42.Cao Y, Feng Y, Zhang Y, Zhu X, Jin F. L-arginine supplementation inhibits the growth of breast cancer by enhancing innate and adaptive immune responses mediated by suppression of MDSCs in vivo. BMC Cancer. 2016;16:343. doi: 10.1186/s12885-016-2376-0. [DOI] [PMC free article] [PubMed] [Google Scholar]
- 43.Nagata C, Wada K, Tsuji M, Hayashi M, Takeda N, Yasuda K. Plasma amino acid profiles are associated with biomarkers of breast cancer risk in premenopausal Japanese women. Cancer Causes Control. 2014;25(2):143–149. doi: 10.1007/s10552-013-0316-8. [DOI] [PubMed] [Google Scholar]
- 44.Knott SRV, Wagenblast E, Khan S, Kim SY, Soto M, Wagner M, Turgeon MO, Fish L, Erard N, Gable AL, et al. Asparagine bioavailability governs metastasis in a model of breast cancer. Nature. 2018;554(7692):378–381. doi: 10.1038/nature25465. [DOI] [PMC free article] [PubMed] [Google Scholar]
- 45.Carayol M, Licaj I, Achaintre D, Sacerdote C, Vineis P, Key TJ, Onland Moret NC, Scalbert A, Rinaldi S, Ferrari P. Reliability of serum metabolites over a two-year period: a targeted metabolomic approach in fasting and non-fasting samples from EPIC. PLoS One. 2015;10(8):e0135437. doi: 10.1371/journal.pone.0135437. [DOI] [PMC free article] [PubMed] [Google Scholar]
- 46.Floegel A, Drogan D, Wang-Sattler R, Prehn C, Illig T, Adamski J, Joost HG, Boeing H, Pischon T. Reliability of serum metabolite concentrations over a 4-month period using a targeted metabolomic approach. PLoS One. 2011;6(6):e21103. doi: 10.1371/journal.pone.0021103. [DOI] [PMC free article] [PubMed] [Google Scholar]
- 47.Townsend MK, Clish CB, Kraft P, Wu C, Souza AL, Deik AA, Tworoger SS, Wolpin BM. Reproducibility of metabolomic profiles among men and women in 2 large cohort studies. Clin Chem. 2013;59(11):1657–1667. doi: 10.1373/clinchem.2012.199133. [DOI] [PMC free article] [PubMed] [Google Scholar]
Associated Data
This section collects any data citations, data availability statements, or supplementary materials included in this article.
Supplementary Materials
Supplementary tables describing the completeness of the metabolites measures (Table S1.) and metabolites concentrations by case-control status (Table S2..); Supplementary figures showing age-adjusted correlations between metabolites in control participants (Figure S1.) and adjusted P values for associations between metabolites and different breast cancer subtypes (Figure S2.). Abbreviations: BMI: Body Mass Index; EPIC: European Prospective Investigation into Cancer and nutrition; ER: estrogen receptor; FDR: False Discovery Rate; HER2: Human epidermal growth factor receptor 2; IARC: International Agency for Research on Cancer; MHT: menopause hormone therapy; MS: Mass spectrometry; NMR: nuclear magnetic resonance; OR: odds ratio; PC: phosphatidylcholine; PR: progesterone receptor; SD: standard deviation; WC: waist circumference. (PDF 1041 kb)
Data Availability Statement
EPIC data are available for investigators who seek to answer important questions on health and disease in the context of research projects that are consistent with the legal and ethical standard practices of IARC/WHO and the EPIC Centres. The primary responsibility for accessing the data belongs to the EPIC Centres that provided them. For information on how to submit an application for gaining access to EPIC data and/or biospecimens, please follow the instructions at http://epic.iarc.fr/access/index.php.