Abstract
An optical approach to determine the hydration level in human skin is presented. The approach is based on temporal tracking of back-reflected secondary speckle patterns generated while illuminating the tested area with a laser and applying periodic vibrations to the surface via a controlled vibration source (CVS). This approach has already been tested successfully for other biomedical parameters such as sensing vital signs, hematology and hemodynamic processes in the body. In this paper we examine and adjust this optical technique with the aim of measuring human skin moisture. We compare the suitability and accuracy of our optical method to the commercially available device for skin moisture measurements, the Corneometer CM 825 (by Courage + Khazaka, Cologne, Germany). Preliminary experiments showing the method's suitability for hydration measurements are presented, may lead to more accurate results that may upgrade the control of the cosmetic industry as well as identifying symptoms of moisture-related skin diseases.
1. Introduction
Hydration measurement of human skin is one of the basic measurements in bio-medical and cosmetic applications, giving us an important information about the biophysical state of our skin [1]. The skin is the largest consumer of water in our body - it contains more than 20% of the water in the body [2]. This makes the skin particularly sensitive to lack of fluids. Anatomically, the skin is a multilayered structure composed of an upper avascular cellular layer called epidermis, intimately connected to the dermis and an underlying fatty layer, the subcutis [3]. This multilayered structure also contains blood vessels, sensory receptors, hair follicles etc. The epidermis consists of skin cells that are bonded to each other by the help of inter-cellular material consisting of NMF`s - natural moisturizers. These are molecules such as - sugars, salts, amino acids - that hold water. They are hygroscopic - able to absorb water from deeper layers. When there is a decrease in NMF`s, the skin turns rough (up to wrinkles formation) [4].
The outmost layer of the skin is the stratum corneum (SC) which contains mainly corneocytes embedded in lamellar epidermal lipids, and acts as an efficient barrier against massive water loss [5]. Still, water can pass through this layer by diffusion and actually about 350 milliliters of water flow out of the body each day [6]. As we know, the epidermis and dermis, are highly hydrated, while the SC is exposed to the dry surrounding atmosphere which creates this water concentration [2]. The longer the SC layer is damaged, the lower the efficiency of the inter-cellular material, and the more damaged the ability to rehabilitate and recuperate the skin. A lack of water in the SC is reflected in the appearance and in the elasticity of the skin. Studies investigated the friction of human skin found it dependent on the moisture content in the SC and on the amount of water in the interface between skin and a contacting surface [7,8]. Regarding to the effect of skin surface roughness, it was found that the lower the density, the higher the friction [9]. It was also found that the density corresponds to the skin elastic modulus [9]. As we know, moisture commonly increases the friction at the skin surface. In fact, a study found a highly positive linear correlation between skin moisture and friction coefficients, especially in the volar forearm skin [10]. In this context, the effect of moisturizers on this relationship has been investigated. Moisturizers and other cosmetic products, contain ingredients found in the interstellar material to help maintain moisture and stabilize the interstellar complex, as long as possible. In most moisturizers we will see all the following components, similar to NMF`s: amino acids, ceramides, hyaluronic acid, cholesterol, lipid acids, triglycerides, phospholipids, glycosingolipids, urea, linoleic acid, glycosaminoglycans, glycerin, mocopolysaccharides and sodium PCA (pyrrolidone carboxylic acid) [11].
The ability to determine the hydration level of human skin is important for many applications, such as detection of skin diseases and even for cosmetic companies that want to prove their product efficacy. Various attempts for measuring the amount of moisture in human skin have been conducted, including techniques such as confocal Raman microspectroscopy [12], Raman spectroscopy [13,14], optical coherence tomography [15], nuclear magnetic resonance spectroscopy [16], transient thermal transfer [16], and also near infrared imaging [17,18]. However, these techniques are not easily available except in special laboratories and some of them are also very expensive. The methods commercially available today are based on electrical measurements, which measure either the capacitance or the conductance of the superficial skin layers [19–23]. A well-known such an instrument for determining the hydration level of the SC is the Corneometer CM 825 (Courage + Khazaka, Cologne, Germany), based on capacitance measurement by a probe that contacts the skin and measures depth of 10-20 μm corresponding to the first layers of the SC [19]. The measurements of the Corneometer are relative, meaning that we can only conclude about skin moisture status when compared to a dry area acting as the control. However, a study determined that the Corneometer is less sensitive at very hydrated skin conditions and only sensitive for dry skin conditions [19]. Another study claimed that all methods including probes that contact the skin, the measurement depth is dependent on the geometrical factors of the probe [24]. Moisture values are also affected by the degree of pressure with the probe on the skin, so it is important that all the measurements will be performed by the same person and the same pressure at each measurement.
In this paper we suggest a new optical technique for measuring volumetric skin moisture. In general, the approach is based on temporal tracking of back-reflected secondary speckle patterns generated while illuminating the skin area with a laser and applying periodic vibrations to the surface via a controlled vibration source (CVS). The tissue’s vibrations act differently depending on the amount of moisture it contains. The same technique has already been tested successfully for other biomedical parameters such as for measuring blood pressure, heart rate and sound, blood glucose concentration, alcohol concentration, intraocular pressure, detection of pigmented lesions, middle ear effusion detection and more [25–27]. Some of parameters were even obtained simultaneously. While we keep all the other parameters constant and change only the moisture level using a base moisturizer, we can observe the differences in the parameters obtained.
Previous studies connect the propagation amplitude of an acoustic wave in a tissue, with the amplitude of the laser speckle shift [28]. Since the behavior of an acoustic wave in biological tissue can provide us information about the mechanical characteristics of the tissue (such as the hydration level), we now can combine our proven analysis technique with the physical meaning of acoustic wave propagation to distinguish between wet and dry tissue.
This innovative method of measuring skin moisture, may even progress to distinguish between different amounts of moisture. The results may offer a new way to scientifically compare between various cosmetic products or even evolve to identify skin pathologies.
2. Theoretical explanation
2.1 Analysis of speckle patterns
The random self-interference pattern known as speckle [29], allows us to track changes in the phase of the light being scattered from a rough surface, while being illuminating and vibrating [27]. By tracking the position of the time-varying correlation peak, it is possible to extract the movement trajectory. In this way, nano-metric temporal shifts and movements of an object can be measured [30]. We can relate the shift of the speckle pattern to the following ratio in Eq. (1):
| (1) |
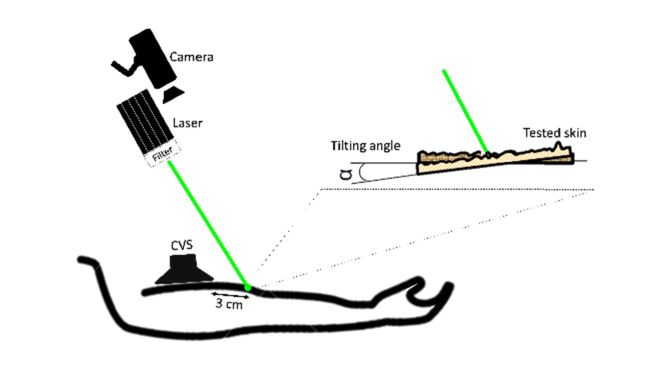
When α is the tilting angle of the illuminated surface as shown in Fig. 1. and λ is the optical wavelength, β is proportional to the change in speckle movements, resulting from the change in the physical properties of the tissue being tested. The temporal β signal is very informative and different biomedical related factors have different effects on its shape.
Fig. 1.
Experimental setup scheme.
Using correlation analyses [25], we extract the relative shift of the speckle patterns of two consecutive frames. This shift is linearly proportional to the tilt of the object, i.e., in our case the tangent of the angle between the skin’s surface and the laser projection. In the final stage, all relative movements are cumulatively summarized to extract the total movement vector. Then, we calculate the movements of the correlation peaks on each axis. The shift in a correlation peak was defined as the pixel shift or pixel amplitude. The correlation analysis between every two consecutive frames in a video, yielded a signal in which the amplitude represents the shift in the correlation peak. After receiving time-domain signals, a Fourier transform was calculated using Eq. (2) for each signal in order to get the frequency response of the tissue being vibrated by the CVS excitation.
| (2) |
When x(j) is a temporal vector containing the changes of the correlation peak’s movements, N represents the number of frames in each experiment and X(k) is the frequency response. The amplitude of the frequency response is also proportional to the shift in the correlation peak. In fact, this was the optical parameter that was used in this paper and its behavior was compared to the behavior of the values received from the Corneometer.
2.2 The physical connection
How does the parameter obtained from our optical system relate to a measure of skin moisture at a given moment? To answer this question, this section will describe how frequency amplitude can be considered as proportional to the attenuation resulting from skin moisture status. The behavior of an acoustic wave in biological tissue has already been investigated in the literature [28,31–33]. Such a behavior can provide information about the mechanical characteristics of the tissue, so an unusual response may be identified and associated with certain pathologies. A previous study investigated the propagation and attenuation of low-frequency waves in human skin over a frequency range from nearly zero to 1 kHz, showed a connection between the damping length coefficient and the tissue condition, whether it is dry or wet by water [31]. By using Eq. (3), they measured the damping length vs distance at each frequency, in dry and wet back hand of human subjects.
| (3) |
While A is the amplitude at distance d, is the initial amplitude, D is the damping length. At low frequencies, up to a few hundred Hertz, both skin conditions showed an exponential decay in the amplitude propagation along distance. The interesting finding was that the damping length of wet tissue was lower than the damping length of dry tissue (also the velocity propagation of the acoustic wave showed the same determination). Another study, examined the propagation of low frequency surface wave (1Hz) in relation to the viscoelastic behavior of an ex-vivo porcine tissue [28]. The amplitude of the acoustic wave, as measured by tracking the acoustic stress wave-induced shift in a backscattered laser speckle pattern, decreases exponentially with lateral distance from the acoustic source. As a matter of fact, the amplitude of the propagation wave was measured by the amplitude of the laser speckle shift. This means that when examining the damping length coefficients, differences in the amplitudes of the speckle shifts can be seen as the differences in the damping length coefficients themselves, but of course inversely - the greater the damping length, the smaller the attenuation. The same study also indicated that at frequencies below a few hundred hertz, the waves provide information from the surface layer (SC) and at higher frequencies, information from the deeper layer (the dermis) is provided. This determination reinforces the relevance of low frequencies to measurements of the SC moisture content.
3. Instrumentation
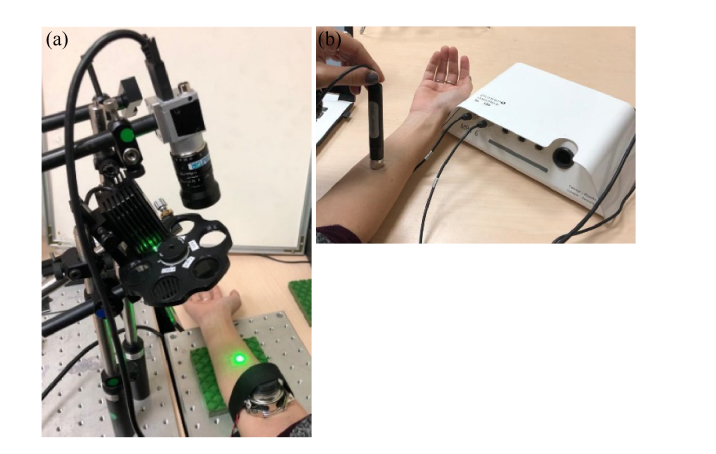
In this study, measurements were performed simultaneously with both instruments, our optical system and the Corneometer CM 825 (Courage + Khazaka, Cologne, Germany), as shown in Fig. 2. The Corneometer, based on capacitance measurement by a probe that contacts the skin and measures depth of 10-20 μm corresponding to the first layers of the SC [19].
Fig. 2.
The two experimental instruments: (a) Our optical setup, extracting the optical parameter. (b) The Corneometer CM 825 probe (by Courage + Khazaka, Germany) measuring capacitance.
By using our optical system, the skin was illuminated by a green laser (532 nm) and maximum output power of 50mW, through a filter which transfers 30% of the power in order to prevent saturated images. Since the depth of the SC layer is about 0.1 mm, and since the penetration depth of that wavelength is enough to detect the SC only and not penetrate the whole epidermis, this wavelength is appropriate [28]. A CMOS detector (Basler A312f) was directed to an illuminated marked area over a human volar forearm and took short videos with Pylon software. A defocused 75 mm lens was attached to the detector in order to receive the secondary speckles pattern interpretation of the tested skin. In each video, 3000 frames were captured in 3 seconds, giving 1000 fps (Nyquist principle was maintained) while each frame was 128 by 128 pixels. The vibrations were manual generated by waveform generator connected to a loudspeaker used as our CVS, which was positioned at approximately 3 cm away from the illuminated area. It should be noted that an acoustic wave in the skin can also be created by a remote loudspeaker that does not touch the skin. However, in these experiments we chose to use a small speaker that vibrates the skin directly in order to first prove the concept of obtaining an assessment of skin moisture by the speckle-based sensing technology. Using the MATLAB analysis described above, the amplitude of the frequency was the optical parameter for the comparison against the capacitance parameter tested by the Corneometer. The current set-up has proved itself in stability tests.
Note that, as the speckle pattern is known as a volume phenomenon, the camera receives information from the entire volume of the examined area. Part of this volume is the upper layer of the skin (SC) and the rest are deeper layers. However, the intensity of the beam's penetration decreases with depth, so the contribution of deeper layers is much smaller. Moreover, if the speckle patterns come from an area close to the center of the illumination point, then the information we get is from a smaller penetration depth in the skin since it is associated with less-scattered light. This is in contrast to speckle patterns that origin far from the center of the illumination point, bringing undesired information from deeper layers of the examined area. Therefore, in our experiments the speckle patterns were taken from a region close to the center of the illumination point.
4. Measurements and results
4.1 Measurements along time
An experiment of 3 hours was first conducted in order to notice changes in the optical signature obtained from dry human skin in contrast to moist human skin. The volar forearm was chosen as the tested site, assuming that this skin area has a homogeneous hydration state. A reference value was first taken from the area, approximately 2(height) X 2(width) .
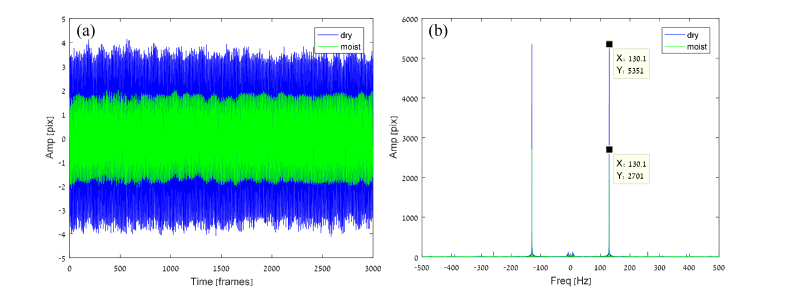
Then, an amount of 0.30 mL of AQUEOUS CREAM moisturizer was glove-rubbed into the area, until completely absorbed. The CVS was located at approximately 3 cm away from the illuminated area. The experiment lasted 3 hours when a measurement was taken every half hour in order to notice changes in moisture along time. The same measurements were conducted for 6 different acoustic low frequencies (100,130,160,190,210,250 Hz) in order to find the optical signature. Figure 3 shows an example of a time domain signal and a frequency response for 130Hz measurement taken before applying a moisturizer on human skin at the volar forearm (blue) and after applying moisturizer to the same area (green) while waiting half an hour for the moisture to be completely absorbed in the skin. Note that the only parameter that has changed is the moisture condition and all other conditions were the same, so the distinction can be clearly seen.
Fig. 3.
(a) an example for the signals extracted from our optical system. The correlation analysis between every two consecutive frames in a video, yielded this signal in which the amplitude represents the shifts in the correlation peak. Volar Forearm human skin without any treatment (blue) and half an hour after moisturizer application (green). (b) Frequency responses, same color meaning as in (a). The excitation frequency in this measurement is 130 Hz.
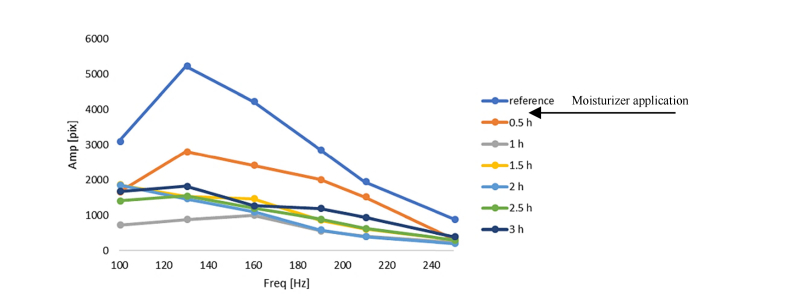
Figure 4. shows the optical signatures obtained from each measurement along the 3 hours experiment, the speckle shift as it was seen at frequency domain- our optical parameter, as a function of the 6 tested frequencies. The change can be observed as a result of the moisturizer application and also a continuous change can be observed over time. It can be seen that after the moisturizer application, the signature has decreased significantly from the signature of dry skin, continued to decrease as time passed and after a certain period of time, we can notice an increase in the signature.
Fig. 4.
Optical signature through 3 hours of experiment on one subject. After measuring the dry skin, a moisturizer was applied and completely rubbed into the skin, then 6 measurements were taken every 0.5 hour. One can see the potential of measuring the amount of moisture through this measurement, as the optical signature decreasing through time and even going back up after 3 hours when the Corneometer indicates a decrease skin moisture.
The same finding, that the optical signature of moist skin differs from the optical signature of dry skin, was also repeated in a similar experiment in which three healthy volunteers, varying from 27 to 29 years of age, were measured with the same optical set-up. Between the subjects, all conditions were the same (lighting, weather, hour of day, humidity and room temperature).
This time, the reference value was taken from the left volar forearm, and the moisture value was taken from the right volar forearm, after it was applied with moisturizer.
On each of the subjects five independent measurements were performed from both their forearms. This experiment does not examine the difference over time, but the difference between optical signature of moist and dry skin. This can be clearly seen in three different people, as shown in Fig. 5.
Fig. 5.
Optical signatures of three different subjects (a-c), dry skin (blue) from the left forearm against moist skin (orange) from the right forearm after moisturizer application. The amplitude speckle shift in frequency domain is the optical parameter, as a function of the 6 frequencies examined. Five independent measurements were taken from the three subjects, each time from both forearms. Here is presented the average accepted values, with standard deviations of the five repetitions.
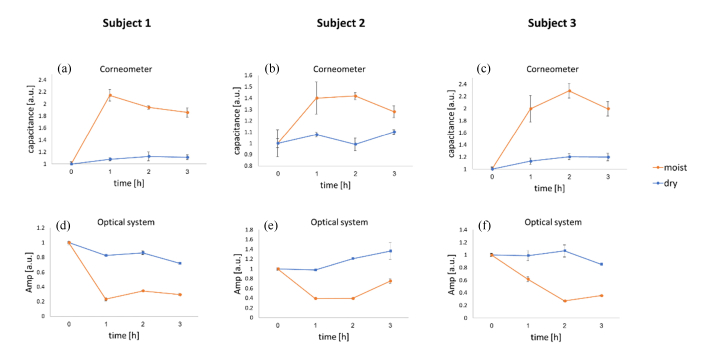
From the optical signature of each participant, we selected the frequency at which the greatest gap and the smallest standard deviation between wet and dry skin signatures. Using the chosen frequency, we performed a 3-hour experiment in which we measured the skin of the same three volunteers. This time in only 4 discrete time points, every hour, using both instruments- our optical system and the Corneometer. For each person, three repeated capacitance and optical measurements were conducted before moisturizer application. The same measurements were conducted 1,2 and 3 hours after moisturizer application, in order to examine the changes in moisture values over time. The chosen frequencies were 160Hz, 130Hz and 190Hz for subject 1,2 and 3 respectively. For each participant the moisturizer was applied to the right volar forearm right after the first measurement. The left volar forearm of each participant served as a reference. In Fig. 6 one can see that both instruments responded to moisturizer application in the same way, but with the opposite trend.
Fig. 6.
Three subjects whose skin was examined over the period of 3 hours by the two instruments, the Corneometer (a-c) and our optical system (d-f). Sections (a, d) belong to subject 1, sections (b, e) belong to subject 2 and sections (c, f) belong to subject 3. Each experiment was performed under the same humidity and room temperature conditions. For each participant the moisturizer was applied to the right volar forearm (orange) immediately after the first measurement. The left volar forearm (blue) of each participant served as a reference. One can see that both instruments responded to moisturizer application in the same way, but opposite. High moisture is interpreted in the Corneometer as an increase in the graph, and in our analysis, it is interpreted as a decrease in the graph. In both instruments, the values were normalized by the value from the first measurement. In each time point, the measurement was performed in 3 repetitions and the median and standard deviation were taken.
High moisture is interpreted in the Corneometer as an increase in the graph, and in our analysis, it is interpreted as a decrease in the graph. In both instruments, the values were normalized by the value from the first measurement. In each time point, the measurement was performed in 3 repetitions and the average and standard deviation were taken.
In order to compare between the ability of the two instruments to distinguish between dry and moist skin over time, we calculate the Pearson correlation coefficient, and also, we were using t-test on the correlation coefficients for paired samples. Measurements from each instrument for each subject were normalized by the standard score formula for the purpose of facile comparison between different units of measurement. Significant high negative correlations were obtained between the Corneometer and our optic system values while calculate the Pearson correlation coefficients for each person separately (R = −0.75 p = 0.02, R = −0.91 p = 0.0013, R = −0.95 p<0.001, for subjects 1,2 and 3 respectively).
Significant high negative correlation was also obtained while calculate the Pearson correlation coefficient for all subjects together from both instruments (R = −0.87 p<0.001). It is clearly seen that the two instruments are opposite in their interpretation of increasing in the hydration level - in the Corneometer it is interpreted as an increase in the graph while in the optical system it is interpreted as a decrease in the graph. As the gap increased between dry and moist values in the Corneometer along time, so did the gap between dry and moist values in our optical system.
While calculating the gaps, the correlation coefficients are: R = −0.42, R = −0.83, R = −0.93, for subjects 1,2 and 3 respectively. In another comparison, we calculated the ratio between the values obtained from the right arm (moist) and the values obtained from the left arm (dry). A correlation between these relations obtained from the Corneometer and the optical system was calculated for each subject. Significant high negative correlation was obtained (R = −0.98, R = −0.94, R = −0.91 for subjects 1,2,3 respectively).
4.2 Measurements of damping length
After observing the differences between the amplitude of the laser speckle shifts of wet skin and dry skin with our optical setup, this section focuses on distinguishing between different amounts of moisture. For this purpose, the damping length coefficient (D) was extracted from Eq. (3) as the parameter that corresponds to the amount of moisture in the skin at the moment. As was mentioned above, wet skin has a lower D, so the higher the amount of the moisturizer, the lower the D is.
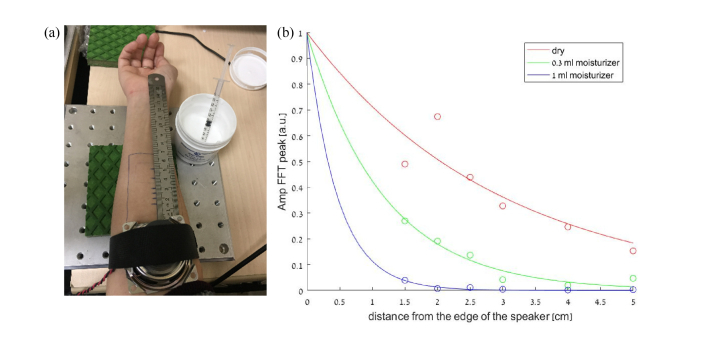
The following experiment was performed: while using the same experimental setup we measured 6 points along distance over the volar forearm, at distances of 1.5cm, 2cm, 2.5cm, 3cm, 4cm, and 5cm from the edge of the CVS, which its output was 190Hz frequency, as shown in Fig. 7(a).
Fig. 7.
(a) The 6 points along distance over the volar forearm, at distances of 1.5cm, 2cm, 2.5cm, 3cm, 4cm, and 5cm from the edge of the CVS. (b) Fit curves for each skin condition show that the greater the moisture content is, the faster the acoustic wave fades along the skin.
The same process was performed for three different skin conditions - first without moisturizer, second with 0.3 mL of moisturizer (same type mentioned above), and third with 1 mL of moisturizer. This experiment was performed five times separately, so that all five repetitions are independent of each other.
The same optical parameter was taken, the amplitude in frequency domain which is proportional to the amplitude of the laser speckle shifts. Note that the amplitudes vector along the distance was normalized by division by the maximum amplitude. A mean of all five measurements was performed for each skin condition, and a fit curve was adjusted for each skin condition, as seen in Fig. 7(b).
One can see from Table 1. the values of the damping length coefficients (D) and R-square, which were taken from MATLAB curve fitting tool. It can be clearly seen that the higher the moisture level in the skin, the lower the D of the acoustic wave propagation in the skin is, and the wave fades faster. In all skin conditions the fit curve showed a high match (each R-square was greater than 0.7).
Table 1. Damping length and R-square of curves fitting.
| Treatment | D (cm) | R-square |
|---|---|---|
| Dry | 3.03 | 0.75 |
| 0.3 ml | 1.17 | 0.93 |
| 1 ml | 0.47 | 0.89 |
5. Conclusion
In this paper the use of a simple optical remote configuration for the estimation of human skin hydration level was presented. All statistical tests we performed showed that our optical system identifies different moisture conditions as identified by the Corneometer. In contrast to the Corneometer, our optical system presents a large range of hydration readings with a very good sensitivity for studying high levels of hydration. The main finding from our experiments is that dry skin receives low values in the Corneometer but high values in the optical system. Same for moist skin, which receives high values in the Corneometer but low values in the optical system. When the Pearson correlation coefficient was calculated, this behavior has been confirmed by a high negative correlation between the trends of the two instruments. we can conclude that for each subject, the optical system can distinguish between moist and dry skin, similar to the Corneometer. In addition, we presented primary measurements for diagnosing different amounts of moisture in the skin, while looking at the damping length parameter of an acoustic wave along the tissue.
In conclusion, our results can be the basis for a new non-contact method of measuring human skin moisture. Our results show that the greater the moisture content is, the faster the acoustic wave fades along the skin. Further experiments should be done on a wider sample of people, and examining a larger range of amounts of moisturizer. Until then, this paper shows the potential in our optical system for measuring hydration levels in human skin which can be used in the cosmetic industry as well as for early detection of various skin pathologies.
Acknowledgements
The author thanks Dr. Guy Cohen and Oren Raz from the Skin Research Institute, Dead-Sea & Arava Science Center, Israel, for lending their Corneometer CM 825.
Disclosures
The authors declare no conflict of interest.
References
- 1.Potts R. O., Buras E. M., Jr., Chrisman D. A., Jr., “Changes with age in the moisture content of human skin,” J. Invest. Dermatol. 82(1), 97–100 (1984). 10.1111/1523-1747.ep12259203 [DOI] [PubMed] [Google Scholar]
- 2.Verdier-Sévrain S., Bonté F., “Skin hydration: a review on its molecular mechanisms,” J. Cosmet. Dermatol. 6(2), 75–82 (2007). 10.1111/j.1473-2165.2007.00300.x [DOI] [PubMed] [Google Scholar]
- 3.Silver F. H., Siperko L. M., Seehra G. P., “Mechanobiology of force transduction in dermal tissue,” Skin Res. Technol. 9(1), 3–23 (2003). 10.1034/j.1600-0846.2003.00358.x [DOI] [PubMed] [Google Scholar]
- 4.Björklund S., Andersson J. M., Pham Q. D., Nowacka A., Topgaard D., Sparr E., “Stratum corneum molecular mobility in the presence of natural moisturizers,” Soft Matter 10(25), 4535–4546 (2014). 10.1039/C4SM00137K [DOI] [PubMed] [Google Scholar]
- 5.Elias P. M., “Epidermal lipids, barrier function, and desquamation,” J. Invest. Dermatol. 80(6), 044s–049s (1983). 10.1038/jid.1983.12 [DOI] [PubMed] [Google Scholar]
- 6.Blank I. H., “Factors Which Influence the Water Content of the Stratum Corneum,” J. Invest. Dermatol. 18(6), 433–440 (1952). 10.1038/jid.1952.52 [DOI] [PubMed] [Google Scholar]
- 7. Johnson S. A., Gorman D. M., Adams M. J., Briscoe B. J., “The friction and lubrication of human stratum corneum,” Thin Films in Tribology, Dowson D., ed., 25, (Elsevier, 1993) pp. 663–672. [Google Scholar]
- 8.Nacht S., Close J.-A., Yeung D., Gans E. H., “Skin friction coefficient: changes induced by skin hydration and emollient application and correlation with perceived skin feel,” J. Soc. Cosmet. Chem. 32(2), 55–65 (1981). [Google Scholar]
- 9.Nakajima K., Narasaka H., “Evaluation of skin surface associated with morphology and coefficient of friction,” Int. J. Cosmet. Sci. 15(4), 135–151 (1993). 10.1111/j.1468-2494.1993.tb00594.x [DOI] [Google Scholar]
- 10.Gerhardt L.-C., Strässle V., Lenz A., Spencer N. D., Derler S., “Influence of epidermal hydration on the friction of human skin against textiles,” J. R. Soc. Interface 5(28), 1317–1328 (2008). 10.1098/rsif.2008.0034 [DOI] [PMC free article] [PubMed] [Google Scholar]
- 11.Rieger M. M., Deem D. E., “Skin moisturizers. The effects of cosmetic Ingredients on human stratum corneum,” J. Soc. Cosmet. Chem. 25, 253–262 (1974). [Google Scholar]
- 12. Caspers P. J., In vivo skin characterization by confocal Raman microspectroscopy thesis (2003).
- 13.Egawa M., Tagami H., “Comparison of the depth profiles of water and water-binding substances in the stratum corneum determined in vivo by Raman spectroscopy between the cheek and volar forearm skin: effects of age, seasonal changes and artificial forced hydration,” Br. J. Dermatol. 158(2), 251–260 (2008). 10.1111/j.1365-2133.2007.08311.x [DOI] [PubMed] [Google Scholar]
- 14.Crowther J. M., Sieg A., Blenkiron P., Marcott C., Matts P. J., Kaczvinsky J. R., Rawlings A. V., “Measuring the effects of topical moisturizers on changes in stratum corneum thickness, water gradients and hydration in vivo,” Br. J. Dermatol. 159(3), 567–577 (2008). [DOI] [PubMed] [Google Scholar]
- 15.Sand M., Gambichler T., Moussa G., Bechara F. G., Sand D., Altmeyer P., Hoffmann K., “Evaluation of the epidermal refractive index measured by optical coherence tomography,” Skin Res. Technol. 12(2), 114–118 (2006). 10.1111/j.0909-752X.2006.00144.x [DOI] [PubMed] [Google Scholar]
- 16.Girard P., Beraud A., Sirvent A., “Study of three complementary techniques for measuring cutaneous hydration in vivo in human subjects: NMR spectroscopy, transient thermal transfer and corneometry - application to xerotic skin and cosmetics,” Skin Res. Technol. 6(4), 205–213 (2000). 10.1034/j.1600-0846.2000.006004205.x [DOI] [PubMed] [Google Scholar]
- 17.Arimoto H., Egawa M., “Non-Contact Skin Moisture Measurement Based on Near-Infrared Spectroscopy,” Appl. Spectrosc. 58(12), 1439–1446 (2004). 10.1366/0003702042641218 [DOI] [PubMed] [Google Scholar]
- 18.Zhang S. L., Meyers C. L., Subramanyan K., Hancewicz T. M., “Near infrared imaging for measuring and visualizing skin hydration. A comparison with visual assessment and electrical methods,” J. Biomed. Opt. 10(3), 031107 (2005). 10.1117/1.1922347 [DOI] [PubMed] [Google Scholar]
- 19.Clarys P., Clijsen R., Taeymans J., Barel A. O., “Hydration measurements of the stratum corneum: comparison between the capacitance method (digital version of the Corneometer CM 825) and the impedance method (Skicon-200EX®),” Skin Res. Technol. 18(3), 316–323 (2012). 10.1111/j.1600-0846.2011.00573.x [DOI] [PubMed] [Google Scholar]
- 20.Rim J. H., Jo S. J., Park J. Y., Park B. D., Youn J. I., “Electrical measurement of moisturizing effect on skin hydration and barrier function in psoriasis patients,” Clin. Exp. Dermatol. 30(4), 409–413 (2005). 10.1111/j.1365-2230.2005.01773.x [DOI] [PubMed] [Google Scholar]
- 21.Barel A. O., Clarys P., “In vitro calibration of the capacitance method (Corneometer CM 825) and conductance method (Skicon-200) for the evaluation of the hydration state of the skin,” Skin Res. Technol. 3(2), 107–113 (1997). 10.1111/j.1600-0846.1997.tb00171.x [DOI] [PubMed] [Google Scholar]
- 22.Leite e Silva V. R., Schulman M. A., Ferelli C., Gimenis J. M., Ruas G. W., Baby A. R., Velasco M. V., Taqueda M. E., Kaneko T. M., “Hydrating effects of moisturizer active compounds incorporated into hydrogels: in vivo assessment and comparison between devices,” J. Cosmet. Dermatol. 8(1), 32–39 (2009). 10.1111/j.1473-2165.2009.00421.x [DOI] [PubMed] [Google Scholar]
- 23. LaVoie K. A., “Comparison of the Effectiveness of Five Different Skin Protective Products,” 3M Health Care center, p. 6. [Google Scholar]
- 24.Alanen E., Nuutinen J., Nicklén K., Lahtinen T., Mönkkönen J., “Measurement of hydration in the stratum corneum with the MoistureMeter and comparison with the Corneometer,” Skin Res. Technol. 10(1), 32–37 (2004). 10.1111/j.1600-0846.2004.00050.x [DOI] [PubMed] [Google Scholar]
- 25.Ozana N., Margalith I., Beiderman Y., Kunin M., Abebe Campino G., Gerasi R., Garcia J., Mico V., Zalevsky Z., “Demonstration of a Remote Optical Measurement Configuration That Correlates With Breathing, Heart Rate, Pulse Pressure, Blood Coagulation, & Blood Oxygenation,” Proc. IEEE 103(2), 248–262 (2015). 10.1109/JPROC.2014.2385793 [DOI] [Google Scholar]
- 26.Shenhav A., Brodie Z., Beiderman Y., Garcia J., Mico V., Zalevsky Z., “Optical sensor for remote estimation of alcohol concentration in blood stream,” Opt. Commun. 289, 149–157 (2013). 10.1016/j.optcom.2012.09.079 [DOI] [Google Scholar]
- 27.Bishitz Y., Ozana N., Schwarz A., Beiderman Y., Garcia J., Zalevsky Z., “Optical configuration of pigmented lesion detection by frequency analysis of skin speckle patterns,” Biomed. Opt. Express 7(3), 1003–1014 (2016). 10.1364/BOE.7.001003 [DOI] [PMC free article] [PubMed] [Google Scholar]
- 28.Kirkpatrick S. J., Duncan D. D., Fang L., “Low-frequency surface wave propagation and the viscoelastic behavior of porcine skin,” J. Biomed. Opt. 9(6), 1311–1319 (2004). 10.1117/1.1803843 [DOI] [PubMed] [Google Scholar]
- 29.Goodman J. W., “Some fundamental properties of speckle,” J. Opt. Soc. Am. 66(11), 1145 (1976). 10.1364/JOSA.66.001145 [DOI] [Google Scholar]
- 30. Zalevsky Z. , Garcia J., “Motion detection system and method,” US8638991B2, (2014).
- 31.Potts R. O., Chrisman D. A., Jr., Buras E. M., Jr., “The dynamic mechanical properties of human skin in vivo,” J. Biomech. 16(6), 365–372 (1983). 10.1016/0021-9290(83)90070-2 [DOI] [PubMed] [Google Scholar]
- 32.Kirkpatrick S. J., Wang R. K., Duncan D. D., Kulesz-Martin M., Lee K., “Imaging the mechanical stiffness of skin lesions by in vivo acousto-optical elastography,” Opt. Express 14(21), 9770–9779 (2006). 10.1364/OE.14.009770 [DOI] [PubMed] [Google Scholar]
- 33.Moore T., “A Survey of the Mechanical Characteristics of Skin and Tissue in Response to Vibratory Stimulation,” IEEE Trans. Man Mach. Syst. 11(1), 79–84 (1970). 10.1109/TMMS.1970.299966 [DOI] [Google Scholar]


