Abstract
Diffuse correlation spectroscopy (DCS) is a noninvasive optical technique for monitoring cerebral blood flow (CBF). This work presents a stand-alone DCS system capable of monitoring absolute CBF by incorporating a quantitative dynamic contrast-enhanced (DCE) technique. Multi-distance data were acquired to measure the tissue optical properties and to perform DCE experiments. Feasibility of the technique was assessed in piglets in which the optical properties were measured independently by time-resolved near-infrared spectroscopy. A strong linear correlation was observed between CBF values derived using the two sets of optical properties, demonstrating that this hybrid DCS approach can provide real-time monitoring of absolute CBF.
1. Introduction
Diffuse correlation spectroscopy (DCS) is an emerging optical technique for monitoring tissue perfusion [1,2]. As it shares the same advantages of near-infrared spectroscopy (NIRS) in terms of safety and portability, DCS is an attractive technology for neuromonitoring in the neonatal intensive care unit. It has been used in combination with tissue oxygenation measurements from NIRS to study blood flow and oxidative metabolism in the developing brain and the potential effects of various treatments, such as therapeutic hypothermia [3–8]. DCS is most commonly used to monitor relative changes in CBF; however, in principle, a quantitative blood flow index (BFi) can be obtained, provided the tissue optical properties – absorption (μa) and reduced scattering (μs′) coefficients – are measured. Quantification provides the ability to monitor longitudinal changes in CBF and potentially establish thresholds related to major forms of neonatal brain injury, including intraventricular hemorrhage [9].
Although absolute BFi was shown to strongly correlate with CBF in newborn piglets [10], BFi is not in standard units of perfusion (i.e., ml of blood / volume of tissue / min), but in units of displacements squared per unit time since blood flow is modeled as a diffusion-like process. Furthermore, simulations predict that the relationship between BFi and perfusion is sensitive to vessel geometry [11]. These results suggest that in clinical studies it may be useful to be able to measure CBF directly in order to confirm the relationship between BFi and CBF thresholds and for comparison to data acquired with other perfusion techniques, such as arterial spin labeling, which is increasingly used in magnetic resonance imaging studies of the newborn brain [12]. One approach is to conduct calibration studies for a given patient population in order to establish a relationship between BFi and CBF [13,14]. However, quantifying BFi requires accurate measurements of the tissue optical properties and the assumption of a consistent flow/BFi relationship across participants [10]. Alternatively, DCS can be combined with a quantitative perfusion method, such as dynamic contrast-enhanced (DCE) NIRS, which uses the optical contrast agent indocyanine green (ICG) as a blood flow tracer [15]. ICG has a low toxicity – the most common side effect is an allergic reaction – and has been used in a number of studies involving preterm infants [8]. With this approach, a measurement of CBF by DCE NIRS is used to convert continuous BFi recordings into perfusion units.
Previous studies combining DCS and DCE NIRS required a separate NIRS system to capture the time-varying absorption changes, Δμa(t), caused by the flush of ICG through the cerebral microvasculature [8,10,14]. CBF quantification requires a NIRS technique capable of quantifying μa(t), which was previously performed by either derivative spectroscopy applied to broadband data or by time-resolved (TR) detection [16]. Regardless of the approach, the need to combine DCS with NIRS adds complexity to the overall system and increases cost. It would be advantageous to have a stand-alone DCS system capable of quantifying absolute CBF. Such a device would enable CBF to be determined in clinical applications when BFi recordings indicate impaired blood flow, help establish BFi ischemic thresholds, and perform calibration experiments.
This study outlines the development and validation of a DCS system designed to perform both continuous BFi monitoring and CBF quantification in infants. The key modification was to replace a conventional hardware correlator with an in-house-developed multi-channel software version based on the design outlined by Wang et al. [17]. In addition to generating normalized intensity autocorrelation curves, the software correlator enabled intensity data to be recorded at multiple source-detector distances. These were used for DCE analysis by recording intensity changes following a bolus injection of ICG and to determine baseline tissue optical properties. With this approach, the first step was to determine the effective attenuation coefficient μeff, from multi-distance (MD) intensity measurements based on spatially resolved NIRS methodology. Second, μs′ and BFi were determined by fitting multi-distance autocorrelation curves with μeff fixed to the value obtained in the first step. The final step was to use the estimated baseline optical properties to convert time-varying intensity changes following a bolus injection of ICG into Δμa(t), which was subsequently analyzed to determine CBF. The approach for measuring the tissue optical properties is similar to the MD/multiwavelength approach proposed by Tamborini et al. [18], except it was designed for data acquisition at the single wavelength used for CBF calibration.
The ability of the proposed MD-DCS system to measure tissue optical properties and acquire DCE data was assessed in experiments involving newborn piglets as the thickness of the extracerebral tissues (scalp and skull) is relatively small, similar to preterm newborns. Arterial carbon dioxide tension (PaCO2) was altered to vary CBF: elevated PaCO2 (i.e., hypercapnia) to increase flow, reduced PaCO2 (i.e., hypocapnia) to decrease flow. Under each capnic condition, CBF was measured by collecting MD intensity data following a bolus injection of ICG, and the optical properties were measured by MD DCS and independently by TR NIRS for comparison. In addition, the optical properties of a tissue-mimicking phantom filled with an Intralipid solution were measured by MD DCS and TR NIRS over a range of concentrations of India ink. This experiment was conducted to further assess the accuracy of the MD-DCS approach.
2. Methods
2.1. Instrumentation
The DCS system consisted of a long coherence length (>5 m) continuous-wave laser operating at 785 nm with a maximum power output of 100 mW (DL-785-100-3S, CrystaLaser, Reno, NV). The laser was coupled to a multimode fiber (NA = 0.22, core = 400 µm, 4.7 mm outer diameter; Fiberoptics Technology, Connecticut, US) which directed the light to the head. The diffusively reflected light was collected by three 2.5-m long single-mode fibers (SMF-28-J9, NA = 0.14, core = 8.2 µm, single-mode cutoff wavelength = 1260 nm, Thorlabs, New Jersey, US). Each detection fiber was wrapped into a 15-cm coil to convert higher order modes into non-propagating modes. Light from the detectors was received by a four-channel single photon counting module (SPCM-AQR-15-FC, PerkinElmer Canada Inc, Quebec, CA), which fed TTL pulses into an edge-detecting counter on a PCIe6612 counter/timer data acquisition board (National Instrument, Austin, Texas). Photon counts were recorded and processed using in-house developed software (LabVIEW, National Instrument and MATLAB). For each detector, the software recorded the total photon count and generated intensity autocorrelation curves at 40 delay times ranging from 1 to 40 µs.
The TR-NIRS system utilized a picosecond diode laser emitting at 802 nm (LDH-P-C-810, PicoQuant, Germany). The output and pulse repetition rate of the laser were set to 1.4 mW and 80 MHz, respectively, through a computer-controlled laser driver (PDL 828, PicoQuant). The light was coupled into a multimode fiber (NA = 0.22, core = 400 µm, 4.7 mm outer diameter; Fiberoptics Technology, US) and directed towards the head. Diffusively reflected light was collected by a fiber bundle (core = 3600 µm, NA = 0.55, Fiberoptics Technology, United States). The collected photons were then sent to a hybrid photomultiplier tube (PMA Hybrid 50, PicoQuant, Germany), coupled to a HydraHarp 400 (PicoQuant, Germany) time-correlated single photon counting module to generate a distribution of times of flight of photons (DTOF). The temporal dispersion caused by the system was corrected for by measuring the instrument IRF (FWHM = 0.489 ± 0.107 ns), and the system was allowed to warm up for one hour before an experiment to minimize instrument temporal drift [19].
2.2. Animal preparation
Animal experiments were conducted in accordance with the guidelines of the Canadian Council of Animal Care (CCAC) and approved by the Animal Care Committee at Western University. Newborn piglets (<10 days old) were initially anesthetized with 5% isoflurane, which was reduced to 3% for surgical procedures and maintained at 2-2.5% during the course of the experiment. Animals were tracheotomized and mechanically ventilated on a mixture of 2 liters oxygen and 2 liters medical air (21% O2, balance N2). Vital signs including heart rate (HR), end-tidal carbon dioxide tension, respiratory rate (RR), and blood pressure were continuously monitored (SurgiVet, Smith Medical, MN) via a femoral artery catheter. Arterial oxygen saturation was measured by a pulse oximeter attached to the piglet’s right front hoof. Intermittent arterial blood samples were collected via the femoral catheter for blood gas and glucose analysis (Radiometer, ABL 80 FLEX CO-OX, Denmark). An ear and a cephalic vein were catheterized for IV access, which included injecting ICG (Sigma-Aldrich, Saint Louis, MO) and infusing NaCl fluids (4 ml/kg/h). The scalp was shaved, and the head placed in a plexiglass jig to help support the optical fibers.
2.3. Experimental procedure
The DCS and TR-NIRS fibers were secured to the top of the head using a 3D-printed probe holder. The DCS fibers were positioned parasagittally at source-detector separations of 15, 20 and 25 mm. The TR-NIRS fibers were placed at a single distance of 30 mm, parallel to the DCS fibers to ensure the two systems interrogated similar brain regions. To prevent cross-talk, measurements were acquired sequentially with shutters placed in front of the two lasers and the TR detector. DCS and TR-NIRS data were acquired at each of the three capnic levels, starting at baseline (i.e., normocapnia). The TR-NIRS data were collected first at a temporal resolution of 300 ms for a total acquisition time of 90 s. Intensity and correlation data were then acquired with the MD DCS system at the same temporal resolution and duration. After 10 s, a bolus of ICG was injected into the ear vein (0.1 mg/kg in 1 ml of sterile water and dextrose used in equal ratio). Data acquired prior to ICG injection were used to determine the tissue optical properties, and the DCE changes in light intensity were used to measure CBF. The concurrent time-varying arterial concentration of ICG was measured by a pulse dye densitometer attached to the right forelimb (DDG 2001, Nihon Kohden, Tokyo, JP).
After a delay of approximately 15 min to allow ICG to clear from the circulation, arterial CO2 was altered to induce either hypercapnia or hypocapnia, the order was randomized between experiments. Hypercapnia was induced by having the piglet inhale 5.25% CO2 (0.5 liter O2 and 3.5 liters CO2), while hypocapnia was induced through hyperventilation. DCS data were continuously recorded during the transition period between capnic levels to track dynamic flow changes. The protocol consisted of acquiring data at a resolution of 300 ms for 5 minutes prior to CO2 manipulation and for 15 minutes following (Fig. 1). At each new capnic level, PaCO2 was measured and the ICG protocol performed to measure CBF once PaCO2 was deemed stable. The ventilation was then adjusted to return PaCO2 to normocapnia before transitioning to the remaining capnic level and repeating the measurements.
Fig. 1.
Schematic of the experimental protocol. PaCO2 change refers to either hypo or hyper-capnia. Order was randomized across experiments.
2.4. Data analysis
2.4.1. Tissue optical properties
Based on the principles of spatially resolved NIRS, μeff was determined from the slope of the natural log of intensity, I(rsd), versus source-detector distance, rsd:
| (1) |
where,
| (2) |
and μa is the absorption coefficient of the tissue.
The next step was to determine µs′ and BFi from the normalized intensity autocorrelation data collected at each of the three source-detector distances prior to ICG injection. Each data set was converted to the corresponding electric field autocorrelation function, G1, using the Siegert relation. The coherence factor, β, was fixed to the theoretical value based on the number of guided modes of the detection fiber. The solution to the correlation diffusion equation for a semi-infinite homogeneous medium was fit to the G1 data from the three source-detector distances, assuming Brownian motion of scatterers:
| (3) |
Where ; is the wavenumber of light (λ is wavelength and n is the refractive index), αDB is the blood flow index (BFi), τ is correlation time, , and (z0 is the effective depth of the source and zb is the extrapolated boundary [20]). The two fitting parameters were µs′ and αDB with µeff set to the value from the spatially resolved analysis. In addition, µa was derived from Eq. 2 for comparison to the estimates obtained by TR NIRS.
For the TR-NIRS measurements of μa and µs′, a DTOF was acquired over a 90-s period, which was subsequently analyzed using the solution to the diffusion approximation for a semi-infinite homogeneous medium with extrapolated boundary conditions [20]. The model solution was convolved with the measured IRF and fit to the DTOF using a non-linear optimization routine [16]. The fitting range was set to 80% of the peak value on the leading edge and 20% on the falling edge. The fitting procedure included an additional scaling factor to account for variations in laser power, detection gain and probe coupling efficiency [16].
2.4.2. Dynamic contrast-enhanced method
The time-varying concentration of ICG in the cerebral microvasculature, C(t), was related to the corresponding arterial blood concentration, Ca(t), by the following:
| (4) |
where R(t) is defined as the impulse residue function and represents the fraction of ICG in tissue at time t following an ideal unit impulse injection at time t = 0. The flow-scaled R(t) was extracted from Ca(t) and C(t) by performing a deconvolution and its initial height is equivalent to CBF, since by definition R(0) = 1 [21]. C(t) was determined from the intensity changes recorded at the largest source-detector distance (25 mm). Non-linear optimization was used to fit the steady-state solution to the diffusion approximation for a semi-infinite medium to the intensity data in order to extract Δμa(t), which was converted to C(t) using:
| (5) |
where ɛICG is the extinction coefficient of ICG at 785 nm. Estimating Δμa(t) required inputting the baseline optical properties, µeff and µs′, into the fitting routine. For comparison, C(t) was generated twice, first using µeff and µs′ estimates from MD DCS and then using the values from TR NIRS. In this analysis, ICG was assumed to only affect light absorption and µs′ was fixed to its initial value.
The CBF estimate was also used to convert DCS data recorded during the transition baseline to either hyper or hypocapnia into blood flow units (ml/100g/min):
| (6) |
where BFi(t) is the flow index at time t, BFi0 is the baseline value, and CBF0 is baseline cerebral blood flow as determined by the DCE method.
2.5. Tissue phantom experiments
A phantom (180 × 140 × 110 mm) was constructed from dark polyvinyl chloride (12 mm thick) and filled with a 0.8% Intralipid/water solution (Fresenius Kabi, Germany) to mimic the light scattering properties of tissue (µs′ ∼ 10 cm-1 [22]). Optical probes were placed in contact with the Intralipid solution at source-detector separations of 15, 20 and 25 mm for DCS and 30 mm for TR NIRS. MD-DCS and TR-NIRS data were acquired at baseline and in three successive steps in which the absorption property of the solution was incrementally increased by adding small amounts of India ink. Similar to the animal experiments, µeff, μa and µs′ were derived for each of the four conditions (i.e. baseline and 3 sets of data after adding the ink) by MD DCS and TR NIRS as described above.
2.6. Statistical analysis
Statistical analyses were conducted using SPSS 17.0 (SPSS, Chicago, USA) and statistical significance was described as p < 0.05. Linear regression analyses were conducted to investigate the correlation between estimate of optical properties from TR NIRS and MD DCS as well as the CBF values derived from the two sets of optical properties. The degree of similarity between the two sets of CBF measurements was evaluated using a Bland-Altman plot [23]. Finally, analysis of variance (ANOVA) was used to assess differences in optical properties between techniques and conditions for the animal experiments.
3. Results
3.1. Physiological parameters
Data were collected from eight piglets, with one set excluded due to poor quality of the baseline autocorrelation curves, which was attributed to poor contact of the probes on the piglet’s scalp (3 males, 4 females, mean weight = 3.0 ± 1.4 kg, mean age = 6.7 ± 2.9 days). Average values of systemic physiological parameters at the three capnic conditions are summarized in Table 1. Relative to baseline, significant differences were observed in PaCO2, PaO2, HR and pH at both hypercapnia and hypocapnia.
Table 1. Measurements of arterial partial pressure of carbon dioxide (PaCO2) and oxygen (PaO2), hemoglobin concentration (ctHb), heart rate (HR), mean arterial pressure (MAP), and pH. * p < 0.05 relative to baseline. Data presented as average ± standard deviation.
| Condition | PaCO2 (mmHg)* | PaO2 (mmHg)* | ctHb (g/dL) | HR (bpm)* | MAP (mmHg) | pH* |
|---|---|---|---|---|---|---|
| Baseline | 39 ± 2 | 230 ± 76 | 7.1 ± 1.2 | 157 ± 16 | 47 ± 2 | 7.39 ± 0.02 |
| Hypercapnia | 63 ± 5 | 120 ± 26 | 7.4 ± 1.13 | 189 ± 31 | 49 ± 4 | 7.24 ± 0.03 |
| Hypocapnia | 28 ± 2 | 284 ± 74 | 7.3 ± 1.5 | 168 ± 15 | 46 ± 3 | 7.52 ± 0.02 |
3.2. Optical properties
Average optical properties measured by MD DCS and TR NIRS under each of the three flow conditions are shown in Table 2. The µa values for MD DCS were derived from μeff and µs′ measurements using Eq. 2. Multi-variate ANOVA revealed statistical differences in µa across condition (baseline, hypercapnia and hypocapnia) and technique (MD DCS and TR NIRS). That is, µa was significantly different across the three conditions (F2,12 = 35.2, p < 0.05) and significantly different between techniques (F1,6 = 7.7, p < 0.05). In contrast, there were no statistically significant differences in µs′ between MD DCS and TR NIRS, nor across the three flow conditions.
Table 2. Optical properties from TR NIRS and MD DCS. Values are presented at baseline for μs′ and at baseline, hypercapnia and hypocapnia for μa. Data presented as average ± standard deviation.
|
µs′ (cm-1) |
µa (cm-1) |
|||||
|---|---|---|---|---|---|---|
| Technique | Baseline | Hypercapnia | Hypocapnia | Baseline | Hypercapnia | Hypocapnia |
| TR NIRS | 7.2 ± 1.6 | 7.2 ± 1.3 | 7.4 ± 1.4 | 0.11 ± 0.02 | 0.13 ± 0.02 | 0.11 ± 0.01 |
| MD DCS | 6.9 ± 1.5 | 6.4 ± 1.6 | 6.4 ± 1.3 | 0.08 ± 0.03 | 0.10 ± 0.04 | 0.08 ± 0.03 |
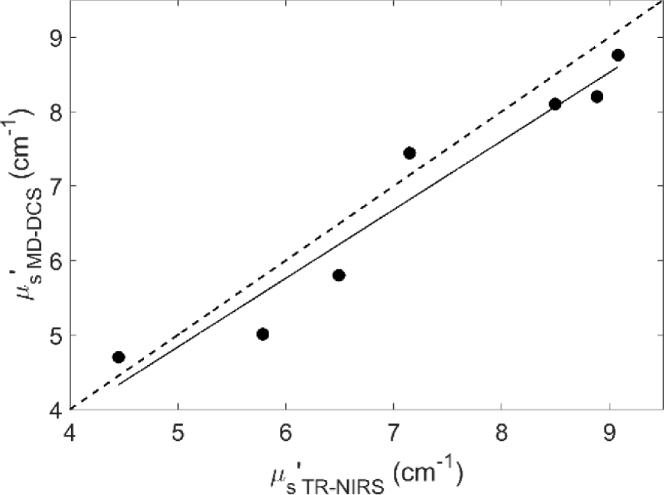
Figure 2 shows a comparison of baseline µs′ values measured by TR NIRS and MD DCS across seven animals. Regression analysis revealed a strong linear correlation (R2 = 0.94) between µs′ values from the two techniques.
Fig. 2.
Comparison of µs′ values from TR NIRS and MD DCS. Solid line is the best-fit from linear regression (slope = 0.92, intercept = 0.23 cm-1 and R2 = 0.94).
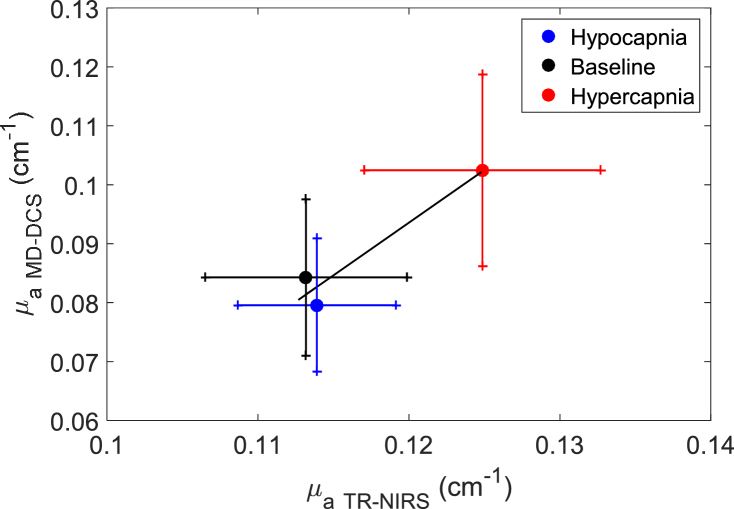
Figure 3 shows the correlation of mean μa values measured by the two systems across the three capnic conditions. Regression analysis revealed a correlation (R2 = 0.94) with a slope of 1.79 and a y-intercept of -.12 cm-1.
Fig. 3.
Regression plot of µa from TR-NIRS and MD-DCS across capnic levels. Solid line is the best-fit from linear regression (slope = 1.79, intercept = -0.12 cm-1 and R2 = 0.94). Data are presented as the mean ± standard error.
3.3. DCS and DCE Data under different flow conditions
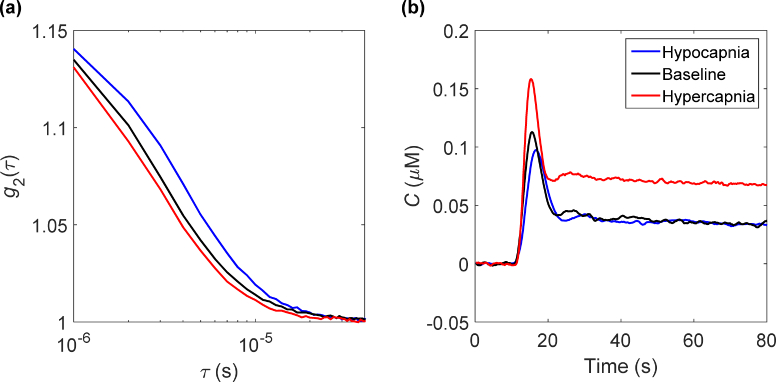
Measured normalized intensity autocorrelation functions and corresponding tissue ICG curves from one animal are shown in Fig. 4. Data from each technique are shown under the three flow conditions. As expected, when CBF increased the autocorrelation curve decayed faster and vice-versa when blood flow decreased. A similar trend was observed with the ICG tissue concentration curves. That is, the peak and initial rise of the first pass time both increased going from hypocapnia to hypercapnia.
Fig. 4.
(A) Normalized intensity autocorrelation functions and (B) corresponding tissue ICG curves measured at baseline, hypercapnia and hypocapnia in a single animal. Each curve in (A) was averaged over 2 minutes.
3.4. CBF measurements
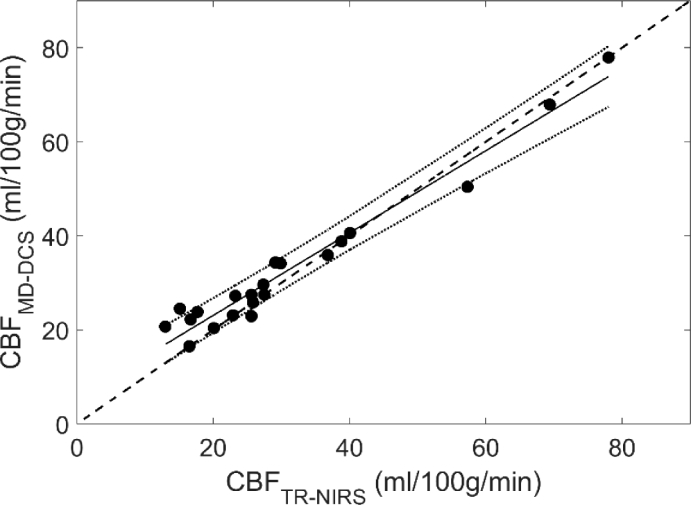
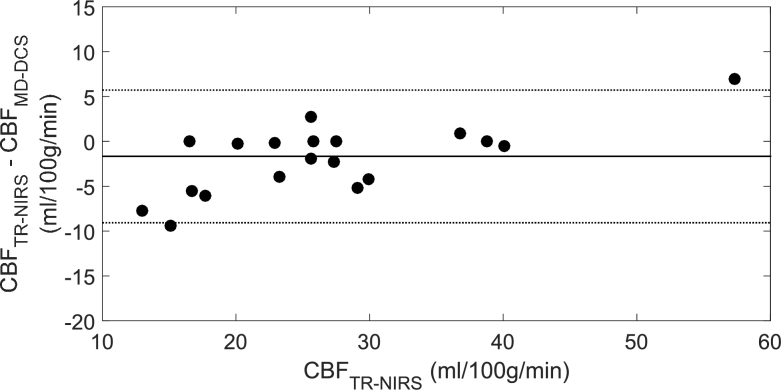
Mean CBF values obtained from the DCE data using optical properties measured by TR NIRS and MD DCS are presented in Table 3 for the three capnic conditions. Figure 5 shows the regression plot between the two sets of CBF values. A strong correlation was found with an R2 = 0.96, slope of 0.88 and y-intercept of 5.6 ml/100g/min. The results of a multi-variate ANOVA revealed significant differences in CBF across capnic levels (F2,12 = 14.3 and p < 0.05), but no significant difference between CBF values obtained with the two sets of optical properties. Corresponding Bland-Altman plot comparing the two sets of CBF measurements is shown in Fig. 6. The mean CBF difference was -1.7 ml/100g/min.
Table 3. CBF values (mean ± standard deviation) calculated for 7 animals under baseline, hypercapnia and hypocapnia from optical properties derived from TR NIRS and MD DCS.
| Cerebral Blood Flow (ml/100g/min) |
|||
|---|---|---|---|
| Technique | Baseline | Hypercapnia | Hypocapnia |
| TR NIRS | 34 ± 18 | 40 ± 18 | 20 ± 4 |
| MD DCS | 33 ± 19 | 41 ± 15 | 24 ± 3 |
Fig. 5.
Regression plot comparing CBF values derived from DCE data using optical properties from TR NIRS and MD DCS (slope = 0.88, intercept = 5.56 ml/100g/min and R2 = 0.96).
Fig. 6.
Bland-Altman plot comparing CBF measurements obtained using the two sets of optical properties. Mean difference is indicated by the solid line (-1.67 ml/100g/min) and the dashed lines indicate the 95% confidence intervals of -9.06 and 5.72 ml/100g/min.
3.5. Flow changes during change in capnic level
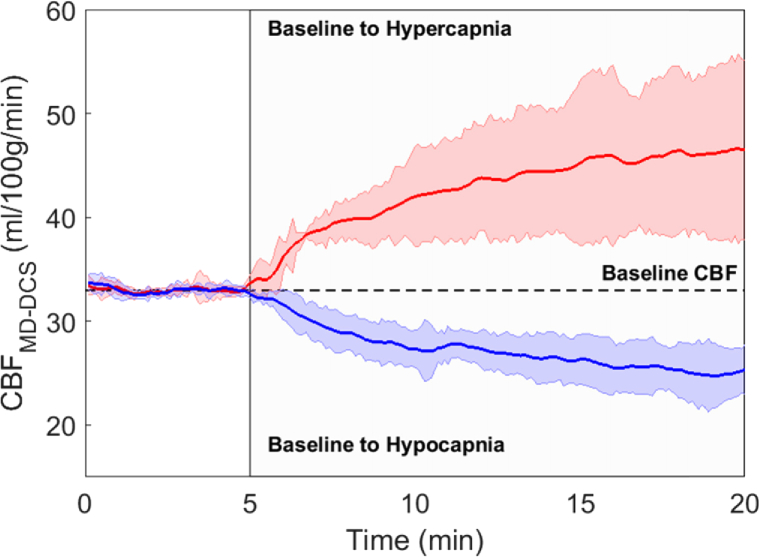
For each animal, relative BFi change was converted to units of CBF using the CBF estimate obtained from the baseline DCE data. The time courses of the CBF change from baseline to hypercapnia and from baseline to hypocapnia are shown in Fig. 7. Each time course was averaged across all animals. The CBF change from baseline to hypercapnia was more rapid than the corresponding change induced by hypocapnia because the former was achieved by adding a small fraction of CO2 into the breathing circuit, while hypocapnia was induced by hyperventilation.
Fig. 7.
Change in CBF induced by hypercapnia (red line) and hypocapnia (blue line). Vertical line indicates start of the capnic challenge. Each time series was averaged across all piglets. Colored shading represents standard deviation.
3.6. Tissue phantom experiments
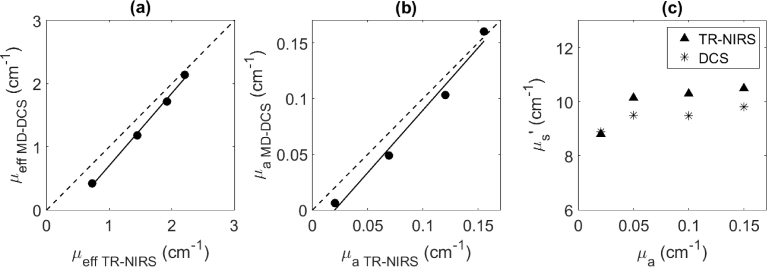
Figure 8(a) presents the correlation between µeff values derived from MD DCS (Eq. (1)) and from μa and µs′ values obtained by TR NIRS (Eq. (2)). The corresponding correlation between µa values from the two systems are shown in Fig. 8(b), and Fig. 8(c) presents µs′ values plotted as a function of the predicted μa for the different India ink concentrations [22]. Average µs′ was 9.9 ± 0.8 cm-1 from TR NIRS and 9.4 ± 0.4 cm-1 from MD DCS. µs′ from MD DCS was slightly lower than the corresponding value from TR NIRS, although this difference did not reach significance. The average values were in good agreement with the expected value of 10 cm-1.
Fig. 8.
(a) Correlation of µeff values (solid points) determined by MD DCS and TR NIRS from an Intralipid/water phantom with different concentrations of India ink added (slope = 1.15, intercept = -0.44 cm-1 and R2 = 0.996). (b) correlation of µa values from the two systems (slope = 1.12, intercept = -0.023 cm-1 and R2 = 0.983). (c) µs′ values plotted as a function of predicted µa for the different India ink concentrations.
4. Discussion
This work presents a DCS system capable of measuring absolute CBF. The key modification to an existing DCS system [24] was replacing a commercial hardware correlator with an in-house-developed software version that enabled the acquisition of light intensity and autocorrelation functions at multiple source-detector distances. The concept of using a software correlator for DCS was initially purposed to optimize the measured correlation times, thereby providing faster acquisition times [17,25]. In this study, switching to a software correlator provided the ability to record light intensity, which was used to track the temporal changes in absorption caused by the passage of ICG through the cerebral vasculature. These changes were subsequently converted to a tissue ICG concentration curve using the baseline optical properties (μeff and µs′) derived by a combination of spatially resolved light intensity measurements and normalized intensity autocorrelation functions. The data presented in Fig. 4 demonstrated that this approach could produce ICG concentration curves with high contrast-to-noise and was sensitive to blood flow changes. A previously validated deconvolution routine [10] was used to extract CBF from the recorded tissue and arterial ICG concentration curves. As a final step, the derived CBF value was used to convert relative blood flow data determined by DCS into units of absolute flow (Fig. 7).
The concept of combining bolus-tracking and DCS techniques was initially proposed by Diop et al. [10]. Using the same animal model as in the current study (newborn piglets), a strong linear correlation between CBF measured by DCE NIRS and the BFi measured by DCS was reported (R2 = 0.89) over a flow range from 17 to 90 ml/100g/min. The study highlighted the value of combining a quantitative NIRS method – in this case TR NIRS – with DCS, as NIRS could be used to obtain the tissue optical properties and conduct a DCE experiment to determine CBF. The limitation was the need to combine two optical methods, which increases costs and the overall complexity of the system [10]. The MD-DCS approach presented in this study offers a less expensive and simpler alternative for monitoring CBF. Furthermore, it avoids any potential partial volume errors between optodes from separate systems and ensures the optical properties are measured at the same wavelength as the DCS data are acquired.
The first study to propose using MD DCS to measure BFi, µs′ and µa was by Farzam et al. [26] based on the concept that acquiring autocorrelation curves at multiple source-detector distances would provide sufficient information to extract reliable estimates of all three parameters. However, the signal-to-noise required to avoid crosstalk between the three fitting parameters limited the techniques to small source-detector separations (< 2 cm) [26]. Recently, Tamborini et al. [18] expanded this idea by acquiring DCS data at both multiple wavelengths and source-detector separations to measure blood oxygenation and BFi. Estimates of five fitting parameters (BFi, two scattering terms, and concentrations of HbO and Hb) were obtained from a single cost function that included measurements of correlations times and light intensity at four source-detector distances and two wavelengths. Experiments involving tissue mimicking phantoms were used to demonstrate the importance of using both multi-distance and multi-wavelength measurements to accurately measure all fitting parameters, particularly μs′ [18].
The current study followed a similar approach to Tamborini et al. by collecting intensity and correlation measurements at multiple source-detector distances. However, the focus was solely on measuring the baseline optical properties to derive tissue ICG concentration curves and not on estimating tissue oxygenation. Consequently, data were recorded at a single wavelength, reducing the number of unknowns to BFi, μa and μs′. In addition, the two studies differed in how the MD intensity and correlation measurements were combined. In the current study, a two-step procedure was implemented: First, μeff was extracted from the MD intensity measurements, analogous to spatially resolved NIRS. Next, the intensity autocorrelation curves obtained at multiple source-detector distances were fit with the solution to the correlation diffusion equation for a semi-infinite homogeneous medium (Eq. 1) using μs′ and BFi as the fitting parameters and setting μeff to the value determined in the first step. The strong correlation between μs′ estimates obtained by MD DCS and TR NIRS (Fig. 2) demonstrated that the former can measure μs′, despite the prediction by Tamborini et al. that data from multiple wavelengths are required. This difference is likely due to the smaller number of fitting parameters used in the current study.
Although a correlation between μa estimates from MD DCS and TR NIRS (Fig. 3) was found in the animal experiments, the values from MD DCS were significantly lower than the corresponding TR-NIRS estimates. Furthermore, the between-subject variability was twice as large for MD DCS (Table 2). The most likely explanation for these discrepancies was errors in μeff, considering the good agreement between μs′ estimates from the two techniques. The primary assumption of spatially resolved NIRS is that the tissue can be modelled as a semi-infinite medium. It is known that extracerebral tissues (scalp and skull) as well as cerebrospinal fluid in the subarachnoid space can affect the accuracy of spatially resolved measurements; however, the impact with respect to measurements on the piglet head should be minimal considering the depth to the brain from the skin surface is less than 3 mm [27]. Another potential source of error is the violation of the assumption of planer geometry. In these experiments, the probes were positioned anteroposterior on one side of the head to achieve as closely as possible the required geometry. However, the piglet’s cranium is relatively small, which could lead to deviations from the assumed geometry. To assess this potential source of error, the optical properties of a homogeneous liquid phantom were measured, and strong correlations with regards to μeff and μa estimates from the two systems were found (Fig. 8). These results suggest that the discrepancies observed in the piglet experiments were likely due to variations in geometry, which could be an issue in clinical studies depending on the curvature of the newborn head at the chosen probe location [28].
Despite the discrepancy in μa between the two techniques, the CBF estimates obtained by analyzing DCE data using the two sets of baseline optical properties were strongly correlated (Fig. 5) and the mean bias from the Bland-Altman analysis was small (-1.7 ml/100g/min). Furthermore, the variability in CBF across animals and capnic conditions was similar for the two sets of optical properties (Table 3). The insensitivity to errors in μa can be explained by considering that the diffusion equation used to derive the tissue ICG concentration curve is primarily dependent on μs′ and μeff, and not μa [20]. Since μeff is proportional to the square root of μa, the impact of errors in μa is diminished. These results indicate that the optical properties obtained from MD DCS were measured with sufficient accuracy to determine CBF and a separate NIRS system specifically for measuring baseline μa and μs′ is not necessary.
There are a number of potential limitations with this study. First, the optical properties measured by the two techniques were not at the same wavelength: the TR-NIRS data were acquired at 802 nm while the DCS measurements were at 785 nm. A previous study reported that this wavelength difference would lead to differences in optical properties of the order of 5% [10]. Second, TR-NIRS was only used to measure μa and μs′, and not to acquire a separate set of ICG concentration curves. The latter was not performed because the most direct means of measuring absorption changes due to the passage of ICG through tissue is by measuring the change in light intensity. In contrast, TR-NIRS requires careful attention to ensure a linear relationship between dynamic absorption changes and the recorded distributions of times of flight [10].
Another potential limitation with the study was that hypercapnia was induced by adding 6% CO2 to the inhaled gas mixture rather than altering the animal’s breathing rate and volume, such as performed to induced hypocapnia. The former was conducted in order to elicit a rapid increase in PaCO2, which in turn would lead to a rapid CBF response. However, introducing the CO2 into the breathing circuit required reducing O2 flow, which resulted in a significant drop in PaO2 relative to baseline (Table 2). Despite this decrease, PaO2 remained within normal limits and its effects on CBF would be small relatively to the large increase in PaCO2. Finally, this MD-NIRS approach is based on assumption that the detectors at different at source-detector separations (15, 20 and 25 mm) are interrogating a medium with the same optical properties. This is clearly an approximation, which is likely reasonable for neonates since extracerebral signal contamination is generally considered small. Adapting this technology to adults would be challenging since the presence of a relatively thick extracerebral layer (of the order of 1 to 1.5 cm thick) violates the basic assumption of spatially resolved NIRS.
Based on these results, a potential next step would be to conduct a clinical study to determine if there are blood flow thresholds related to brain injury (i.e., intraventricular hemorrhage or periventricular leukomalacia) in preterm infants under intensive care. This would be analogous to studies of ischemic stroke in the mature brain that have shown that the extent of brain injury is related to both the duration and value of CBF. In this preterm infant population, specific ischemic thresholds remain unknown since even normal CBF is considerably lower compared to the mature brain.
Funding
Natural Sciences and Engineering Research Council of Canada10.13039/501100000038 (R3592A02002); Canadian Institutes of Health Research10.13039/501100000024 (140171).
Disclosures
The authors declare that there are no conflicts of interest related to this article.
References
- 1.Durduran T., Yodh A. G., “Diffuse correlation spectroscopy for non-invasive, micro-vascular cerebral blood flow measurement,” NeuroImage 85(Pt 1), 51–63 (2014). 10.1016/j.neuroimage.2013.06.017 [DOI] [PMC free article] [PubMed] [Google Scholar]
- 2.Boas D. A., Campbell L. E., Yodh A. G., “Scattering and imaging with diffusing temporal field correlations,” Phys. Rev. Lett. 75(9), 1855–1858 (1995). 10.1103/PhysRevLett.75.1855 [DOI] [PubMed] [Google Scholar]
- 3.Lynch J. M., Buckley E. M., Schwab P. J., McCarthy A. L., Winters M. E., Busch D. R., Xiao R., Goff D. A., Nicolson S. C., Montenegro L. M., Fuller S., Gaynor J. W., Spray T. L., Yodh A. G., Naim M. Y., Licht D. J., “Time to surgery and preoperative cerebral hemodynamics predict postoperative white matter injury in neonates with hypoplastic left heart syndrome,” J. Thorac. Cardiovasc. Surg. 148(5), 2181–2188 (2014). 10.1016/j.jtcvs.2014.05.081 [DOI] [PMC free article] [PubMed] [Google Scholar]
- 4.Dehaes M., Aggarwal A., Lin P.-Y., Rosa Fortuno C., Fenoglio A., Roche-Labarbe N., Soul J. S., Franceschini M. A., Grant P. E., “Cerebral oxygen metabolism in neonatal hypoxic ischemic encephalopathy during and after therapeutic hypothermia,” J. Cereb. Blood Flow Metab. 34(1), 87–94 (2014). 10.1038/jcbfm.2013.165 [DOI] [PMC free article] [PubMed] [Google Scholar]
- 5.Farzam P., Buckley E. M., Lin P. Y., Hagan K., Grant P. E., Inder T. E., Carp S. A., Franceschini M. A., “Shedding light on the neonatal brain: Probing cerebral hemodynamics by diffuse optical spectroscopic methods,” Sci. Rep. 7(1), 15786 (2017). 10.1038/s41598-017-15995-1 [DOI] [PMC free article] [PubMed] [Google Scholar]
- 6.Nourhashemi M., Kongolo G., Mahmoudzadeh M., Goudjil S., Wallois F., “Relationship between relative cerebral blood flow, relative cerebral blood volume, and relative cerebral metabolic rate of oxygen in the preterm neonatal brain,” Neurophotonics 4(2), 021104 (2017). 10.1117/1.NPh.4.2.021104 [DOI] [PMC free article] [PubMed] [Google Scholar]
- 7.Roche-Labarbe N., Carp S. A., Surova A., Patel M., Boas D. A., Grant P. E., Franceschini M. A., “Noninvasive optical measures of CBV, StO(2), CBF index, and rCMRO(2) in human premature neonates’ brains in the first six weeks of life,” Hum. Brain Mapp. 31(3), 341–352 (2010). 10.1002/hbm.20868 [DOI] [PMC free article] [PubMed] [Google Scholar]
- 8.Diop M., Kishimoto J., Toronov V., Lee D. S. C., St. Lawrence K., “Development of a combined broadband near-infrared and diffusion correlation system for monitoring cerebral blood flow and oxidative metabolism in preterm infants,” Biomed. Opt. Express 6(10), 3907 (2015). 10.1364/BOE.6.003907 [DOI] [PMC free article] [PubMed] [Google Scholar]
- 9.Lin P. Y., Hagan K., Fenoglio A., Grant P. E., Franceschini M. A., “Reduced cerebral blood flow and oxygen metabolism in extremely preterm neonates with low-grade germinal matrix- intraventricular hemorrhage,” Sci. Rep. 6(1), 25903 (2016). 10.1038/srep25903 [DOI] [PMC free article] [PubMed] [Google Scholar]
- 10.Diop M., Verdecchia K., Lee T.-Y., St Lawrence K., “Calibration of diffuse correlation spectroscopy with a time-resolved near-infrared technique to yield absolute cerebral blood flow measurements,” Biomed. Opt. Express 2(7), 2068 (2011). 10.1364/BOE.2.002068 [DOI] [PMC free article] [PubMed] [Google Scholar]
- 11.Boas D. A., Sakadžic S., Selb J., Farzam P., Franceschini M. A., Carp S. A., “Establishing the diffuse correlation spectroscopy signal relationship with blood flow,” Neurophotonics 3(3), 031412 (2016). 10.1117/1.NPh.3.3.031412 [DOI] [PMC free article] [PubMed] [Google Scholar]
- 12.Tortora D., Mattei P. A., Navarra R., Panara V., Salomone R., Rossi A., Detre J. A., Caulo M., “Prematurity and brain perfusion: Arterial spin labeling MRI,” NeuroImage Clin. 15(15), 401–407 (2017). 10.1016/j.nicl.2017.05.023 [DOI] [PMC free article] [PubMed] [Google Scholar]
- 13.Kim M. N., Durduran T., Frangos S., Edlow B. L., Buckley E. M., Moss H. E., Zhou C., Yu G., Choe R., Maloney-Wilensky E., Wolf R. L., Grady M. S., Greenberg J. H., Levine J. M., Yodh A. G., Detre J. A., Kofke W. A., “Noninvasive measurement of cerebral blood flow and blood oxygenation using near-infrared and diffuse correlation spectroscopies in critically brain-injured adults,” Neurocrit. Care 12(2), 173–180 (2010). 10.1007/s12028-009-9305-x [DOI] [PMC free article] [PubMed] [Google Scholar]
- 14.He L., Baker W. B., Milej D., Kavuri V. C., Mesquita R. C., Busch D. R., Abramson K., Jiang Y. J., Diop M., St Lawrence K., Amendolia O., Quattrone F., Balu R., Kofke W. A., Yodh A. G., “Noninvasive continuous optical monitoring of absolute cerebral blood flow in critically ill adults,” Neurophotonics 5(4), 1 (2018). 10.1117/1.NPh.5.4.045006 [DOI] [PMC free article] [PubMed] [Google Scholar]
- 15.St Lawrence K., Verdecchia K., Elliott J., Diop M., “Measuring cerebral hemodynamics and energy metabolism by Near-Infrared spectroscopy,” in Brain Energy Metabolism, Hirrlinger J., Waagepetersen H. S., eds. (Springer, 2014). [Google Scholar]
- 16.Diop M., Tichauer K. M., Elliott J. T., Migueis M., Lee T.-Y., St. Lawrence K., “Comparison of time-resolved and continuous-wave near-infrared techniques for measuring cerebral blood flow in piglets,” J. Biomed. Opt. 15(5), 057004 (2010). 10.1117/1.3488626 [DOI] [PubMed] [Google Scholar]
- 17.Wang D., Parthasarathy A. B., Baker W. B., Gannon K., Kavuri V., Ko T., Schenkel S., Li Z., Li Z., Mullen M. T., Detre J. A., Yodh A. G., “Fast blood flow monitoring in deep tissues with real-time software correlators,” Biomed. Opt. Express 7(3), 776 (2016). 10.1364/BOE.7.000776 [DOI] [PMC free article] [PubMed] [Google Scholar]
- 18.Tamborini D., Farzam P., Zimmermann B., Wu K.-C., Boas D. A., Franceschini M. A., “Development and characterization of a multidistance and multiwavelength diffuse correlation spectroscopy system,” Neurophotonics 5(01), 1 (2017). 10.1117/1.NPh.5.1.011015 [DOI] [PMC free article] [PubMed] [Google Scholar]
- 19.Verdecchia K., Diop M., Lee T.-Y., St Lawrence K., “Quantifying the cerebral metabolic rate of oxygen by combining diffuse correlation spectroscopy and time-resolved near-infrared spectroscopy,” J. Biomed. Opt. 18(2), 027007 (2013). 10.1117/1.JBO.18.2.027007 [DOI] [PubMed] [Google Scholar]
- 20.Kienle A., Patterson M. S., “Improved solutions of the steady-state and the time-resolved diffusion equations for reflectance from a semi-infinite turbid medium,” J. Opt. Soc. Am. A 14(1), 246–254 (1997). 10.1364/JOSAA.14.000246 [DOI] [PubMed] [Google Scholar]
- 21.Brown D. W., a Picot P., Naeini J. G., Springett R., Delpy D. T., Lee T.-Y., “Quantitative near infrared spectroscopy measurement of cerebral hemodynamics in newborn piglets,” Pediatr. Res. 51(5), 564–570 (2002). 10.1203/00006450-200205000-00004 [DOI] [PubMed] [Google Scholar]
- 22.Spinelli L., Botwicz M., Zolek N., Kacprzak M., Milej D., Sawosz P., Liebert A., Weigel U., Durduran T., Foschum F., Kienle A., Baribeau F., Leclair S., Bouchard J.-P., Noiseux I., Gallant P., Mermut O., Farina A., Pifferi A., Torricelli A., Cubeddu R., Ho H.-C., Mazurenka M., Wabnitz H., Klauenberg K., Bodnar O., Elster C., Bénazech-Lavoué M., Bérubé-Lauzière Y., Lesage F., Khoptyar D., Subash A. A., Andersson-Engels S., Di Ninni P., Martelli F., Zaccanti G., “Determination of reference values for optical properties of liquid phantoms based on Intralipid and India ink,” Biomed. Opt. Express 5(7), 2037 (2014). 10.1364/BOE.5.002037 [DOI] [PMC free article] [PubMed] [Google Scholar]
- 23.Bland J. M., Altman D. G., “Statistical methods for assessing agreement between two methods of clinical measurement,” Lancet 327(8476), 307–310 (1986). 10.1016/S0140-6736(86)90837-8 [DOI] [PubMed] [Google Scholar]
- 24.Yu G., Durduran T., Zhou C., Cheng R., Yodh A., “Near-Infrared Diffuse Correlation Spectroscopy for Assessment of Tissue Blood Flow,” in Handbook of Biomedical Optics Boas D. A., Pitris C., Ramanujam N., eds. (CRC Press, 2011), pp. 195–216. [Google Scholar]
- 25.Magatti D., Ferri F., Introduction I., “25 ns software correlator for photon and fluorescence correlation spectroscopy,” Rev. Sci. Instrum. 74(2), 1135–1144 (2003). 10.1063/1.1525876 [DOI] [PubMed] [Google Scholar]
- 26.Farzam P., Durduran T., “Multidistance diffuse correlation spectroscopy for simultaneous estimation of absolute scattering and absorption coefficient and the blood flow index,” J. Biomed. Opt. 20(5), 055001 (2015). 10.1117/1.JBO.20.5.055001 [DOI] [PubMed] [Google Scholar]
- 27.Diop M., Elliott J. T., Tichauer K. M., Lee T. Y., St. Lawrence K., “A broadband continuous-wave multichannel near-infrared system for measuring regional cerebral blood flow and oxygen consumption in newborn piglets,” Rev. Sci. Instrum. 80(5), 054302 (2009). 10.1063/1.3123347 [DOI] [PubMed] [Google Scholar]
- 28.Dehaes M., Grant P. E., Sliva D. D., Roche-Labarbe N., Pienaar R., Boas D. A., Franceschini M. A., Selb J., “Assessment of the frequency-domain multi-distance method to evaluate the brain optical properties: Monte Carlo simulations from neonate to adult,” Biomed. Opt. Express 2(3), 552 (2011). 10.1364/BOE.2.000552 [DOI] [PMC free article] [PubMed] [Google Scholar]


