Abstract
Because of the optical properties of medical fluorescence images (FIs) and hardware limitations, light scattering and diffraction constrain the image quality and resolution. In contrast to device-based approaches, we developed a post-processing method for FI resolution enhancement by employing improved generative adversarial networks. To overcome the drawback of fake texture generation, we proposed total gradient loss for network training. Fine-tuning training procedure was applied to further improve the network architecture. Finally, a more agreeable network for resolution enhancement was applied to actual FIs to produce sharper and clearer boundaries than in the original images.
1. Introduction
Intraoperative near-infrared (NIR) fluorescence imaging is an emerging clinical imaging modality, which can effectively assist various kinds of surgical treatments and is attracting increased attentions from both imaging and surgical fields [1]. As it utilizes NIR fluorescence probes and specially designed optical imaging systems for real-time visualization during a surgery, it is non-radioactive, portable, and relatively cost-effective [2–4]. Typical applications include sentinel lymph node detection [5,6], tumor visualization [4], and the identification of other vital structures [7,8]. Clinical applications based on this technique mainly depend on the fluorescence contrast between the target area and surrounding tissues. Such differences can be caused by delivering a contrast agent with a spatially varying concentration in the tissues. It can also be designed with a targeting probe for both diagnostic and therapeutic purposes in specific biochemical environments [9]. When illuminated by an excitation light, the contrast agent with various concentrations in tissues emits a fluorescent signal, which is received by a charge-coupled device (CCD) camera for imaging. The migration of the excitation and emission photons through the tissues is likely to cause the fluorescence signal to disperse and be lost in space [10]. Because of the optical limitations of light scattering and diffraction as well as hardware restriction, medical fluorescence images (FIs) suffer from a relatively low contrast and reduced spatial resolution at the boundaries. This is problematic in cases where a fine analysis of the fluorescence concentration is required, such as photodynamic therapy with photosensitizer measurements in tissue [11] and recognizing vessels or nerves in vivo [12,13].
For the resolution enhancement of fluorescence images, many previous studies focused on the processing of microscopy fluorescence images [14,15], but for clinical fluorescence images, most of them still rely on the improvement of hardware performance. Even though many groups have developed hardware-based methods over the last 5–10 years to improve the FI resolution [16–18], post-processing techniques are still an appealing approach to alleviate the limitations of optical properties and hardware. For natural image resolution enhancement, deep learning methods have achieved great image recovery performances with high quality and relatively sharp edges [19–24]. SRGAN was proposed by Ledig et al. and implements a deep residual network to recover more realistic photos from heavily down-sampled natural images [25]. SRGAN can reconstruct more perceptually convincing images than the other state-of-the-art deep learning methods that are not based on GAN [25]. However, SRGAN also generates fake textures to sharpen images, which should be minimized for medical applications. More suitable networks based on deep learning methods should be developed that provide less fake textures and high-contrast boundaries for FI resolution enhancement.
We propose a novel FI resolution enhancement method that uses the total gradient loss to improve generative adversarial networks (GANs) and produce both sharpened edges and fewer artifact textures. To simulate low-resolution FI reconstruction we first down-sampled images, and then trained our network with pairs of original and re-up-scaled images with a scale factor. Compared to SRGAN, our proposed method performed better with both the down-sampled FI dataset and the original resolution plate. Noise-affect resolution plate experiments were conducted that further illustrated the effectiveness and robustness of the network for image enhancement. Furthermore, we tested our method on a real FI of mouse tail blood vessels and a video of intraoperative fluorescence imaging acquired from a breast cancer surgery. The results showed image resolution enhancement with sharpened edges.
2. Methods
In this section, we describe the principle of fluorescence imaging and simplify the problem of low resolution with a down-sampled and re-up-scaled function model. Then, the proposed FI resolution enhancement method based on GAN is presented. To address the problem of fake textures, we propose total gradient loss to train the network. We then present a fine-tuning training procedure for the network architecture improvement based on the microscopy FI training dataset.
2.1. Problem formulation
The purpose of this study was to recover low-resolution FIs with sharpened boundaries and high-resolution quality. A low-resolution FI is caused by many factors, which we divided into three main groups.
1) Fig. 1 shows the basic principle for intraoperative NIR fluorescence imaging. After a short excitation light pulse, light photons pass through the thick tissue and reach the target area where the fluorescence contrast agent has accumulated. When the excitation light photon is absorbed by a fluorophore, a new fluorescence photon is launched at a longer wavelength and is eventually absorbed or emitted at the surface to be received by a CCD camera with an appropriate filter. To simplify the photon propagation process in the tissue, we omitted other factors that introduce complexity, such as the reabsorption of fluorescence photons, diffuse reflection of the excitation light on the tissue surface, and fluorescence quenching of the contrast agent over time [10]. The simplified optical propagation model is usually described as a point spread function (PSF) [26]. The PSF of an isotropic point source is often approximated as a Gaussian function [26]:
| (1) |
where is calculated from the fluorophore in the specimen that specifies the width of the PSF, is the peak intensity, which is proportional to the photon emission rate and decreases because of the photon absorption effect, and is the location of the fluorophore. Optical properties (e.g., light absorption, scattering, and diffraction) change the photon propagation path and absorb part of the fluorescent emission photons, which leads to blurring and low resolution of the FI [27]. In addition, different tissues have different absorption and scattering properties, even for the same tissue in different parts [28]. Thus, optical scattering and diffraction reduce the signal-to-noise ratio (SNR), which limits the resolution of fluorescence images. Moreover, the complexity and inconsistency of the light propagation procedure make it difficult to describe these phenomena with precise mathematical models.
Fig. 1.
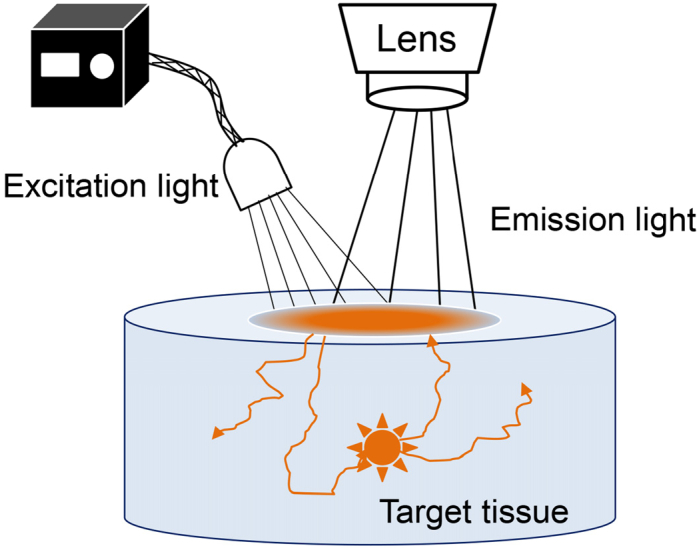
Schematic illustration of the intraoperative NIR fluorescence imaging.
2) Hardware limitations are another factor that limits the quality of FIs. The resolution of FI is majorly determined by the sampling rate of the camera, the numerical aperture (NA) of the lens, and the SNR of the overall system. Thus, low-resolution can be directly improved by using a better imaging system with higher specifications, but this often brings the increase of cost [29]. Furthermore, a high-quality imaging system also increases the device volume and weight, which inevitably reduces the ergonomics and portability. There is a trade-off between the imaging resolution, ergonomics, and cost when designing an intraoperative NIR fluorescence imaging system [30]. Therefore, it is worthy of improving the imaging quality through image prost-processing methods rather than only upgrading the hardware setups.
3) The adverse ambient light condition and lower contrast agent accumulation normally lead to a low SNR during intraoperative NIR fluorescence imaging and blur the imaging contrast [31]. In such situation, operators frequently enhance the image contrast to elucidate object details by manually expending the exposure bar, so that the dynamic range of the camera can be fully utilized. However, this excessive enhancement actually damages the overall resolution and visual effects, as even more noise would be introduced into the image [32].
Because the causes of the limited resolution are many and complex, developing a single mathematical expression is difficult. However, the common features among the factors mentioned above are a loss of photon signals and diffraction effects. Therefore, we can simulate this low-resolution problem as a down-sampling and then re-upscaling procedure:
| (2) |
where X is the high-resolution FI, D is the down-sampling operator, U is the augmenting operator with the bicubic interpolation method, and Y is the low-resolution FI. We applied the deep learning method to fit the inverse process from Y to . The objective is to minimize the differences between X and .
2.2. General GAN for resolution enhancement
Goodfellow [33] proposed the GAN, which can be used to generate higher-quality samples () from a distribution of a low-resolution dataset y. GAN can be approximated as a minmax game between a generator network G and a discriminator network D [33]:
| (3) |
where y is sampled from the distribution of the low-resolution images and x is from the distribution of the real dataset with high-resolution images. The discriminator is responsible for judging the gap between the synthesized fake sample and real sample x. Meanwhile, the results are presented in the form of scores that are fed back to the generator network. Thus, the G output is continuously optimized through the minmax game.
GAN has the advantage of solving the regression problem of image recovery. SRGAN is a new state-of-the-art method for natural image resolution enhancement; it is a GAN-based network optimized for perceptual loss that is calculated on feature maps of the Visual Geometry Group (VGG) network, as described by Simonyan and Zisserman [34]. The perceptual loss is defined as the Euclidean distance between the feature representations of a reconstructed image and reference image :
| (4) |
Where is the feature map obtained by the VGG network and W and H are the dimensions of the respective feature maps. A deep residual network is applied in the generator of SRGAN to decrease the losses, including the content loss and adversarial loss. Considering the unstable characteristics of the GAN training procedure, many improvements have been proposed, such as the Wasserstein GAN [35], improved Wasserstein GAN with gradient penalty [36], least-squares GAN [37], deep convolutional GAN [38], and loss-sensitive GAN with the Lipschitz density [39]. Many have been proven to significantly enhance the performance in certain applications.
2.3. Proposed method
2.3.1. Network architecture and loss functions
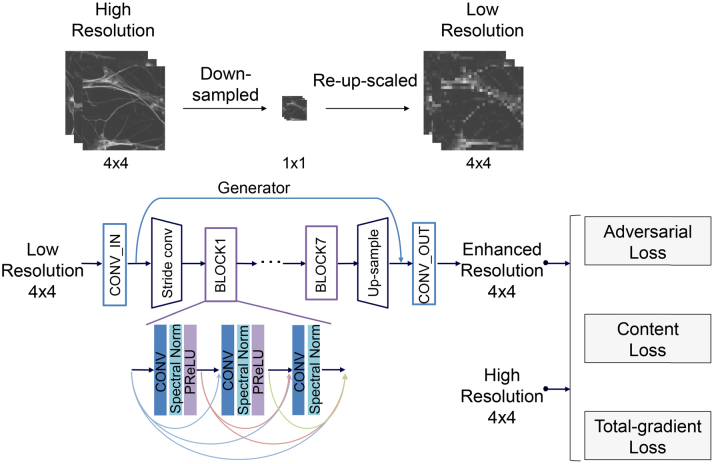
The overall framework of our FI resolution enhancement method is shown in Fig. 2 . Simulate low-resolution (LR) images by first down-sample the high-resolution (HR) images and then re-upscaled to the original size through bicubic interpolation with a scale factor. Then, pairs of HR and LR images were imported to the networks for training purpose. We used a least-squares GAN model [37] with seven dense residual blocks [40] and spectral normalization [41] in the generator to overcome the low-resolution problem. The primary objective functions for the GAN used in this study can be described as follows:
| (5) |
| (6) |
| (7) |
| (8) |
where is the discriminator loss, is the discriminator score of the real image with high resolution, is the discriminator score of the fake image generated from the generator network, and is the adversarial loss, which is a part of the generative loss . The generative loss has three parts: the content loss , adversarial loss mentioned above, and total gradient loss. The content loss includes MSE loss, L1Smooth loss, and perception loss, which further includes VGG_loss and ResNet_loss.
Fig. 2.
Simulation of Low-resolution images and improved GAN-based architecture for fluorescence image resolution enhancement.
2.3.2. Total gradient loss
The total gradient (TG) loss was proposed for using in the network to mitigate the problem of fake textures produced by SRGAN method. This approach was inspired by the total variation [42], which is an algorithm designed for denoising by minimizing the gradients of adjacent pixels for each pixel in an image. In this study, we compared the pre-defined gradients (Eq. 9) from the generated and real images to develop a loss function (named as the TG loss) that provides feedback for network training. The TG loss is mathematically expressed as follows:
| (9) |
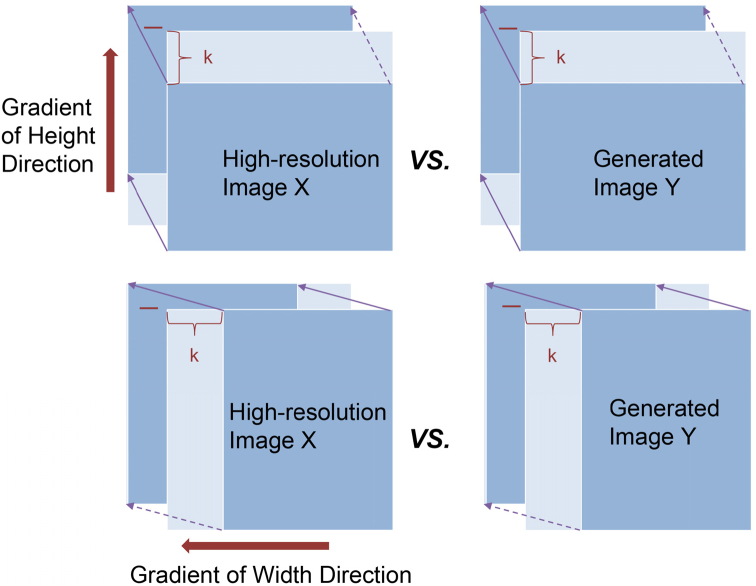
where and are the pixel values of the original high-resolution image X and low-resolution image Y, respectively; is the gradient of the image along the width, and is the gradient of the image along the height; is the total differences between the gradients of X and Y along the width, and is that along the height; is the total pixel number along the height, and is the total pixel number along the width; k is the number of pixel offsets in each loop, ranging from 1 to kmax, and kmax is half of the pixel numbers along the width (or the height) of the image.
The reason of designing the TG loss to train our network is because it does not only compare the gradient of two adjacent pixels between generated and original images, it also compares gradients of long-distanced pixels between these two images (Fig. 3 ). Because for the detailed texture of an image, we assume that each pixel is related with its surrounding neighbors, as well as its distanced pixels. Comparing the long-distanced gradients of corresponding pixels between the two images helps to reduce the differences. The unique feature of TG loss takes account of this assumption, so that fake textures can be minimized in generated images.
Fig. 3.
Schematic of total-gradient algorithm.
Setting offset k to be the half of the total pixel number N ( or ) can include all pixels of the image into the calculation process. When kmax is greater than N/2, some pixels will be excluded from the procedure of the loss calculation, and then the proportion of other pixels in the loss calculation will be increased. This excessive calculation will bring inhomogeneities. When kmax is equal to 1, only adjacent pixel variations are included into the loss calculation between two images. Furthermore, to evaluate the optimal value of kmax, controlled experiments were conducted. Based on those reasons, in order to generate an image with enhanced resolution and suppressed fake texture, we employed the difference of TG between original and generated images as the training loss.
2.3.3. Networks and training settings
In this study, we used the pretrained VGG16 [34] and ResNET152 [43] models to calculate the perception losses. The network was trained with a loss function having the following fixed hyperparameters: , which are the parameters in Eqs. (7) and (8) in the first training procedure. These parameters are adjusted depending on the loss changes and validation dataset performances, which including the generator loss and the PSNR (dB) calculated at the end of each epoch during training procedure. We adopted Adam optimization with a learning rate of for both the generative and adversarial networks. To speed up the training process and image generation procedure as well as to simulate the photon propagation properties in thick tissues, we adopted the network architecture shown in Fig. 2. In the network, we first down-sampled the low-resolution images by the stride convolution [38] to reduce the image size and speed up the calculation. Meanwhile, we extracted the main features by learning the parameters of the stride convolution kernel. Then, ResNET and sub-pixel convolution layer [44] structures were applied to upscale the images. Considering the similarity structures between low-resolution FIs and the simulated low-resolution images, a scale factor of was selected for this study. We first trained the network by using natural image datasets with a batch size of 64 and random crop size of 64. A validation dataset was used to evaluate the network performance of every epoch. The first training step was run for 200 epochs, and the epoch with higher peak signal-to-noise ratio (PSNR) [45] calculated for the validation set was selected as the starting epoch in the next fine-tuning procedure. Both the down-sampling (strided convolution) and up-sampling (sub-pixel convolution layer) procedures were performed on the networks, and all were trained together during the training process.
2.3.4. Fine-tuning learning
To obtain more suitable networks for medical FIs, a fine-tuning procedure was performed during the second training process. For the fine-tuning procedure, a microscopic FI dataset including images with sharp edges was used for training. Based on experimental results, we adjusted the parameters of the loss function in Eqs. (7) and (8) as follows: . Adam optimization with a learning rate of was performed during the fine-tuning training procedure. The batch size was 64, and the crop size was 32. To avoid overfitting the fine-tuning training set, we developed a validation set to monitor the PSNR (dB) performance of every epoch and obtained better networks by stopping early.
2.4. Implementation details and evaluation methods
2.4.1. Implementation
We implemented our FI resolution enhancement method with PyTorch 0.4.1, which is a library of Python 3.6. The code was run on a GPU (NVIDIA GeForce RTX 2070, 8 GB) and CPU (Intel Core i7-6700 @ 3.40 Hz).
2.4.2. Evaluation methods
The root mean square error (RMSE) [46], PSNR (dB), and structural similarity index (SSIM) [47] were used to compare the SRGAN and the improved FI resolution enhancement method. SRGAN was implemented in PyTorch [48]. FIs were divided into validation and test datasets for the training and evaluation of the networks. We adopted resolution plates, resolution plates with Poisson noise, and an original FI of blood vessels in mouse tail, as well as an intraoperative NIR fluorescence imaging video to test the performance of our FI resolution enhancement method.
3. Experiments and results
Experiments were performed as explained above. We evaluated the network performance with a macro FI test dataset. Note that the test images were down-sampled, and the original images were used as the ground truth for comparison. The experimental results are presented below.
3.1. Dataset preparation and experimental settings
The first training procedure was performed on natural image datasets (VOC2012 and DIV2K). The corresponding validation dataset consisted of four images that were randomly picked from CImageNET400 and constrained by the memory storage of the GPU. After the first training procedure using natural images, we also employed the second training (the fine-tuning procedure). Because our method was aimed to enhance the resolution of macro FIs, we needed to establish the fine-tuning training dataset with higher resolution FIs. Thus, we chose microscopy FIs with good image quality, along with the down-sampled and re-up-scaled processing, as the second fine-tuning training dataset. Data augmentation strategies (e.g., cropping, cutting, adjusting the brightness) were used to expand the volume of the fine-tuning training dataset. The parameters were set according to the training procedure described above. The fluorescence microscopy images for fine-tuning training were taken from https://storage.googleapis.com/in-silico-labeling/data_sample.zip.
To assist the fine-turning procedure, we further established a fine-tuning validation dataset, which consisted of 10 images from four intraoperative NIR fluorescence imaging videos. Furthermore, the test dataset consisted of 60 images from the other four NIR fluorescence imaging videos was used to evaluate the overall performance of the proposed method. To avoid overfitting caused by FI similarity, all employed images extracted from NIR videos were sampled with obvious differences. The intraoperative NIR fluorescence imaging videos were acquired by the Peking University People’s Hospital (clinical trial number: NCT02611245 in ClinicalTrials.gov).
3.2. Fluorescence image dataset test results
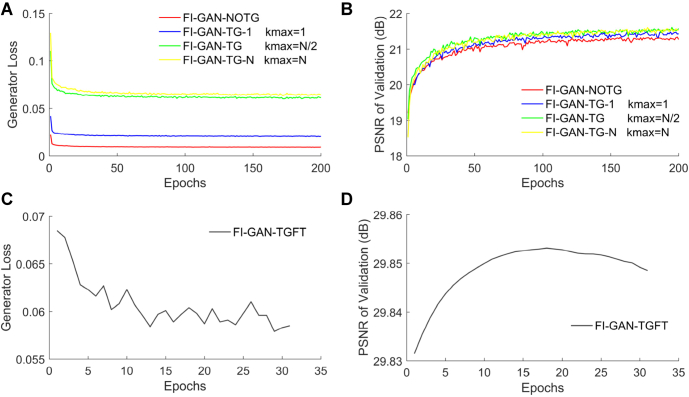
We first applied our training procedure to a set of down-sampled and re-up-scaled natural images and made the networks learn this transform to recover the original high-resolution images. To evaluate the effects of the total gradient loss, TG loss with different parameters and fine-tuning procedure on the network training results, we trained the networks separately: without the TG loss (FI-GAN-NOTG) and with the TG loss for kmax = 1 (FI-GAN-TG-1), kmax = N/2 (FI-GAN-TG), as well as kmax = N (FI-GAN-TG-N) (Fig. 4(A) and 4(B) ). These results showed that the TG loss with kmax = N/2 achieved a better performance. Please note that in these controlled experiments, we fixed the weight parameter () of the TG loss to evaluate the performances with different kmax values. Then, the epoch with better PSNR value of FI-GAN-TG (kmax = N/2) was selected as the preliminary training network result. We transformed the training procedure to the fine-tuning process (FI-GAN-TGFT). During this process, the validation indicators were also computed on a FI validation dataset. The second training loss and the resulted PSNR of the validation dataset are plotted in Fig. 4(C) and (D), respectively. The PSNR of the fine-tuning procedure first increased and then decreased (Fig. 4(D)); we selected the peak as the final network.
Fig. 4.
Training procedures of kmax evaluation and fine-tuning. (A) Generator loss curve with and without TG loss constraint. Different kmax values (1, N/2, and N) was set for the TG loss in the first training procedure. (B) PSNR (dB) of the validation dataset with and without TG loss constraint. (C) Generator loss curve in the fine-tuning procedure. kmax was set to be N/2 for the TG loss. (D) PSNR (dB) of the validation dataset in the fine-tuning procedure.
We used 60 macro FIs as the test dataset to compare the performances of our method with different parameters with SRGAN. Table 1 presents the statistical results in terms of RMSE, PSNR, and SSIM. The results showed that in the first training procedure, the FI-GAN-TG (kmax = N/2) provided a better performance than the other two networks (kmax = 1 and N). After the second training procedure (the fine-tuning), the obtained FI-GAN-TGFT further improved the performance from FI-GAN-TG.
Table 1. Statistics of Different Networks and Different kmax Values in TG loss.
| Fluorescence60 | SRGAN | FI-GAN-NOTG | FI-GAN-TG-1 kmax = 1 | FI-GAN-TG kmax = N/2 | FI-GAN-TG-N kmax = N | FI-GAN-TGFT |
|---|---|---|---|---|---|---|
| RMSE | 0.0209 | 0.0215 | 0.0217 | 0 . 0203 | 0.0209 | 0.0200 |
| PSNR (dB) | 34.12 | 33.88 | 33.79 | 34.42 | 34.16 | 34.58 |
| SSIM | 0.8929 | 0.8880 | 0.8981 | 0.9127 | 0.9033 | 0.9164 |
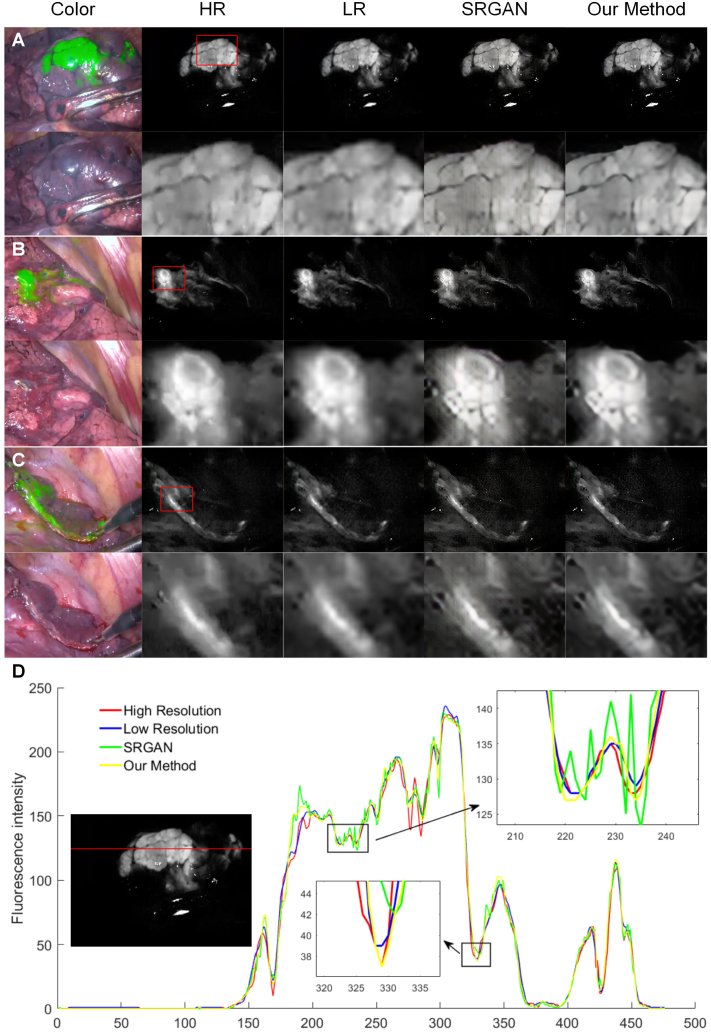
Figure 5 shows the performances with three examples in the test dataset. These FIs included the lung tissue, Indocyanine green (ICG) injection point for lung lymph node mapping, and the lung tissue incision. The first column shows the merged and color images of the corresponding FIs. The second and third columns show the original high-resolution (HR) images and the preprocessed low-resolution (LR) images.
Fig. 5.
Test results for FI resolution enhancement network with down-sampled examples. (A) The lung tissue; (B) ICG injection point for lung lymph node mapping; (C) The lung tissue incision; (D) Fluorescence intensity quantitative analysis of (A). In (A-C) from left to right, merged and color images, original fluorescence images with relative high resolution, down-sampled fluorescence images with low resolution, images processed by SRGAN, images processed by our method. In (D), the local curve of (A) is amplified showing fake textures (stripe artifacts) with vibration under SRGAN processing.
To clarify the detail variations, we magnified parts of the images with red frames which are shown in every second row. It was difficult to discover the differences between the post-processing methods at the small scale, but the difference between processed images can clearly be seen when magnified. False textures were observed with SRGAN and diminished with the proposed method. The quantitative analysis of Fig. 5(A) is shown in Fig. 5(D). The change in the fluorescence intensity at the red line indicates that our method fit well to the original image, and SRGAN showed a jittery curve because of fake textures (stripe artifacts). All of the preprocessed LR images were after the down-sampling. The difference between our method and SRGAN was whether the image input into the network was re-amplified to the original size by bicubic interpolation.
3.3. Resolution plate test results
As a practical application comparation with SRGAN, we tested the performance of the proposed method with a fluorescence resolution plate made of the serum-soluble ICG and a negative optical resolution plate. A solution was prepared by dissolving 2 mg of ICG in 10 ml of serum. A thin layer of the ICG solution was placed over a Petri dish, and the negative of the optical resolution plate was slowly placed on it to avoid air bubbles. The resolution plate was used with fluorescence imaging equipment developed by the Laboratory of Molecular Imaging at the Chinese Academy of Sciences to detect fluorescence signals.
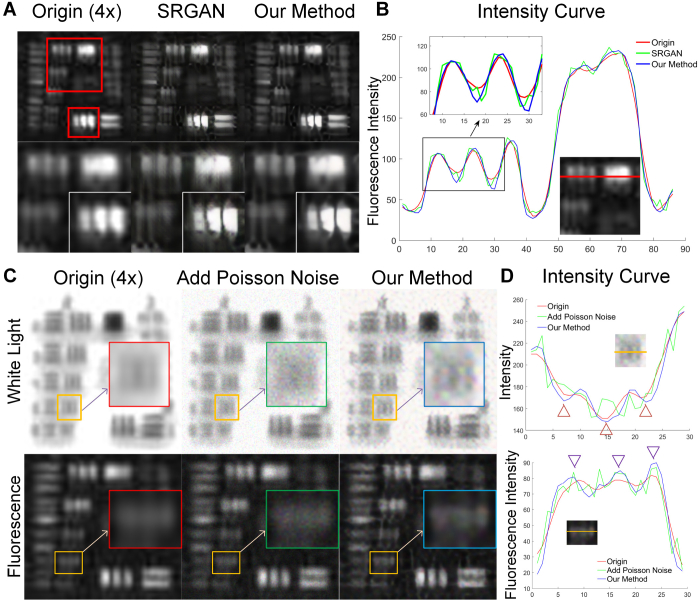
Figure 6(A) shows the fluorescence resolution plate images processed results. The first column is the original image magnified four times of the fluorescence resolution plate and the partial enlargement areas indicated by red boxes. The last two columns are the post-processed images. The image processed with the proposed resolution enhancement method showed clear improvement in the imaging resolution, but the one processed by SRGAN still had the problem of fake textures. The fluorescence intensity curve further shows that our method reduced the fake textures, achieved a balance between the fake details and sharpening, and overall performed better (Fig. 6(B)).
Fig. 6.
Resolution plate tests. (A) Four times magnified NIR fluorescence images of the resolution plate were compared. From left to right: original images, images processed by SRGAN, images processed by our method. Two red frames were enlarged and overlapped in the second row for better comparisons. (B) Fluorescence intensity curves extracted from the red line are plotted and compared for each case. (C) White light and fluorescence images of the noise-affect resolution plate were compared. From left to right: original images, adding Poisson noise images, and Poisson noise images processed by our method. Orange frames were enlarged for better comparisons. (D) Fluorescence intensity curves extracted from the orange line are plotted and compared for each case.
To evaluate the robustness of our method under a noise condition, after the bicubic interpolation, the four times enlarged white light image and the corresponding NIR fluorescence image of the resolution plate were deliberately added with the Poisson noise. Then, the proposed method was applied into the Poisson noise images to enhance the resolution (Fig. 6(C)). The line pairs in each orange frame were further enlarged for comparisons (red, green, and blue frames for the origin, Poisson noise, and processed images, respectively). The originally distinguishable line pairs became unrecognizable after adding Poisson noise. However, our method successfully enhanced the image resolution with sharper edges, and the three lines became recognizable again. Quantitative comparisons of intensity curves were also plotted for white light and fluorescence images, respectively (Fig. 6(D)), which indicates that our method can survive from the interference of Poisson noise and enhanced the image resolution.
3.4. Practical application tests of resolution enhancement
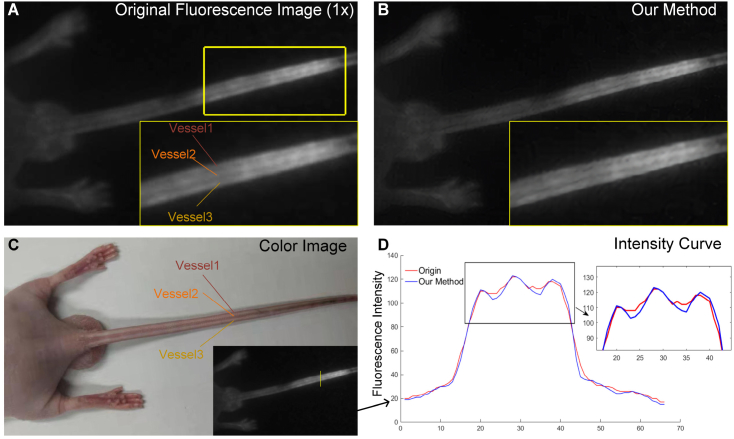
Considering the advantages of our method for resolution enhancement and edge sharpness, we believe that it will be benefit for intraoperative NIR fluorescence imaging. Therefore, we applied this method to the in vivo fluorescence imaging of blood vessels in a mouse tail to further evaluate its performance. A 7-week-old nude mouse was used and the experiment was conducted under the guidelines approved by the Institutional Animal Care and Use Committee at Peking University. It was injected with ICG at a concentration of 0.1 mg/ml through the tail vein immediately before fluorescence imaging. The obtained NIR FI was then processed with our proposed method. Because SRGAN is used for processing images with a small size, it has less benefit for processing such a fluorescent divergent image besides magnifying it. Different from SRGAN, the proposed method has the network structure of first down-sampling and then re-up-scaling the image to the original size. Therefore, it fitted the optical scattering characteristics and provided good results, as shown in Fig. 7 . The contour of the three blood vessels in the mouse tail were blurred and merged into each other in the original NIR FI (Fig. 7(A)). It was not easy for observers to distinguish these vessels by naked eyes. However, our method improved the contrast with much sharper contours of these vessels (Fig. 7(B)). Such resolution enhancement made all three vessels become more recognizable, and their anatomical structure was consistent with the ground truth white light image (Fig. 7(C)). Quantitative comparisons between the original FI and the processed FI also proved that the contrast of the three vessels was improved (Fig. 7(D)).
Fig. 7.
Method validation by in vivo NIR fluorescence imaging of mouse tail vessels. (A) The original fluorescence image of three blood vessels inside the mouse tail. The yellow frame is magnified to indicate the structure of the three vessels. (B) The processed image given by our method. The same area was magnified as in (A). (C) The white light color image of the mouse tail. The three blood vessels can be clearly seen as they are close to the skin surface. (D) The comparison of fluorescence intensity curves at the yellow line indicated in the right bottom of (C).
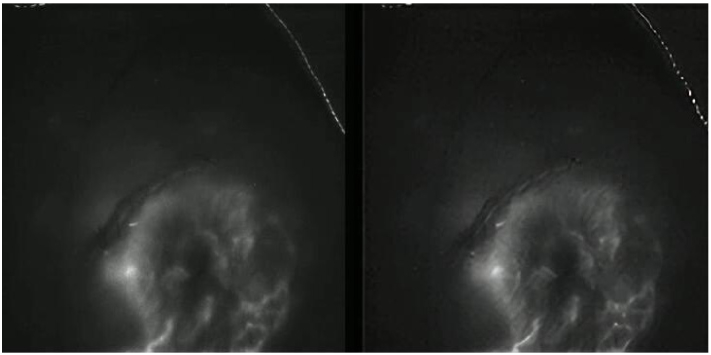
Furthermore, we applied the proposed method to a short video of intraoperative NIR fluorescence imaging acquired during a breast cancer surgery for sentinel lymph node mapping. The results showed that our method successfully processed the pixels video in real time, and the overall resolution of lymph-vessels was enhanced with sharper contours (supplementary video, Fig. 8 ).
Fig. 8.
Supplementary video of NIR fluorescence imaging acquired during a breast cancer surgery for sentinel lymph node mapping, left: original video, right: post-processed video by using our method (see Visualization 1 (2.5MB, avi) ).
4. Conclusions
We presented a GAN-based method that uses the total gradient loss for FI resolution enhancement. This is a post-processing method based on enhancing the resolution of a single image. The total gradient loss acts as a constraint to approximate the gradient of the generated image to that of the original image. Our results suggest that our method provides a better performance with fewer fake textures than SRGAN. However, the problem of generating false features still exists, which is caused by the hallucinations of the networks. New methods need to be investigated to further minimize false features after such resolution enhancement, which we will carry on in future studies. In contrast with SRGAN, which directly processes the down-sampled images, our method re-up-scales images to simulate photon scattering in thick tissues. The results for the resolution plates, the original FI of the blood vessels in mouse tail and the original video of intraoperative NIR fluorescence imaging further illustrated the applicability of the proposed method in actual fluorescence imaging for resolution enhancement. For pixels video, the output frame per second rate for the proposed method is 5 fps under the experimental environment in this study. In this study, we only used the scaling factor, which limited the best performance that could be obtained in various imaging situations. Future research can focus on adding a scaling factor estimation procedure based on the actual imaging situation to achieve an adaptive resolution enhancement effect for the image processing.
Acknowledgments
Thank Xiaojing Shi, Xiaocheng Wu, Meishan Cai and Lisheng Zhan for assistance with the animal handling, Yamin Mao, Hui Meng and Yuan Gao for helpful discussion.
Funding
Ministry of Science and Technology of the People’s Republic of China10.13039/501100002855 (2017YFA0205200, 2015CB755500, 2016YFC0103803, 2018YFC0910602); National Natural Science Foundation of China10.13039/501100001809 (61671449, 81227901, 81527805); Chinese Academy of Sciences10.13039/501100002367 (GJJSTD20170004, KFJ-STS-ZDTP-059, QYZDJ-SSW-JSC005, XDBS01030200, YJKYYQ20180048).
Disclosures
The authors declare that there are no conflicts of interest related to this article.
References
- 1.Frangioni J. V., “In vivo near-infrared fluorescence imaging,” Curr. Opin. Chem. Biol. 7(5), 626–634 (2003). 10.1016/j.cbpa.2003.08.007 [DOI] [PubMed] [Google Scholar]
- 2.Mieog J. S. D., Troyan S. L., Hutteman M., Donohoe K. J., Van Der Vorst J. R., Stockdale A., Liefers G.-J., Choi H. S., Gibbs-Strauss S. L., Putter H., “Toward optimization of imaging system and lymphatic tracer for near-infrared fluorescent sentinel lymph node mapping in breast cancer,” Ann. Surg. Oncol. 18(9), 2483–2491 (2011). 10.1245/s10434-011-1566-x [DOI] [PMC free article] [PubMed] [Google Scholar]
- 3.Tipirneni K. E., Warram J. M., Moore L. S., Prince A. C., de Boer E., Jani A. H., Wapnir I. L., Liao J. C., Bouvet M., Behnke N. K., “Oncologic procedures amenable to fluorescence-guided surgery,” Ann. Surg. 266(1), 36–47 (2017). 10.1097/SLA.0000000000002127 [DOI] [PMC free article] [PubMed] [Google Scholar]
- 4.Vahrmeijer A. L., Hutteman M., Van Der Vorst J. R., Van De Velde C. J., Frangioni J. V., “Image-guided cancer surgery using near-infrared fluorescence,” Nat. Rev. Clin. Oncol. 10(9), 507–518 (2013). 10.1038/nrclinonc.2013.123 [DOI] [PMC free article] [PubMed] [Google Scholar]
- 5.Troyan S. L., Kianzad V., Gibbs-Strauss S. L., Gioux S., Matsui A., Oketokoun R., Ngo L., Khamene A., Azar F., Frangioni J. V., “The FLARE™ intraoperative near-infrared fluorescence imaging system: a first-in-human clinical trial in breast cancer sentinel lymph node mapping,” Ann. Surg. Oncol. 16(10), 2943–2952 (2009). 10.1245/s10434-009-0594-2 [DOI] [PMC free article] [PubMed] [Google Scholar]
- 6.Soltesz E. G., Kim S., Laurence R. G., DeGrand A. M., Parungo C. P., Dor D. M., Cohn L. H., Bawendi M. G., Frangioni J. V., Mihaljevic T., “Intraoperative sentinel lymph node mapping of the lung using near-infrared fluorescent quantum dots,” Ann. Thorac. Surg. 79(1), 269–277 (2005). 10.1016/j.athoracsur.2004.06.055 [DOI] [PMC free article] [PubMed] [Google Scholar]
- 7.Hyun H., Park M. H., Owens E. A., Wada H., Henary M., Handgraaf H. J., Vahrmeijer A. L., Frangioni J. V., Choi H. S., “Structure-inherent targeting of near-infrared fluorophores for parathyroid and thyroid gland imaging,” Nat. Med. 21(2), 192–197 (2015). 10.1038/nm.3728 [DOI] [PMC free article] [PubMed] [Google Scholar]
- 8.Ashitate Y., Stockdale A., Choi H. S., Laurence R. G., Frangioni J. V., “Real-time simultaneous near-infrared fluorescence imaging of bile duct and arterial anatomy,” J. Surg. Res. 176(1), 7–13 (2012). 10.1016/j.jss.2011.06.027 [DOI] [PMC free article] [PubMed] [Google Scholar]
- 9.Jang B., Park J.-Y., Tung C.-H., Kim I.-H., Choi Y., “Gold nanorod− photosensitizer complex for near-infrared fluorescence imaging and photodynamic/photothermal therapy in vivo,” ACS Nano 5(2), 1086–1094 (2011). 10.1021/nn102722z [DOI] [PubMed] [Google Scholar]
- 10.Swartling J., Pifferi A., Enejder A. M., Andersson-Engels S., “Accelerated Monte Carlo models to simulate fluorescence spectra from layered tissues,” J. Opt. Soc. Am. A 20(4), 714–727 (2003). 10.1364/JOSAA.20.000714 [DOI] [PubMed] [Google Scholar]
- 11.Haedicke K., Kozlova D., Gräfe S., Teichgräber U., Epple M., Hilger I., “Multifunctional calcium phosphate nanoparticles for combining near-infrared fluorescence imaging and photodynamic therapy,” Acta Biomater. 14, 197–207 (2015). 10.1016/j.actbio.2014.12.009 [DOI] [PubMed] [Google Scholar]
- 12.Chen B., Feng G., He B., Goh C., Xu S., Ramos-Ortiz G., Aparicio-Ixta L., Zhou J., Ng L., Zhao Z., “Silole-Based Red Fluorescent Organic Dots for Bright Two-Photon Fluorescence In vitro Cell and In vivo Blood Vessel Imaging,” Small 12(6), 782–792 (2016). 10.1002/smll.201502822 [DOI] [PubMed] [Google Scholar]
- 13.He K., Zhou J., Yang F., Chi C., Li H., Mao Y., Hui B., Wang K., Tian J., Wang J., “Near-infrared intraoperative imaging of thoracic sympathetic nerves: from preclinical study to clinical trial,” Theranostics 8(2), 304–313 (2018). 10.7150/thno.22369 [DOI] [PMC free article] [PubMed] [Google Scholar]
- 14.Zdankowski P., McGloin D., Swedlow J. R., “Full volume super-resolution imaging of thick mitotic spindle using 3D AO STED microscope,” Biomed. Opt. Express 10(4), 1999–2009 (2019). 10.1364/BOE.10.001999 [DOI] [PMC free article] [PubMed] [Google Scholar]
- 15.Wang H., Rivenson Y., Jin Y., Wei Z., Gao R., Günaydın H., Bentolila L. A., Kural C., Ozcan A., “Deep learning enables cross-modality super-resolution in fluorescence microscopy,” Nat. Methods 16(1), 103–110 (2019). 10.1038/s41592-018-0239-0 [DOI] [PMC free article] [PubMed] [Google Scholar]
- 16.DSouza A. V., Lin H., Henderson E. R., Samkoe K. S., Pogue B. W., “Review of fluorescence guided surgery systems: identification of key performance capabilities beyond indocyanine green imaging,” J. Biomed. Opt. 21(8), 080901 (2016). 10.1117/1.JBO.21.8.080901 [DOI] [PMC free article] [PubMed] [Google Scholar]
- 17.Nishino H., Hatano E., Seo S., Nitta T., Saito T., Nakamura M., Hattori K., Takatani M., Fuji H., Taura K., “Real-time navigation for liver surgery using projection mapping with indocyanine green fluorescence: development of the novel medical imaging projection system,” Ann. Surg. 267(6), 1134–1140 (2018). 10.1097/SLA.0000000000002172 [DOI] [PubMed] [Google Scholar]
- 18.van Oosterom M. N., den Houting D. A., van de Velde C. J., van Leeuwen F. W., “Navigating surgical fluorescence cameras using near-infrared optical tracking,” J. Biomed. Opt. 23(05), 1 (2018). 10.1117/1.JBO.23.5.056003 [DOI] [PubMed] [Google Scholar]
- 19.Dong C., Loy C. C., He K., Tang X., “Image super-resolution using deep convolutional networks,” IEEE Trans. Pattern Anal. Mach. Intell. 38(2), 295–307 (2016). 10.1109/TPAMI.2015.2439281 [DOI] [PubMed] [Google Scholar]
- 20.Kim J., Kwon Lee J., Mu Lee K., “Accurate image super-resolution using very deep convolutional networks,” in Proceedings of the IEEE conference on computer vision and pattern recognition, 2016, 1646–1654. [Google Scholar]
- 21.Wang Z., Liu D., Yang J., Han W., Huang T., “Deep networks for image super-resolution with sparse prior,” in Proceedings of the IEEE international conference on computer vision, 2015, 370–378. [Google Scholar]
- 22.Lim B., Son S., Kim H., Nah S., Mu Lee K., “Enhanced deep residual networks for single image super-resolution,” in Proceedings of the IEEE Conference on Computer Vision and Pattern Recognition Workshops, 2017, 136–144. [Google Scholar]
- 23.Kim J., Kwon Lee J., Mu Lee K., “Deeply-recursive convolutional network for image super-resolution,” in Proceedings of the IEEE conference on computer vision and pattern recognition, 2016, 1637–1645. [Google Scholar]
- 24.Lai W.-S., Huang J.-B., Ahuja N., Yang M.-H., “Deep laplacian pyramid networks for fast and accurate super-resolution,” in Proceedings of the IEEE conference on computer vision and pattern recognition, 2017, 624–632. [Google Scholar]
- 25.Ledig C., Theis L., Huszár F., Caballero J., Cunningham A., Acosta A., Aitken A., Tejani A., Totz J., Wang Z., “Photo-realistic single image super-resolution using a generative adversarial network,” in Proceedings of the IEEE conference on computer vision and pattern recognition, 2017, 4681–4690. [Google Scholar]
- 26.Li Y., Xu F., Zhang F., Xu P., Zhang M., Fan M., Li L., Gao X., Han R., “Dlbi: deep learning guided bayesian inference for structure reconstruction of super-resolution fluorescence microscopy,” Bioinformatics 34(13), i284–i294 (2018). 10.1093/bioinformatics/bty241 [DOI] [PMC free article] [PubMed] [Google Scholar]
- 27.Stijn K., Van Driel P. B. A. A., Snoeks T. J. A., Kerrebijn J. D. F., Baatenburg De Jong R. J., Vahrmeijer A. L., Sterenborg H. J. C. M., Löwik C. W. G. M., “Optical image-guided cancer surgery: challenges and limitations,” Clin. Cancer Res. 19(14), 3745–3754 (2013). 10.1158/1078-0432.CCR-12-3598 [DOI] [PubMed] [Google Scholar]
- 28.Patterson M. S., Wilson B. C., Wyman D. R., “The propagation of optical radiation in tissue. II: Optical properties of tissues and resulting fluence distributions,” Laser Med Sci 6(4), 379–390 (1991). 10.1007/BF02042460 [DOI] [Google Scholar]
- 29.Leblond F., Davis S. C., Valdés P. A., Pogue B. W., “Pre-clinical whole-body fluorescence imaging: Review of instruments, methods and applications,” J. Photochem. Photobiol., B 98(1), 77–94 (2010). 10.1016/j.jphotobiol.2009.11.007 [DOI] [PMC free article] [PubMed] [Google Scholar]
- 30.Sylvain G., Hak Soo C., Frangioni J. V., “Image-guided surgery using invisible near-infrared light: fundamentals of clinical translation,” Molecular Imaging 9, 237–255 (2010). [PMC free article] [PubMed] [Google Scholar]
- 31.Arici T., Dikbas S., Altunbasak Y., “A histogram modification framework and its application for image contrast enhancement,” IEEE Trans. on Image Process. 18(9), 1921–1935 (2009). 10.1109/TIP.2009.2021548 [DOI] [PubMed] [Google Scholar]
- 32.Chang Y.-C., Chang C.-M., Lai L.-C., Chen L.-H., “Contrast enhancement with considering visual effects based on gray-level grouping,” Journal of Marine Science and Technology (2014). [Google Scholar]
- 33.Goodfellow I., Pouget-Abadie J., Mirza M., Xu B., Warde-Farley D., Ozair S., Courville A., Bengio Y., “Generative adversarial nets,” in Advances in neural information processing systems, 2014, 2672–2680. [Google Scholar]
- 34.Simonyan K., Zisserman A., “Very deep convolutional networks for large-scale image recognition,” arXiv preprint arXiv:1409.1556 (2014).
- 35.Arjovsky M., Chintala S., Bottou L., “Wasserstein generative adversarial networks,” in International Conference on Machine Learning, 2017, 214–223. [Google Scholar]
- 36.Gulrajani I., Ahmed F., Arjovsky M., Dumoulin V., Courville A. C., “Improved training of wasserstein gans,” in Advances in Neural Information Processing Systems, 2017, 5767–5777. [Google Scholar]
- 37.Mao X., Li Q., Xie H., Lau R. Y., Wang Z., Paul Smolley S., “Least squares generative adversarial networks,” in Proceedings of the IEEE International Conference on Computer Vision, 2017, 2794–2802. [Google Scholar]
- 38.Radford A., Metz L., Chintala S., “Unsupervised representation learning with deep convolutional generative adversarial networks,” arXiv preprint arXiv:1511.06434 (2015).
- 39.Qi G.-J., “Loss-sensitive generative adversarial networks on lipschitz densities,” arXiv preprint arXiv:1701.06264 (2017).
- 40.Zhang Y., Tian Y., Kong Y., Zhong B., Fu Y., “Residual dense network for image super-resolution,” in Proceedings of the IEEE Conference on Computer Vision and Pattern Recognition, 2018, 2472–2481. [Google Scholar]
- 41.Miyato T., Kataoka T., Koyama M., Yoshida Y., “Spectral normalization for generative adversarial networks,” arXiv preprint arXiv:1802.05957 (2018).
- 42.Rudin L. I., Osher S., Fatemi E., “Nonlinear total variation based noise removal algorithms,” Phys. D 60(1–4), 259–268 (1992). 10.1016/0167-2789(92)90242-F [DOI] [Google Scholar]
- 43.He K., Zhang X., Ren S., Sun J., “Deep residual learning for image recognition,” in Proceedings of the IEEE conference on computer vision and pattern recognition, 2016, 770–778. [Google Scholar]
- 44.Shi W., Caballero J., Huszár F., Totz J., Aitken A. P., Bishop R., Rueckert D., Wang Z., “Real-time single image and video super-resolution using an efficient sub-pixel convolutional neural network,” in Proceedings of the IEEE conference on computer vision and pattern recognition, 2016, 1874–1883. [Google Scholar]
- 45.Mathieu M., Couprie C., LeCun Y., “Deep multi-scale video prediction beyond mean square error,” arXiv preprint arXiv:1511.05440 (2015).
- 46.Martens J.-B., Meesters L., “Image dissimilarity,” Signal Processing 70(3), 155–176 (1998). 10.1016/S0165-1684(98)00123-6 [DOI] [Google Scholar]
- 47.Wang Z., Bovik A. C., Sheikh H. R., Simoncelli E. P., “Image quality assessment: from error visibility to structural similarity,” IEEE Trans. on Image Process. 13(4), 600–612 (2004). 10.1109/TIP.2003.819861 [DOI] [PubMed] [Google Scholar]
- 48.https://github.com/leftthomas/SRGAN.


