Abstract
We have developed and validated in vivo magnetic resonance imaging (MRI) protocols to extract parameters (T2 and geometry) of the human lens that, combined with biometric measures of the eye and optical modelling, enable us to investigate the relative contributions made by the gradient of refractive index (GRIN) and the shape of the lens to the refractive properties of each subject tested. Seven young and healthy participants (mean age: 25.6 ± 3.6 years) underwent an ophthalmic examination, and two sessions of MRI scans using a 3 T clinical magnet. Our MRI protocols for studying lens physiological optics and geometrical measurements were repeatable and reliable, using both 1D (95% confidence interval (CI) for mean differences for exponents = [-2.1, 2.6]) and 2D analysis (anterior T2 CI for differences [-6.4, 8.1] ms; posterior T2 CI for differences [-6.4, 8.3] ms). The lens thickness measured from MRI showed good correlation with that measured with clinical ‘gold standard’ LenStar (mean differences = [-0.18, 0.2] mm). The predicted refractive errors from ZEMAX had reasonable agreements with participants’ clinic records (mean differences = [-1.7, 1.2] D). Quantitative measurements of lens geometry and GRIN with our MRI technique showed high inter-day repeatability. Our clinical MRI technique also provides reliable measures of lens geometry that are comparable to optical biometry. Finally, our ZEMAX optical models produced accurate refractive error and lens power estimations.
1. Introduction
The optical properties of the crystallin lens are essential contributors to our vision. The lens contributes one-third of the refractive power of the eye, provides accommodative power during near viewing and corrects positive spherical aberration introduced by the cornea [1]. The refractive ability of the lens is determined by its geometry and gradient of refractive index (GRIN), which are established by the lens cellular architecture [1–5]. Experiments using organ-cultured bovine lenses have shown that the lens optical efficacy is altered significantly under various physiological perturbations that alter ionic and fluid homeostasis [6,7], suggesting that the optics of the lens is actively maintained to sustain optimal overall vision quality [1].
Since the optics of the human lens gradually degenerates with ageing, leading to the onset of presbyopia in middle age [8] and ultimately, nuclear cataract in the elderly [9], it has been suggested that this decline may be due to an age-dependent deterioration in the underlying cellular physiology of the lens that maintains ionic and fluid homeostasis. However, the changes in human lens physiology associated with these conditions, and its impacts on the lens optics remain unclear. This is due to the lack of effective methods that can link human lens physiology to the optical properties of the lens. In this study, we present a platform of optimised in vivo magnetic resonance imaging (MRI) protocols in combination with computer modelling as a starting point to bridge this knowledge gap.
MRI occupies a unique position in lens research, as it is a non-invasive, non-destructive modality that is independent of any optical assumptions [6,7,10,11]. T2 is an MRI parameter which measures the transverse relaxation time that quantifies the interactions between water and protein protons (the water-bound protein ratio) [12,13]. The spatial variation of this ratio forms the basis of the lens GRIN [14] and thereby can be estimated from T2 measures. Recent advancements in MRI technology have made it possible to image the lens with reasonable resolution and signal-to-noise ratio (SNR) while keeping scan time short to minimise the effects of eye movement so that that accurate T2 maps can be extracted [15–17]. In addition to lens GRIN, MRI can measure lens geometry including the surface curvatures, conic constants and central thickness, which together with the GRIN allow the optical parameters of the human lens to be calculated (i.e. refractive power, higher order aberrations) [18]. Compared with current clinical technologies such as LenStar, IOLMaster, ultrasonic A-scan, or optical coherence tomography (OCT) [19,20], the non-optical nature of MRI offers a unique advantage to measure all aspects of the lens geometry without concerns of optical distortions [18,21], which is particularly important when studying eyes with significant media opacities, such as cataract.
Our previous research has extensively used MRI and modelling to study physiological optics of animal lenses in vitro in organ culture [6,7,10,11,23]. Here, we report on our first effort to translate and unite the previous methods into the in vivo human lens. This translation is challenging as issues in MRI acquisitions, such as eye fatigue, random motions in participants, and balancing the resolution and SNR; all need to be overcome while keeping the scan duration short for participant comfort. In this study, we first introduce our MRI protocols, then the post-processing framework and optical modelling that are optimised for lens imaging, and finally assess its repeatability. We validated that our MRI imaging and modelling platform can accurately predict the refraction error measured by a standard ophthalmic clinical examination.
2. Methods
2.1. Subject recruitment and clinical examination
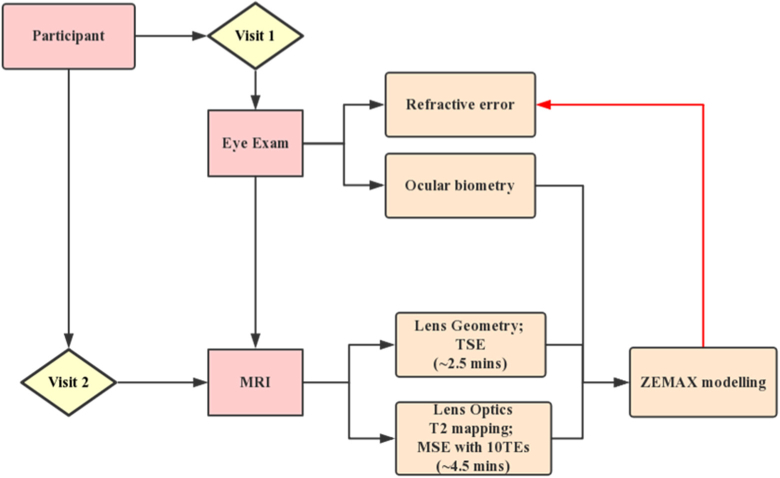
A cohort of seven young adult subjects (3 males, four females, mean age: 25.6 ± 3.6 years) was recruited by advertising at the University of Auckland. Subjects gave written informed consent before participation, and all procedures were approved by the University of Auckland Human Subjects Ethics Committee (UAHPEC #017162). Subjects underwent ophthalmic examination by a qualified optometrist (Fig. 1 ), that consisted of non-cycloplegic subjective refraction, corrected visual acuity measurement and ocular biometry measurements using LenStar (Haag-Streit, USA). An ocular health examination was conducted under pupil dilation (1.0% Tropicamide eye drops) to ensure subjects did not have any ocular diseases that affected best-corrected visual acuity and to confirm that they had not undergone any previous intraocular surgery. Subjects were excluded if they had a refractive error outside a spherical equivalent (SE) of ±6.00 Diopters (D). Subjects who met these criteria were then subjected to a TSE and T2 mapping MSE scans to retrieve lens geometry and GRIN, respectively (Fig. 1).
Fig. 1.
Study design. The flowchart demonstrates the steps involved in our study. Consenting participants came to Auckland University Optometry Clinic on the first visit and underwent an ophthalmic examination. After ensuring participants met all inclusion criteria, they were invited to undertake two sessions of MRI scan. The scan included TSE and MSE pulse sequences for lens geometry and T2 (GRIN) measurements, respectively. The lens geometry and GRIN obtain by MRI were then combined with ocular biometric data acquired using LenStar to build accurate optical models of the right eye of each participant using the optical modelling software ZEMAX. Participants refractive errors predicted from ZEAMX were then compared with that obtained from the clinical examination.
2.2. MRI data acquisition protocols
All imaging sessions were performed at the Center for Advanced MRI (CAMRI) at the University of Auckland, using a 3 T clinical Skyra MRI scanner equipped with a 32-channel head receiver coil (Siemens, Germany). Subjects underwent two MRI scans performed on separate visits that were spaced between 1 to 3 days apart, but which occurred at a similar time of day. During the scan, subjects laid down comfortably inside the MR chamber. A mirror was attached to the receiver coil so they could focus on the reflection of a customised fixation target that was displayed on a screen. The fixation target was a customised cross-hair design [24], that was modified by changing the central target image in the centre of the screen every five seconds. The imaging localizer was positioned at the central lens axis, which was performed carefully by experienced radiologists to ensure the central lens section was captured accurately. Our image protocol consisted of a high-resolution T2 mapping sequence and an anatomical sequence that were 4.5 and 2.5 minutes long, respectively. Time was allowed between the two sequences for subjects to rest their eyes. T2 and anatomical data from both the left and right eye were acquired simultaneously.
T2-mapping sequence - utilized a 2D multiple-spin echo (MSE) sequence with the following parameters: 10 TEs, with an echo spacing of 11.7 ms; TR = 1600 ms; in-plane resolution, 0.21 × 0.21 mm; slice number, 6; slice thickness, 3 mm; parallel imaging with accelerator factor (IPAT) of two.
Anatomical sequence - utilized a turbo spin-echo (TSE) sequence with the following parameters: TR = 2000ms; TE = 116 ms; slice number = 6; slice thickness, 3 mm; IPAT = 2; This sequence is relatively immune to susceptibility artefacts [25] and results in a heavily T2-weighted image where the lens appears dark, and fluid appears bright for easy processing. The voxel size in this mode was 0.2×0.2×3.0 mm.
2.3. Image post-processing
All image post-processing was performed using custom-written code developed in-house using MATLAB (the Math-Works, Inc. Natick, MA, USA). Pixel-wise T2 values were calculated from the exponential fitting of signal intensity, S, to an array of TEs using the equation:
| (1) |
Where is the signal intensity at TE = 0ms; is the noise threshold that was quantified from the image background [26]. Signal intensities at any TEs below the noise threshold were discarded during the fitting routine. This step ensured all fits are un-biased by the noise, especially at lens core that has short T2 values [16]. T2 maps were converted into refractive index maps equivalent to 589 nm wavelength light using the following equation [27]:
| (2) |
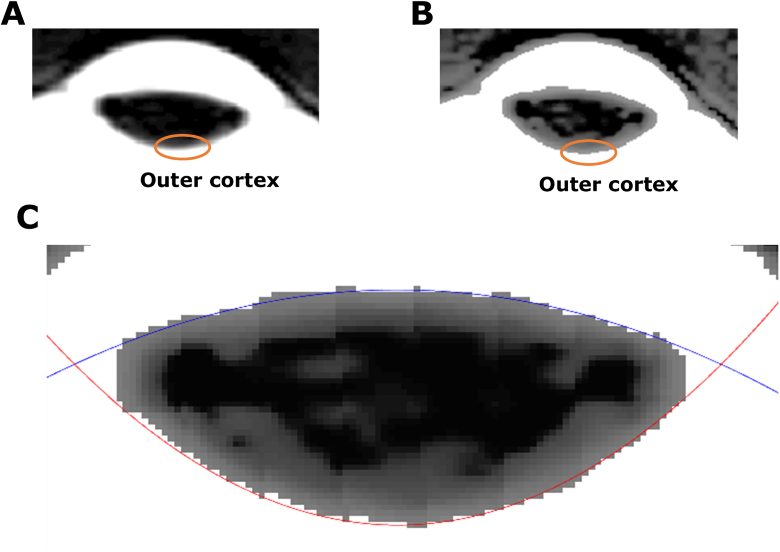
To extract lens geometry from anatomical scans, the image slice that contained the thickest region of the lens was manually selected. This image slice was firstly interpolated three times (spline) (Fig. 2(A) ), and then histogram equalisation [28] was applied to enhance signal intensity in the outer cortex of the lens (Fig. 2(B)). Image segmentation was performed using the grow cut function – an interactive image segmentation tool based on energy minimisation [29]. The only input from users is to interactively sample ten seed points in the foreground (lens), and background ground (fluid) of the MRI image and the lens is then automatically segmented.
Fig. 2.
Extraction of lens geometry from raw MRI images. (A) A cropped raw MRI image of the human eye to show the lens. The orange circle indicates lens outer cortex. (B) Image of the same lens after histogram equalisation has been applied to enhance edge contrast of the lens edge. (C) The anterior (blue curve) and posterior (red curve) surfaces of the enhanced image are then fitted with two conic equations.
After this, the anterior and posterior edge pixels were fitted using the conic equation [30] (Fig. 2(C)):
| (3) |
Where, and are estimated vertices, c is the inverse of the radius of curvature (R) and k is the conic constant. The central lens thickness (Tap) was then calculated as the distance between the vertices of the two curves.
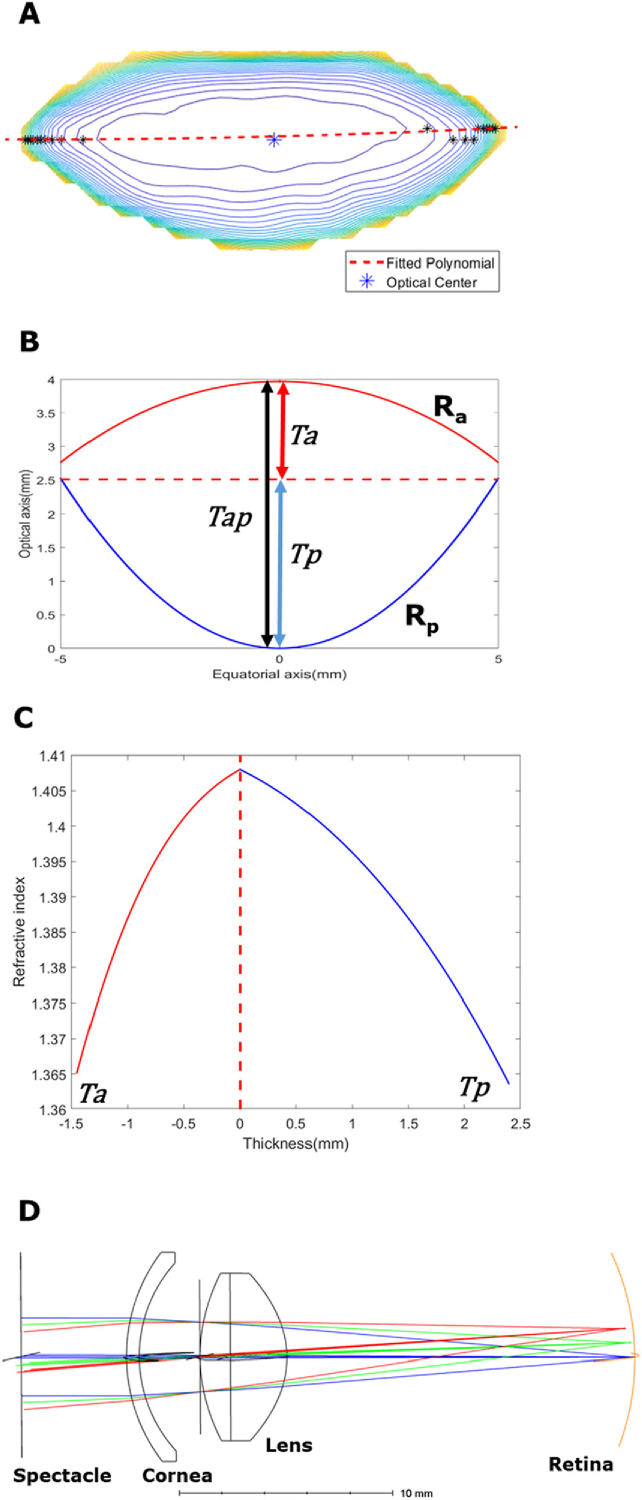
The anterior and posterior hemispheres of the human lens have different radii of curvature [31] and GRIN distributions [32]. Therefore, the anterior and posterior segments of the lens were analysed independently. In order to separate the anterior and posterior hemispheres, we used the concept of an “optical centre” that has been alluded to by previous literature [3]. The contour plot of the T2 map for each lens was generated and connected with a second order polynomial. The centre of this path was deemed as the optical centre and used to calculate anterior (Ta) and posterior lens (Tp) thicknesses, trend analyses and was subsequently used in ZEMAX modelling.
2.4. ZEMAX modelling
Personalized eye models were constructed using ZEMAX software (Development Corp., San Diego, CA, USA) combining both subject-specific ocular biometry data (average cornea radius of curvature, corneal thickness, anterior chamber depth and axial length) measured by LenStar, and lens geometry and GRIN distributions extracted from MRI scans of the right eye of each subject during their first visit. The refractive indices of the cornea and the two chamber humour were taken as 1.37 and 1.33 [33]. The lens was modelled as doublet design, that consisted of two GRIN surfaces (anterior/posterior) combined. The boundary between these two surfaces is set as the plane of the “optical centre”. The surface was chosen as a “Gradient 3” model in ZEMAX that formulates rotational symmetry of GRIN distribution [34], similar to the lens GRIN pattern reported in the literature for young lenses [20,27]. The respective anterior and posterior lens geometry and GRIN profiles were input into these two surfaces. The other ocular components were modelled with standard surfaces in ZEMAX. Moreover, the customized eye model was created using a pupil diameter of 4 mm, polychromatic light source (wavelengths = 486, 587 and 656 nm) and field weighting of 0° = 100%, 2.5° = 40% and 5° = 20% [35]. A dummy surface was then added in front of the individualised model of the eye that simulate a spectacle for correction. The radius of curvature of this corrective spectacle was then automatically optimised by ZEMAX for the best focus of the system. The optical power of this surface is then the best correction for this eye (i.e. its refractive error).
To calculate the power of the ocular lens, other surfaces (i.e. calculated corrective spectacles and the cornea) were firstly deactivated in ZEMAX, leaving the lens as the sole optical element in the model. The focal length of this system was then found by ZEAMX using ray tracing, and the dioptric power was reported by the power filed map function in ZEMAX. The spherical aberrations of this system were calculated by ZEMAX in the form of fourth order of Zernike coefficient (, µm).
To compare with the lens power estimated by ZEMAX, a modified Bennet method was used to calculate the lens equivalent power [36]:
| (4) |
| (5) |
Where n is the refractive index of fluid media (1.33), K is the cornea power, ACD is the aqueous chamber depth, VCD is the vitreous chamber depth, is the refractive power at the cornea vertex estimated from one’s spherical equivalent error. and are customized coefficients derived from [36]. It is recommended by authors that the modified Bennet method is the best to calculate equivalent lens power if the lens thickness is known (available from LenStar measurement) [36].
2.5. Statistical analysis
Pearson correlation analysis, paired t-test and Bland-Altman plots were used to assess the inter-day repeatability of MRI measurements, as well as the accuracy of lens geometry obtained by MRI. Within-subject coefficients of variation (CV) were also calculated from the standard deviation and the mean values. All analyses were done with MATLAB with a significance level of 5%.
3. Results
The application of MRI to measure the optical properties of the human eye in vivo is challenging since issues such as eye fatigue and random motion in subjects need to be overcome. These effects can be partially offset by keeping the scan duration as short as possible to maximise subject comfort during the scan. This, in turn, requires balancing scan resolution and signal to noise ratio against scan duration. To illustrate how this was achieved, in this section, we first use the data obtained from one subject to optimise our MRI scan protocols, the post-processing framework used to extract lens geometry and GRIN, and the optical modelling to simulate refractive error so it could be compared to that obtained using a standard clinical examination. Then, we assess the accuracy of our measurements by repeating them on a different day on a cohort of seven participants.
3.1. Representative data from a single subject
Data obtained from a representative participant (age = 27 years) is presented first. Biometric data obtained from the LenStar for this subject gave an average cornea radius of 7.80 mm, a corneal thickness of 0.554 mm, an anterior chamber depth of 2.83 mm, and an axial length of 23.35 mm. The refractive error for this subject was assessed by an optometrist as 0D.
A raw image of the lens obtained from the initial geometric scan (Fig. 2(A)) was enhanced by histogram equalization (Fig. 2(B)), and fitted with the aspherical equation (Eq. (3); Fig. 2(C)) to calculate the anterior (Ra = -10.93 mm), posterior (Rp = -4.94 mm) radii of curvature and lens thickness (Tap = 3.87 mm). Next, the T2 mapping scan was performed to calculate the GRIN. This sequence consisted of several nominated TEs (Fig. 3A ), which were then post-processed with noise-unbiased fitting (Fig. 3(B)) to generate pixel-wise T2 lens maps (Fig. 3(C)). The resultant T2 map was then converted into GRIN map using Eq. (2) (Fig. 3(D)).
Fig. 3.
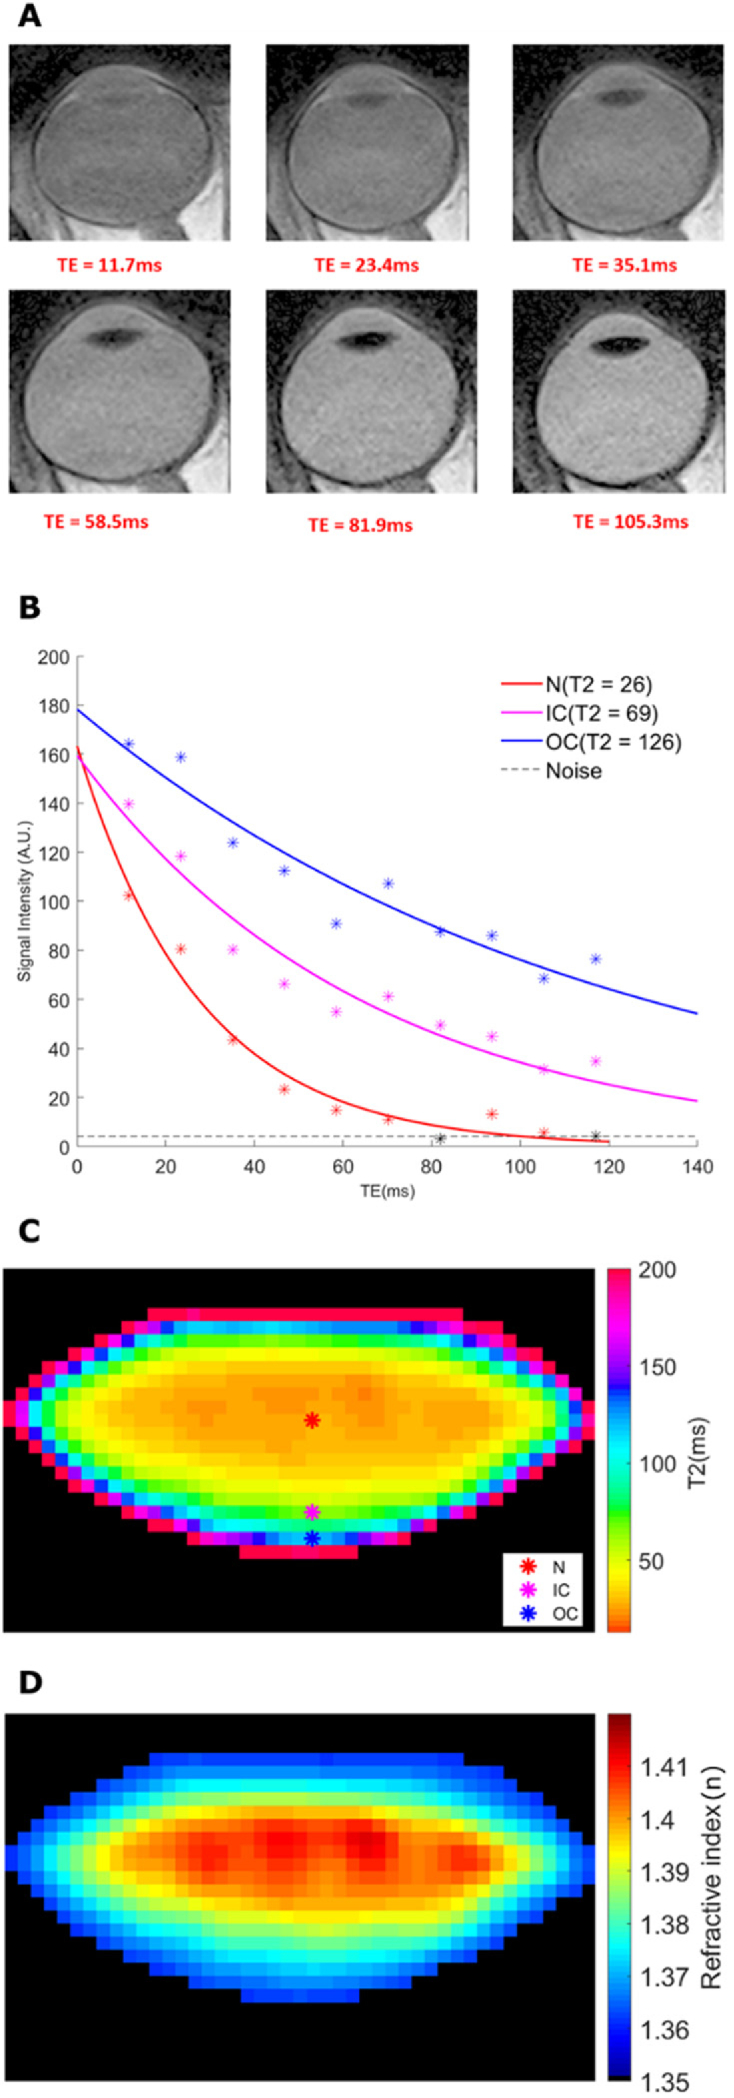
T2 imaging of the lens to extract the GRIN. (A) A sequence of 6 representative MSE images obtained using different TEs. Six representative nominal TE selected from the all images were presented here. (B) Three pixels were labelled to represent three lens regions (nucleus, inner cortex and outer cortex), and their exponential curves were displayed. The lens tissue from these three regions have different relaxation behaviour and thus, different T2 values. (C) Raw T2 images are then processed to generate T2 maps of the lens. Coloured markers on the lens mark the same regions used for curve fitting process in panel (B). (D) T2 values were converted to refractive index values (n) to produce a GRIN map.
The next step was to input the extracted data on lens geometry and GRIN into a format that was compatible with the ZEMAX software to construct an optical model of each subject’s eye. To achieve this, we modelled the anterior and posterior of the lens as two separate optical surfaces. Rather than simply splitting the lens through its equatorial plane, we first defined the optical centre of the lens as being the region of highest refractive index to avoid GRIN discontinuity across the equatorial plane. In order to locate this boundary, the GRIN map was converted into a contour map, and the vertices of each contour were connected by a fitted polynomial, and the central point of the fit was defined as the “optical centre” (Fig. 4(A) ). The sagittal plane including the optical centre was then used to split the lens into an anterior (Ta = 1.46 mm) and posterior (Tp = 2.41 mm) thickness (Fig. 4(B)), and the GRIN map into anterior and posterior profiles (Fig. 4(C)). The thickness and GRIN profiles of the lens anterior and posterior hemispheres were then inputted into ZEMAX with two GRIN 3 surfaces and together with the clinical biometric measurements detailed above, and used to create a personalised optical model of the subject’s right eye (Fig. 4(D)). From this model, lens power (21.64D) and spherical aberration (0.13μm) were calculated, while the spherical equivalent error of the whole eye was -0.27D. This compares well with 0D measured clinically for spherical equivalent error, 22.29D for lens power calculated using the Bennett method [36].
Fig. 4.
Formation of participant-specific optics of the human eye. (A) The anatomical image is matched to the T2/GRIN image of the same lens, and the optical centre (dotted red line) is marked as the centre of connecting all vertices of contour (black *). This connected path is used to separate the lens anterior and posterior sections. (B) Geometrical parameters of the lens include anterior radius and thickness (Ra and Ta), posterior radius and thickness (Rp and Tp) and full lens thickness (Tap). (C) Sagittal GRIN profiles taken from the GRIN maps are fitted into ZEMAX GRIN3 formula. The optical centre is used to split GRIN profiles to avoid discontinuity. (D) Schematic drawing of the eye model in ZEMAX combining respective geometry and GRIN. The lens is modelled as a doublet split around the optical centre into anterior and posterior surfaces. The spectacle surface was used to estimate the spherical equivalent error.
3.2. Accuracy and repeatability of the measurements – average data from a cohort of young subjects
3.2.1. Lens geometry
To test for the accuracy and repeatability of our MRI-based imaging protocols, the workflow outlined above for a single representative subject was applied to an extended cohort of seven young subjects (mean age = 25.6 years).
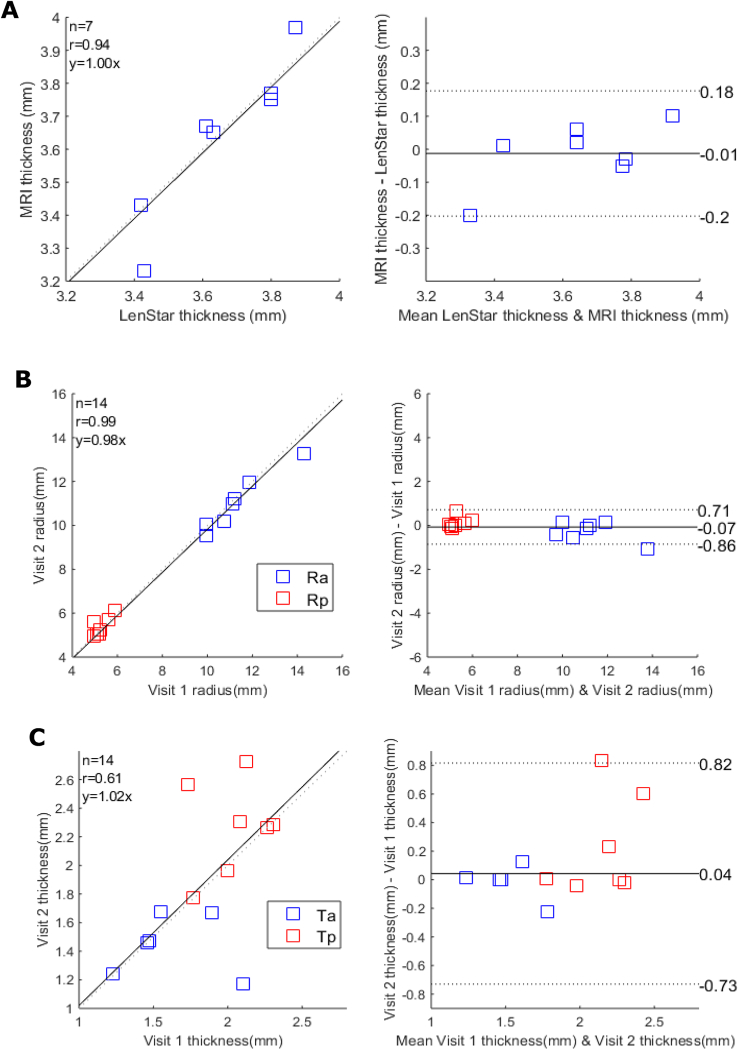
To test the accuracy of our MRI-based measurement of lens geometry, we first compared lens thickness extracted from in vivo MRI images with the results obtained using LenStar (Fig. 5(A) ). This showed a strong correlation between both modalities ( = 0.93, p < 0.05), and no statistically significant differences in lens thickness obtained from the two imaging modalities (95% CI of difference [-0.20, 0.18], p = 0.74, CV = 2.7%).
Fig. 5.
Accuracy and repeatability of measurements of lens geometry. (A) Correlation plot (left panel) comparing the measurements of lens thicknesses obtained from MRI and LenStar, and the two methods were assessed by Bland & Altman equity plot right panel confirming that the two techniques gave measures of lens thickness that lay within the 95% confidence limits (dashed lines). (B&C) Correlation plots (left panels) comparing the measurements lens radius (B: Ra blue; Rp red) and thickness (C: Ta blue; Tp red) taken at the first and second visit for each participant and the associated Bland & Altman equity plots (right panels).
Repeatability of the MRI measurements was then tested by recalling the subject for a second scan within three days of and at the same time of the day as the initial scan. The paired-tests (each eye to itself) reveal no significant differences between the anterior/posterior radii of curvature (Fig. 5(B), p = 0.50, 95% CI for mean of difference [-0.86, 0.71], CV = 4.9%), or lens thicknesses (Fig. 5(C), p = 0.69, 95% CI for mean of difference [-0.73, 0.83], CV = 21%) between the two visits.
3.2.2. Lens T2 measurements
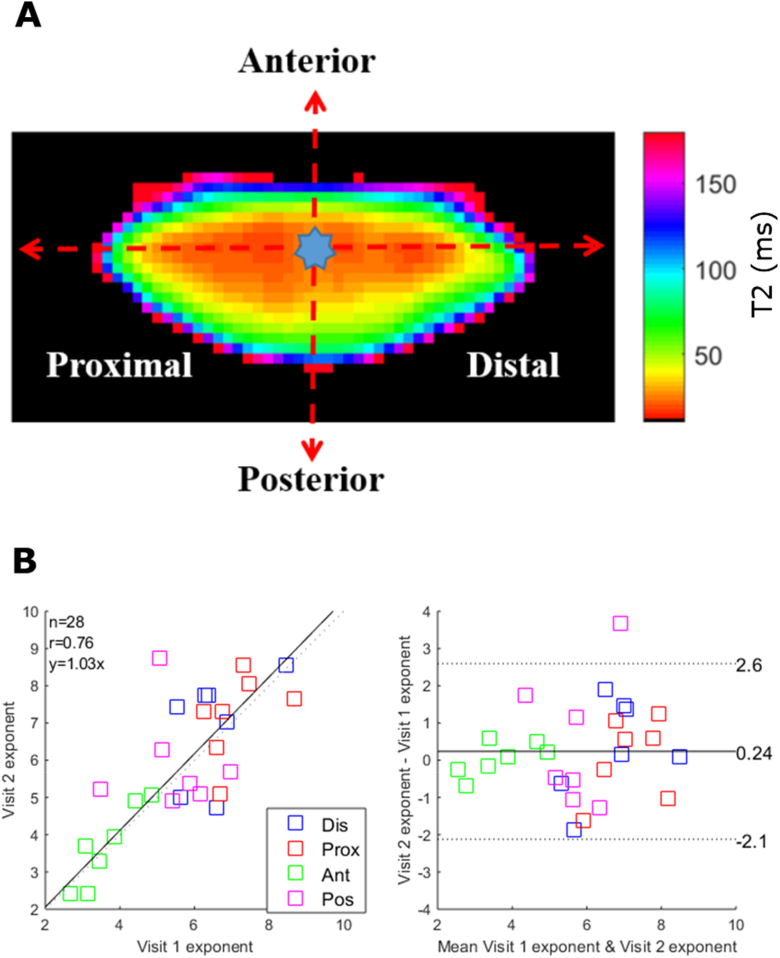
To assess the repeatability of the T2 maps, we introduced two different methods to quantify the T2 measurements in different regions of the lens to facilitate the comparison. The first approach utilised T2 line profiles obtained along either the equatorial or optical axis from the optical centre towards the periphery of the lens (Fig. 6(A) ). This produced four separate profiles that were fitted with a power function [27,32]:
| (6) |
In this function, a is the offset, b is the difference between maxima and minima and c is the exponent that describes the slope of the fitted equation and is the most critical parameter to quantify the transition within the map. The exponents pooled from all four directions were shown to be not statistically different between two visits (Fig. 6(B), p = 0.31, 95% CI of mean differences: [-2.1, 2.6]). The equity plot showed a reasonable correlation between two visits ( = 0.76, p < 0.05), and within subject CV of 21%.
Fig. 6.
Trend analysis and repeatability of T2 measurements. (A) T2 map showing the optical centre from which line plots were extracted along the anterior, posterior, proximal and distal axes. (B) The extracted line plots along each axis were fitted with Eq. (4) and the exponents c from the first and second visit were displayed on a correlation (left panel) and Bland-Altman equity (right panel) plots to assess inter-day repeatability. In the correlation plot, the black line shows the unity line. The 95% limit of agreement is indicated as two dash lines.
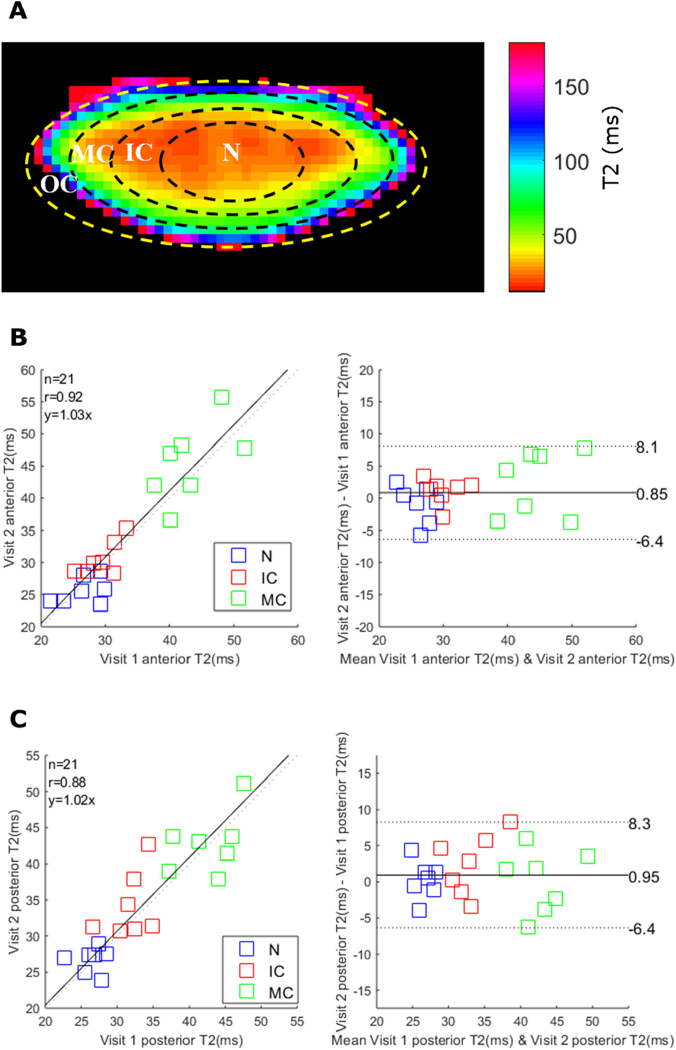
The second approach was to compare an average of T2 measurements from different regions of the lens on different days. Four regions of interest (ROI) were defined as the lens nucleus (N, r/a < 0.4), inner cortex (IC, 0.4 < r/a < 0.6), middle cortex (MC, 0.6 < r/a < 0.85) and outer cortex (OC, 0.85 < r/a < 1.0) (Fig. 7(A) ) [37].
Fig. 7.
Anterior and posterior lens T2 measurements and repeatability. (A) A representative T2 map divided into eight regions of interest that represent the outer cortex (OC), middle cortex (MC), inner cortex (IC) and nucleus (N) of the anterior and posterior sections of the lens. Due to the partial volume effect and “non-lens” pixels, the OC region was excluded in this analysis. (B&C) The inter-day repeatability of anterior (B) and posterior (C) sections were analyzed by correlation plot (left panel) and Bland-Altman analysis (right panel). The 95% limit of agreements are indicated as two dash lines.
Because of the automatic process, the OC region was generated in a way that included some regions visibly outside of the lens. Also, the partial volume effects of surrounding fluids could influence the accuracy within this region. Therefore, we excluded the OC from our analysis. The ROIs were customised-ellipses with the lens equatorial diameter as the major axis and with the defined fractions of anterior/posterior thicknesses used the minor axes.
For this analysis (Fig. 7(B) & (C)), the mean T2 values were not statistically different between two visits for the three anterior lens regions (p = 0.30, 95% CI for mean difference [-6.4, 8.1]) and three posterior regions (p = 0.26, 95% CI for mean difference [-6.4, 8.3]). The equity plot revealed a strong correlations for both the anterior ( = 0.92, CV = 11%, p < 0.05) and posterior regions ( = 0.88, CV = 11%, p < 0.05). It was noted that T2 values increased from the lens center towards the periphery, which agrees with the lens physiological pattern [6,11].
3.2.3. The optical performance of the lens
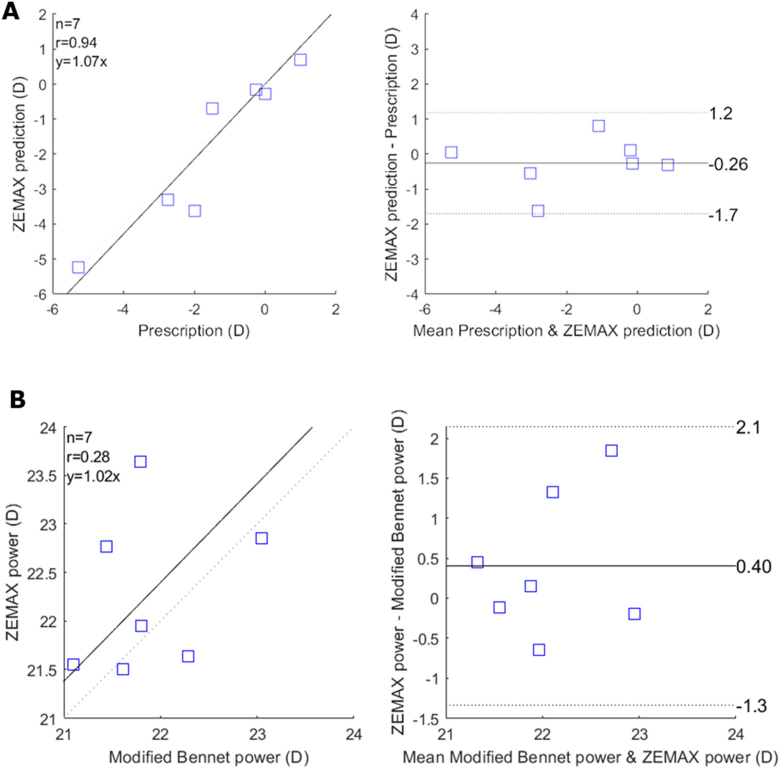
All optical parameters simulated from ZEMAX are recorded in Table 1 . For most of the imaged eyes, the ZEMAX model could accurately calculate a participant’s spherical equivalent errors (p-value = 0.45, CI for the mean difference: [-1.6, 1.2]) (Fig. 8 ). Due to the viewing distance of 2.1 m in the MRI room, a difference of -0.45D from our modelling approach and the clinical record is expected and reasonable. There were two cases with large discrepancies between ZEMAX calculation and the clinical measurement. The mean optical power (D) estimated from our model was 22.27 ± 0.71D and was not significantly different to that obtained from the modified Bennet method (p-value = 0.23, CI for the mean difference: [-1.3,2.1]). The mean spherical aberration) were 0.03 ± 0.13 µm.
Table 1. Summary of the optical measurements from ZEMAX modelling.
| Participant | Age | Refractive errors | ZEMAX prediction | Prediction error | Lens power (modified Bennet) | Lens power from zemax (D) | Spherical Aberration (µm) |
|---|---|---|---|---|---|---|---|
| 1 | 24 | -5.25 | -5.27 | 0.02 | 21.80 | 21.95 | -0.03 |
| 2 | 27 | 0.00 | -0.27 | -0.27 | 22.29 | 21.64 | 0.13 |
| 3* | 24 | -1.50 | -0.70 | -0.80 | 21.61 | 21.50 | 0.05 |
| 4 | 33 | 0.75 | 0.70 | 0.05 | 21.44 | 22.37 | 0.07 |
| 5 | 22 | -0.25 | -0.15 | 0.10 | 23.04 | 22.85 | -0.07 |
| 6 | 22 | -2.75 | -3.25 | 0.50 | 21.10 | 21.55 | -0.06 |
| 7* | 27 | -2.00 | -3.62 | 1.62 | 21.79 | 23.64 | -0.09 |
Fig. 8.
ZEMAX modelling of the eye accurately predicts the refractive error. (A) Correlation plot (left panel), and Bland & Altman analysis (right panel) show that the ZEMAX model can predict the spherical equivalent error measured clinically for each participant. (B) Correlation plot and Bland (left panel) & Altman analysis (right panel) show that our methods can estimate lens power with comparable results with the lens power obtained from the modified Bennet method. The black line indicates the equity plot and the dashed lines indicate the 95% limit of agreements.
4. Discussion
This work is our first step towards translating our previously published in vitro ocular MRI studies performed on animal lenses into human lenses in vivo. In our study, seven young participants were recruited and scanned on two different days. First, we demonstrated the accuracy and repeatability of our MRI measurements. Next, parameters of ocular biometry (LenStar) and lens GRIN and geometry (MRI) were extracted and then used to create customised eye models in ZEMAX for each participant. These optical simulations derived from these models showed good agreement with clinical measurements of refractive error obtained for each participant from a standard clinical examination.
Our present MRI and ZEMAX derived results were in broad agreement with the limited literature available in this field. T2 results are consistent with published in vivo studies, where T2 values range from 25 ms in the nucleus to 96 ms in the outer cortex of the human lens, and correspond to refractive indices of 1.365 and 1.408, respectively [32,38]. While a previous study compared the accuracy of lens thickness values obtained from MRI and A-scan ultrasound [18], in our study, the MRI measured lens thickness correlated well with the LenStar (Fig. 5), that is considered as the gold-standard for ocular biometry. The lens power estimated from our ZEMAX modelling (22.27 ± 0.71D) here, was within the range of the published studies with a variety of lens power methods [36]. Finally, our reported spherical aberrations () agree with a recent study by Ke and colleagues [38]. It is noted that the spherical aberrations alternate between positive and negative sign among individuals [39,40].
One of the problems to analyse the lens data reliably is the difficulty associated with locating the boundary between the lens anterior and posterior hemispheres accurately and repeatedly. Current approaches include splitting the lens through the longest equatorial axis [32] or directly halving the lens thickness [41]. In this study, the concept of “optical centre” was introduced, which we believe offers a more accurate location relative to the previously published methods. The idea of a lens “optical centre” was extended from studies that investigated the contours of the GRIN [20,30], where the authors suggested that the actual lens equatorial axis is not necessarily central at the longest axis, but follows a curved path. In our study, we observed that for young lenses, the optical centre plane almost coincided with the equatorial plane and was not as curved. However, the shape of the optical centre tended to be more curved in older lenses [20,30], and hence future additional clinical studies to investigate the effects of ageing on the optical performance of the human lens will require the use of an optical centre based approach.
ZEMAX is an optics simulation software that has been used in a variety of eye research fields [6,42]. Previously, we have used ZEMAX to simulate the visual performances of the organ-cultured bovine eyes in the absence and presence of conditions that altering the physiological optics of the lens [6,7]. In this study, we extended our modelling approach to human lens studies for the first time, in which we combined the in vivo measured lens physiological optics from MRI and clinic biometry to build customised eye models. We further validated our model by predicting a participant’s spherical equivalent errors versus the clinically measured values. For most of the cases, the absolute prediction errors are within 0.5D. A recent MRI study has reported the changes of lens GRIN and geometry with different accommodative stimulus [22]. It will be interesting to apply our technology to study the accommodation, in which the changes in lens GRIN and geometry can be directly converted into absolute optical measurements.
There are, however, some limitations in our study presented here. T2-calculated GRIN maps were sensitive to participant’s eye/head movements, resulting in noisy and low-quality GRIN maps. As the MRI scan is about eight minutes, and our vision gaze target is at 2.1 m (rather than optical infinity), prolonged periods of optical accommodation and gaze control were required from our participants. This was the main reason we aimed for a younger healthy cohort for our initial study. Although the participants were provided with several opportunities to ‘rest’ their eyes, eye\head motion artefacts were still present in 2 out of 7 MRI scans, which resulted in a poor agreement between clinically measured and ZEMAX simulated refractive errors. We used the average corneal radius of curvatures for each participant for optical modelling that simplifies the complexity of cornea shape. There is the potential to further customise our model by considering astigmatism. Finally, the conventional GRIN formula in ZEAMX software is mathematically constrained and may not be sufficient to model the complex GRIN profiles observed in the human lens, especially older human lenses [20,27,43]. Future works to include full corneal topography, wave-front aberrometry [42], and customised the GRIN formulas [30,44] could help produce more accurate and comprehensive optical models [30,44].
However, despite these caveats, our initial imaging and modelling platform has the potential to serve as a new tool to objectively evaluate the physiological optics of the human lens. Having established the repeatability and accuracy of our MRI protocols to image the physiological optics of the young human, we now propose to include participants from different age cohorts, with the ultimate goal of using MRI measurements to detect biomarkers associated with the onset and progression of age-related cataract.
Acknowledgements
The Authors thank the radiographers at CAMRI for performing the MRI scans, Mr Safal Khanal, who developed the fixation target, and Dr Hannah Kersten for helping with eye examinations. Supported by funding from the HC Russell Memorial Postgraduate Scholarship from the New Zealand Association of Optometrists (recipient: ALL) and the HOPE Selwyn Foundation Scholarship for Ageing Research from the HOPE Foundation (recipient: ALL).
Funding
National Institutes of Health (NIH)10.13039/100000002 (Age related changes in lens transport and cataract, grant RO1 EY 026911-01).
Disclosures
The authors declare that there are no conflicts of interest related to this article.
References
- 1.Donaldson P. J., Grey A. C., Heilman B. M., Lim J. C., Vaghefi E., “The physiological optics of the lens,” Prog. Retinal Eye Res. 56, e1–e24 (2017). 10.1016/j.preteyeres.2016.09.002 [DOI] [PubMed] [Google Scholar]
- 2.Pierscionek B. K., Smith G., Augusteyn R. C., “The refractive increments of bovine α-, β-and γ-crystallins,” Vision Res. 27(9), 1539–1541 (1987). 10.1016/0042-6989(87)90162-3 [DOI] [PubMed] [Google Scholar]
- 3.Pierscionek B. K., “Refractive index contours in the human lens,” Exp. Eye Res. 64(6), 887–893 (1997). 10.1006/exer.1996.0252 [DOI] [PubMed] [Google Scholar]
- 4.Donaldson P. J., Chee K.-S. N., Lim J. C., Webb K. F., “Regulation of lens volume: implications for lens transparency,” Exp. Eye Res. 88(2), 144–150 (2009). 10.1016/j.exer.2008.05.011 [DOI] [PubMed] [Google Scholar]
- 5.Mathias R. T., Kistler J. K., Donaldson P. J., “The lens circulation,” J. Membr. Biol. 216(1), 1–16 (2007). 10.1007/s00232-007-9019-y [DOI] [PubMed] [Google Scholar]
- 6.Vaghefi E., Kim A., Donaldson P. J., “Active maintenance of the gradient of refractive index is required to sustain the optical properties of the lens,” Invest. Ophthalmol. Visual Sci. 56(12), 7195–7208 (2015). 10.1167/iovs.15-17861 [DOI] [PubMed] [Google Scholar]
- 7.Lim J. C., Vaghefi E., Li B., Nye-Wood M. G., Donaldson P. J., “Characterization of the Effects of Hyperbaric Oxygen on the Biochemical and Optical Properties of the Bovine LensEffects of HBO on the Bovine Lens,” Invest. Ophthalmol. Visual Sci. 57(4), 1961–1973 (2016). 10.1167/iovs.16-19142 [DOI] [PubMed] [Google Scholar]
- 8.Glasser A., Kaufman P. L., “The mechanism of accommodation in primates1,” Ophthalmology 106(5), 863–872 (1999). 10.1016/S0161-6420(99)00502-3 [DOI] [PubMed] [Google Scholar]
- 9.Asbell P. A., Dualan I., Mindel J., Brocks D., Ahmad M., Epstein S., “Age-related cataract,” Lancet 365(9459), 599–609 (2005). 10.1016/S0140-6736(05)70803-5 [DOI] [PubMed] [Google Scholar]
- 10.Vaghefi E., Walker K., Pontre B. P., Jacobs M. D., Donaldson P. J., “Magnetic resonance and confocal imaging of solute penetration into the lens reveals a zone of restricted extracellular space diffusion,” Am J Physiol Regul Integr Comp Physiol 302(11), R1250–R1259 (2012). 10.1152/ajpregu.00611.2011 [DOI] [PubMed] [Google Scholar]
- 11.Vaghefi E., Pontre B. P., Jacobs M. D., Donaldson P. J., “Visualizing ocular lens fluid dynamics using MRI: manipulation of steady-state water content and water fluxes,” Am J Physiol Regul Integr Comp Physiol 301(2), R335–R342 (2011). 10.1152/ajpregu.00173.2011 [DOI] [PubMed] [Google Scholar]
- 12.Moffat B. A., Atchison D. A., Pope J. M., “Age-related changes in refractive index distribution and power of the human lens as measured by magnetic resonance micro-imaging in vitro,” Vision Res. 42(13), 1683–1693 (2002). 10.1016/S0042-6989(02)00078-0 [DOI] [PubMed] [Google Scholar]
- 13.Rácz P., Hargitai C., Alföldy B., Banki P., Tompa K., “1 H Spin-Spin Relaxation in Normal and Cataractous Human, Normal Fish and Birds Eye Lenses,” Exp. Eye Res. 70(4), 529–536 (2000). 10.1006/exer.1999.0812 [DOI] [PubMed] [Google Scholar]
- 14.Pierscionek B. K., Regini J. W., “The gradient index lens of the eye: opto-biological synchrony,” Prog. Retinal Eye Res. 31(4), 332–349 (2012). 10.1016/j.preteyeres.2012.03.001 [DOI] [PubMed] [Google Scholar]
- 15.Bert R. J., Patz S., Ossiani M., Caruthers S. D., Jara H., Krejza J., Freddo T., “High-resolution MR imaging of the human eye 2005,” Academic radiology 13(3), 368–378 (2006). 10.1016/j.acra.2005.10.023 [DOI] [PubMed] [Google Scholar]
- 16.Patz S., Bert R. J., Frederick E., Freddo T. F., “T1 and T2 measurements of the fine structures of the in vivo and enucleated human eye,” Cigongzhen Chengxiang 26(3), 510–518 (2007). 10.1002/jmri.21017 [DOI] [PubMed] [Google Scholar]
- 17.Richdale K., Wassenaar P., Teal Bluestein K., Abduljalil A., Christoforidis J. A., Lanz T., Knopp M. V., Schmalbrock P., “7 Tesla MR imaging of the human eye in vivo,” Cigongzhen Chengxiang 30(5), 924–932 (2009). 10.1002/jmri.21959 [DOI] [PMC free article] [PubMed] [Google Scholar]
- 18.Kasthurirangan S., Markwell E. L., Atchison D. A., Pope J. M., “MRI study of the changes in crystalline lens shape with accommodation and aging in humans,” Journal of vision 11(3), 19 (2011). 10.1167/11.3.19 [DOI] [PubMed] [Google Scholar]
- 19.Jasvinder S., Khang T., Sarinder K., Loo V., Subrayan V., “Agreement analysis of LENSTAR with other techniques of biometry,” Eye 25(6), 717–724 (2011). 10.1038/eye.2011.28 [DOI] [PMC free article] [PubMed] [Google Scholar]
- 20.Pierscionek B. K., Bahrami M., Hoshino M., Uesugi K., Regini J., Yagi N., “The eye lens: age-related trends and individual variations in refractive index and shape parameters,” OncoTargets Ther. 6(31), 30532–30544 (2015). 10.18632/oncotarget.5762 [DOI] [PMC free article] [PubMed] [Google Scholar]
- 21.Borja D., Siedlecki D., de Castro A., Uhlhorn S., Ortiz S., Arrieta E., Parel J.-M., Marcos S., Manns F., “Distortions of the posterior surface in optical coherence tomography images of the isolated crystalline lens: effect of the lens index gradient,” Biomed. Opt. Express 1(5), 1331–1340 (2010). 10.1364/BOE.1.001331 [DOI] [PMC free article] [PubMed] [Google Scholar]
- 22.Khan A., Pope J. M., Verkicharla P. K., Suheimat M., Atchison D. A., “Change in human lens dimensions, lens refractive index distribution and ciliary body ring diameter with accommodation,” Biomed. Opt. Express 9(3), 1272–1282 (2018). 10.1364/BOE.9.001272 [DOI] [PMC free article] [PubMed] [Google Scholar]
- 23.Vaghefi E., Pontre B. P., Donaldson P. J., Hunter P. J., Jacobs M. D., “Visualization of transverse diffusion paths across fiber cells of the ocular lens by small animal MRI,” Physiological measurement 30(10), 1061–1073 (2009). 10.1088/0967-3334/30/10/007 [DOI] [PubMed] [Google Scholar]
- 24.Thaler L., Schütz A. C., Goodale M. A., Gegenfurtner K. R., “What is the best fixation target? The effect of target shape on the stability of fixational eye movements,” Vision Res. 76, 31–42 (2013). 10.1016/j.visres.2012.10.012 [DOI] [PubMed] [Google Scholar]
- 25.Tabandeh H., Thompson G. M., Heyworth P., Dorey S., Woods A. J., Lynch D., “Water content, lens hardness and cataract appearance,” Eye 8(1), 125–129 (1994). 10.1038/eye.1994.25 [DOI] [PubMed] [Google Scholar]
- 26.Dietrich O., Raya J. G., Reeder S. B., Reiser M. F., Schoenberg S. O., “Measurement of signal-to-noise ratios in MR images: Influence of multichannel coils, parallel imaging, and reconstruction filters,” Cigongzhen Chengxiang 26(2), 375–385 (2007). 10.1002/jmri.20969 [DOI] [PubMed] [Google Scholar]
- 27.Jones C. E., Atchison D. A., Meder R., Pope J. M., “Refractive index distribution and optical properties of the isolated human lens measured using magnetic resonance imaging (MRI),” Vision Res. 45(18), 2352–2366 (2005). 10.1016/j.visres.2005.03.008 [DOI] [PubMed] [Google Scholar]
- 28.Russ J. C., Matey J. R., Mallinckrodt A. J., McKay S., “The image processing handbook,” Comput. Phys. 8(2), 177–178 (1994). 10.1063/1.4823282 [DOI] [Google Scholar]
- 29.Vezhnevets V., Konouchine V., “GrowCut: Interactive multi-label ND image segmentation by cellular automata,” in proc. of Graphicon, 2005), 150–156. [Google Scholar]
- 30.Navarro R., Palos F., González L., “Adaptive model of the gradient index of the human lens. I. Formulation and model of aging ex vivo lenses,” J. Opt. Soc. Am. A 24(8), 2175–2185 (2007). 10.1364/JOSAA.24.002175 [DOI] [PubMed] [Google Scholar]
- 31.Dubbelman M., Van der Heijde G., “The shape of the aging human lens: curvature, equivalent refractive index and the lens paradox,” Vision Res. 41(14), 1867–1877 (2001). 10.1016/S0042-6989(01)00057-8 [DOI] [PubMed] [Google Scholar]
- 32.Adnan X., Pope J. M., Sepehrband F., Suheimat M., Verkicharla P. K., Atchison D. A., Kasthurirangan S., “Lens shape and refractive index distribution in type 1 diabetes,” Invest. Ophthalmol. Visual Sci. 56(8), 4759–4766 (2015). 10.1167/iovs.15-16430 [DOI] [PubMed] [Google Scholar]
- 33.Atchison D. A., Smith G., “Optics of the Human Eye” (Butterworth-Heinemann,2000). [Google Scholar]
- 34.Goncharov A. V., Dainty C., “Wide-field schematic eye models with gradient-index lens,” J. Opt. Soc. Am. A 24(8), 2157–2174 (2007). 10.1364/JOSAA.24.002157 [DOI] [PubMed] [Google Scholar]
- 35.Tocci M., “How to model the human eye in ZEMAX,” Opt. Design Eng. 23 (2007). [Google Scholar]
- 36.Rozema J. J., Atchison D. A., Tassignon M.-J., “Comparing methods to estimate the human lens power,” Invest. Ophthalmol. Visual Sci. 52(11), 7937–7942 (2011). 10.1167/iovs.11-7899 [DOI] [PubMed] [Google Scholar]
- 37.Bettelheim F. A., Lizak M. J., Zigler J. S., Jr., “Relaxographic studies of aging normal human lenses,” Exp. Eye Res. 75(6), 695–702 (2002). 10.1006/exer.2002.2056 [DOI] [PubMed] [Google Scholar]
- 38.Kasthurirangan S., Markwell E. L., Atchison D. A., Pope J. M., “In vivo study of changes in refractive index distribution in the human crystalline lens with age and accommodation,” Invest. Ophthalmol. Visual Sci. 49(6), 2531–2540 (2008). 10.1167/iovs.07-1443 [DOI] [PubMed] [Google Scholar]
- 39.Ke B., Mao X., Jiang H., He J., Liu C., Li M., Yuan Y., Wang J., “The relationship between high-order aberration and anterior ocular biometry during accommodation in young healthy adults,” Invest. Ophthalmol. Visual Sci. 58(13), 5628–5635 (2017). 10.1167/iovs.17-21712 [DOI] [PMC free article] [PubMed] [Google Scholar]
- 40.Smith G., Cox M. J., Calver R., Garner L. F., “The spherical aberration of the crystalline lens of the human eye,” Vision Res. 41(2), 235–243 (2001). 10.1016/S0042-6989(00)00206-6 [DOI] [PubMed] [Google Scholar]
- 41.Jonas J. B., Iribarren R., Nangia V., Sinha A., Pardhi P., Shukla R., Panda-Jonas S., “Lens position and age: the Central India eye and medical study,” Invest. Ophthalmol. Visual Sci. 56(9), 5309–5314 (2015). 10.1167/iovs.15-16796 [DOI] [PubMed] [Google Scholar]
- 42.Kingston A. C., Cox I. G., “Predicting through-focus visual acuity with the eye’s natural aberrations,” Optometry and Vision Science 90(10), 1111–1118 (2013). 10.1097/OPX.0000000000000031 [DOI] [PubMed] [Google Scholar]
- 43.Sheil C. J., Goncharov A. V., “Accommodating volume-constant age-dependent optical (AVOCADO) model of the crystalline GRIN lens,” Biomed. Opt. Express 7(5), 1985–1999 (2016). 10.1364/BOE.7.001985 [DOI] [PMC free article] [PubMed] [Google Scholar]
- 44.Navarro R., Palos F., González L. M., “Adaptive model of the gradient index of the human lens. II. Optics of the accommodating aging lens,” J. Opt. Soc. Am. A 24(9), 2911–2920 (2007). 10.1364/JOSAA.24.002911 [DOI] [PubMed] [Google Scholar]


