

Abstract
Absence seizures are the most pure form of generalized epilepsy. They are characterized in the electroencephalogram by widespread bilaterally synchronous spike-wave discharges (SWDs), which are the reflections of highly synchronized oscillations in thalamocortical networks. To reveal network mechanisms responsible for the initiation and generalization of the discharges, we studied the interrelationships between multisite cortical and thalamic field potentials recorded during spontaneous SWDs in the freely moving WAG/Rij rat, a genetic model of absence epilepsy.
Nonlinear association analysis revealed a consistent cortical “focus” within the peri-oral region of the somatosensory cortex. The SWDs recorded at other cortical sites consistently lagged this focal site, with time delays that increased with electrode distance (corresponding to a mean propagation velocity of 1.4 m/sec). Intra-thalamic relationships were more complex and could not account for the observed cortical propagation pattern. Cortical and thalamic sites interacted bi-directionally, whereas the direction of this coupling could vary throughout one seizure. However, during the first 500 msec, the cortical focus was consistently found to lead the thalamus.
These findings argue against the existence of one common subcortical pacemaker for the generation of generalized spike-wave discharges characteristic for absence seizures in the rat. Instead, the results suggest that a cortical focus is the dominant factor in initiating the paroxysmal oscillation within the corticothalamic loops, and that the large-scale synchronization is mediated by ways of an extremely fast intracortical spread of seizure activity. Analogous mechanisms may underlie the pathophysiology of human absence epilepsy.
Keywords: generalized spike-wave discharges, absence epilepsy, cortical focus, thalamus, synchronized oscillations, nonlinear association analysis
Absence seizures or “petit mal” seizures are the most characteristic form of generalized epilepsy. They consist of a sudden arrest of ongoing behavior and impairment of consciousness and are associated with the abrupt occurrence of bilaterally synchronous three per second spike-and-wave discharges (SWDs) in the electroencephalogram (EEG) over wide cortical areas. The generalized nature of the discharges led to the hypothesis of a common central (midline subcortical) pacemaker (Jasper and Kershman, 1941; Jasper and Droogleever-Fortuyn, 1947; Penfield and Jasper, 1954). Depth recordings in humans (Williams, 1953) revealed that the SWDs are indeed the surface reflections of highly synchronized oscillations in thalamocortical networks. However, the relative contributions of thalamus and cortex are still a matter of debate among clinicians and experimental researchers because they seem to depend on the animal model and the experimental manipulation used.
Extensive investigation of the feline penicillin generalized epilepsy (FPGE) model revealed that the generation of SWDs is closely linked to the mechanisms that mediate spindles (Gloor et al., 1990). Today, the basic cellular and synaptic mechanisms that underlie the generation of spindle oscillations in the intra-thalamic microcircuitry have been elucidated to a great extent (for review, see Steriade and Llinás, 1988; McCormick and Bal, 1997; Steriade et al., 1997). Although commonly assumed, it has never been conclusively demonstrated that the same mechanisms also apply to the generation of generalized SWDs. Moreover, these microcircuitry mechanisms in themselves do not explain the most striking feature of absence spike-and-wave, which is its bilateral and widespread generalization. Such a generalization process requires the synchronization of widely distributed thalamocortical networks, yet little is known about which neuronal circuits govern this large-scale synchronization. Some researchers favor the assumption that a massive thalamic synchronization results from recurrent oscillatory activity in the networks between cells of the reticular thalamic nucleus (RTN) and thalamocortical relay (TCR) cells (Buzsáki, 1991; McCormick and Bal, 1997; Avanzini et al., 2000). Others, however, have stressed the important role of intracortical processes in the synchronization of physiological oscillations (Lopes da Silva et al., 1980; Contreras et al., 1996) or cortically generated SWDs (Neckelmann et al., 1998). Furthermore, it has also been demonstrated that neocortex alone is capable of sustaining some forms of low-frequency synchronized oscillations (Silva et al., 1991; Flint and Connors, 1996).
The mechanisms of widespread synchronization are still elusive, however, and have never been explicitly investigated in an animal model of generalized epilepsy. The present study attempts to shed more light on this phenomenon by studying the spatiotemporal properties of spontaneously occurring generalized SWDs in a well established genetic model of absence epilepsy, the WAG/Rij rat (Coenen et al., 1992). Field potentials, which reflect the summated postsynaptic activity of the underlying neuronal cell populations, were simultaneously recorded from multiple cortical and thalamic sites in the freely moving WAG/Rij rat. To study the dynamics of driver–response relationships between these sites, the interdependencies between the signals were quantified by the application of the advanced signal analysis method of nonlinear association (Pijn et al., 1989; Pijn, 1990).
MATERIALS AND METHODS
Subjects. Rats of the inbred WAG/Rij strain were used as experimental subjects. These rats constitute a well established genetic animal model of absence epilepsy (Coenen et al., 1992). All rats of this strain suffer from a genetically determined seizure disorder. They display hundreds of spontaneous electrographic seizures a day that are characterized by bilaterally generalized SWDs, which can arise abruptly from normal background EEG (Van Luijtelaar and Coenen, 1986). The SWDs usually occur when the level of vigilance is low, i.e., during quiet wakefulness, drowsiness, and light slow-wave sleep (Coenen et al., 1991; Drinkenburg et al., 1991). The frequency of the discharges is typically 7–11 Hz, and the duration usually varies from 2 to 8 sec; longer trains of up to 45 sec can be found occasionally. The electrographic seizures are associated with behavioral arrest and mild orofacial myoclonic twitches (Van Luijtelaar and Coenen, 1986), an impaired responsiveness and impaired stimulus evaluation (Drinkenburg et al., 1996), and a disturbance of time perception (Van Luijtelaar et al., 1991). They are suppressed by the specific anti-absence drugs and aggravated by drugs effective against tonic-clonic seizures (Peeters et al., 1988). The SWDs depend on the (functional) integrity of both thalamus (Meeren et al., 1998) and cortex (Meeren et al., 1997).
In the present study, male WAG/Rij rats born and raised in the laboratory of the Department of Comparative and Physiological Psychology at the University of Nijmegen were used. The rats were housed in groups of two to three animals and had ad libitumaccess to water and food. At the time of surgery they were 16–22 months of age, and their body weights ranged from 335 to 400 gm. After surgery they were individually housed and maintained on a 12 hr light/dark cycle, with white lights on at 7:00 A.M. The experiments were approved by the Ethical Committee on Animal Experimentation of the University of Nijmegen.
Surgery. Chronic electrodes were implanted during stereotactic surgery under pentobarbital anesthesia (60 mg/kg bodyweight, i.p.; initial dose, sodium pentobarbital) complemented with 0.2 ml atropine sulfate (0.25 mg/ml, s.c.) to prevent excessive salivary secretion and 2% lidocaine for local analgesia of the periost and wound edges. Additional doses of 0.1 ml (60 mg/ml) pentobarbital were given intraperitoneally when required. The body heat of the animals was conserved using a 37°C heating pad. All stereotactic coordinates are relative to bregma with skull surface flat, according to Paxinos and Watson (1986). Each rat received 16 active electrodes that consisted of stainless steel wires of 100 μm diameter (California Fine Wire, Grover Beach, CA) with only the section of the tip uninsulated. In the first series of rats, small holes were drilled in the skull for epidural implantation of electrodes on the dorsal surface of the cortex only. In a second series the electrodes were implanted on the lateral convexity of the cortical surface. To this end the temporal muscle was resected, a bone flap was removed, and the dura was carefully removed. Subsequently, a silicone sheet (thickness <0.5 mm) with electrodes at predefined positions was put directly onto the cortical surface and fixated to the skull with tissue glue. Depth electrodes were prepared in bundles of four electrodes cut at different lengths with the interelectrode distance varying between 300 and 700 μm. Vertical bundles were inserted through a hole in the skull and implanted in the thalamus and fixed to the skull with tissue glue and some dental cement. Two stainless steel screws in the cranium overlying the cerebellum served as ground and common reference electrode. All wires led into a miniature connector (CTA strips, ITT Cannon, Avio-Diepen B.V., Alphen a/d Rijn, The Netherlands). The whole assembly was fixed to the skull with two additional screws in the cranium and dental cement for grip. On completion of surgery the animals received a 0.2 ml/kg intramuscular injection of 0.324 mg/ml buprenorfine hydrochloride (Temgesic, Reckitt and Colman Products Ltd., Kingston-Upon-Hull, UK) for analgesia after surgery.
Recording. Animals were allowed a period of at least 10 d to recover before the recording sessions started. First, spontaneous field potentials were recorded in freely moving WAG/Rij rats until enough representative spontaneously occurring SWDs were collected. These data were used for the signal analysis. Second, evoked potentials were recorded to study the functional topography of the cortical and thalamic recording sites.
The animals were connected to contraplugs on which operational preamplifiers were mounted to eliminate movement artifacts and were put in a Plexiglas observation box (25 × 30 × 35 cm) that was placed in a Faraday cage. Referential field potentials were simultaneously recorded from 16 cortical or cortical and thalamic sites. One of the two screws in the neurocranium overlying the cerebellum was used as a common reference electrode, and the other served as ground electrode. Signals were fed into a multichannel differential amplifier through long recording leads via a swivel contact, bandpass filtered between 1 and 1000 Hz, digitized with 2000 samples per second, and stored on a hard disk (Data Acquisition Hardware and Software, DATAQ Instruments, Inc., Akron, OH).
Somatosensory evoked potentials (SEPs) upon tactile stimulation of the head and paws were recorded under pentobarbital anesthesia from both the cortical and thalamic leads while the rat was lying on a 37°C heating pad and its head was held in a fixed position. Mechanical stimulation was performed by an electronically driven metal rod that made an upward-downward deflection upon triggering with a vertical amplitude of ∼1 cm at the tip. The following parts of the head were stimulated: vibrissae (all mystacial whiskers tied together), upper lip, lower lip, tongue, and nose. Furthermore, the inner palms of the forepaws and hindpaws were stimulated. At least 67 responses were averaged off-line, with 200 pre-trigger samples as baseline and 800 post-trigger samples.
Field potentials evoked by electrical stimulation of the thalamic electrodes were recorded from the cortical sites. Single biphasic current pulses (0.2 + 0.2 msec; 50 or 100 μA) were delivered between two adjacent thalamic electrodes, stimulating each pair of adjacent electrodes, while the animals were moving freely. The field potentials were bandpass filtered between 1 and 2500 Hz, digitized with 5000 samples per second, and off-line averaged with 200 pre-trigger samples as baseline and 800 post-trigger samples.
Signal analysis. To estimate the degree of association between two signals and the corresponding time delay, the nonlinear correlation coefficient h2 was calculated as a function of time shift (τ) between the two signals. This statistical measure was first introduced in EEG signal analysis by Pijn and colleagues (Lopes da Silva et al., 1989; Pijn et al., 1989;Pijn, 1990) and has also recently been shown to give reliable measures for the degree and direction of functional coupling between neuronal populations in epilepsy (Wendling et al., 2001). It describes the dependency of a signal Y on a signal X in a general way. This method has some major advantages over other signal analysis methods such as coherence and cross-correlation functions because it can be applied independently of whether the type of relationship between the two signals is linear or nonlinear. Details of the theoretical and practical aspects of this method can be found in the above-mentioned reports.
The basic idea is that if the amplitude of signal Y is considered as a function of the amplitude of signal X, the value of y given a certain value of x can be predicted according to a nonlinear regression curve. The variance of Y according to the regression curve is called the explained variance, i.e., it is explained or predicted on the basis of X. By subtracting the explained variance from the total variance one obtains the unexplained variance. The correlation ratio η2 expresses the reduction of variance of Y that can be obtained by predicting they values according to the regression curve as follows: η2 = (total variance − unexplained variance)/total variance.
In practice, a numerical approximation of the nonlinear regression curve is obtained by describing the scatterplot of y versusx by segments of linear regression curves. The variablex is subdivided into bins; for each bin the xvalue of the midpoint (pi) and the average value of y (qi) are calculated, and the resulting points (pi,qi) are connected by segments of straight lines (= linear regression curves). The nonlinear correlation coefficienth2, which is the estimator for η2, can now be computed as the fraction of total variance that can be explained by the segments of linear regression lines, as follows:
with N being the number of samples and <y> being the average of allyi.
The estimator h2, which signifies the strength of the association between the two signals, can take values between 0 (Y is totally independent of X) and 1 (Y is completely determined by X). In the case of a linear relationship between x and y, the η2 reduces to the common regression coefficient r2. Similarly, as in the case of the cross-correlation, one can estimateh2 as a function of time shift (τ) between signal X and Y or vice versa. That shift for which the maximum value for h2 is reached is used as an estimate of the time lag between the two signals.
In the present study, association strengths and their corresponding time delays were determined between all possible pairs of cortical electrodes and between all possible pairs of thalamic electrodes. For the assessment of corticothalamic relationships, cortical–thalamic electrode pairs were taken into account only if the functional interconnectivity between the sites could be established in three independent ways. First, on the basis of the histological location of the electrode tips, thalamic electrodes had to be within the ventrobasal (VB) complex [ventroposterior medial nucleus (VPM) and ventroposterior lateral nucleus (VPL)] or within the posterior complex (Po), and the cortical electrodes had to be within the somatosensory cortex. Second, both the cortical and the thalamic electrode sites needed to show a clear SEP response to the same peripheral tactile stimulus. Third, the cortical electrode had to show a clear response during electrical stimulation of its thalamic counterpart.
All signal analyses were performed using the Onyx software package (Silicon Biomedical Instruments BV, Westervoort, The Netherlands). For all the analyses the variable x was subdivided into 10 bins, the maximum time shift was 75 msec, and the minimum time shift was 0.5 msec (= one time sample). We first assessed the “overall” corticocortical, thalamothalamic, and corticothalamic relationships during a seizure by taking the whole seizure (2–11 sec) as one single analysis epoch. This was done to test whether the relationships throughout the seizures were consistent. To this end, 8–10 representative seizures were selected for each animal. Mean and SEM values for h2 and τ were calculated for each animal. To determine whether time delays differed significantly from 0, the 95% confidence interval for τ was calculated for each pair of electrodes. Furthermore, the relation of the association strength and time lag as a function of electrode distance was assessed by fitting a linear regression line to the data.
Second, taking into consideration that seizure activity may deviate from stationarity, the seizure dynamics was studied by plotting the association strengths and time lags for successive short epochs. To this end, successive epochs of 500 msec with 50% temporal overlap were taken, with the total time window covering the period starting from 2 sec before seizure onset and ending 2 sec after the end of the seizure. To investigate seizure initiation mechanisms, the evolution of the association parameters within the 2 sec time window around the onset of the seizure, the so-called transition period, was studied more systematically. The time point of the onset of the seizure (t = 0) was defined as the time of the peak of the first generalized spike. To reveal any possible consistent (changes in) pattern, for each electrode pair the statistics of the association parameters over 8–10 seizures were calculated (mean, SEM, 95% confidence interval) for each 500 msec epoch.
In addition, nonlinear association analysis was performed on the multisite SEP data to define which cortical site had the shortest latency response to peripheral stimulation, to study the functional topography of the cortical sites, and to compare the spatiotemporal properties of the SWDs with the spatiotemporal properties of the SEPs.
Histology. To precisely determine the anatomical location of the recording sites, a procedure was followed that visualizes the position of the tip of the electrodes as blue dots against a purple background in histological sections. To this end, the animals were deeply anesthetized with pentobarbital, and a direct current (0.1 mA for 5 sec) was passed through each active electrode and the reference electrode for iron depositioning. Subsequently, the animals were perfused intracardially with saline followed by a 4% paraformaldehyde phosphate (0.1 m) buffered solution containing 2% potassium ferrocyanate. Brains were removed and stored in 4% paraformaldehyde phosphate buffer and transferred to 20% buffered sucrose 1 d before sectioning. Serial coronal sections of 60 μm were cut on a vibratome, mounted on gelatin-coated slides, and stained with 0.1% cresyl violet.
RESULTS
Corticocortical relationships
Bilaterally symmetrical cortical sites
In two rats (H4 and H5) implanted with two rows of seven electrodes in rostrocaudal direction over the dorsal aspect of the cortical surface, one row in each hemisphere [coordinates mediolateral (ML) ± 3.0 mm, anteroposterior (AP) +4.0, +2.0, 0.0, −2.0, −4.0, −6.0, −8.0 mm], recordings were made from bilaterally symmetrical sites.
Figure 1 shows a typical example of the referential electrocorticographic (ECoG) signals that were obtained during an electrographic seizure. The ECoG is characterized by a train of generalized high-voltage repetitive discharges, which have a characteristic spike-and-wave morphology, the so-called SWDs. The discharges are bilaterally symmetric and seem to be synchronous on visual inspection at normal “paper speed.” In general, the “spike” of the spike-wave complex recorded from the cortical surface can be monophasic or biphasic, but it always has a strong negative component. If it is biphasic, the negative component is preceded by a positive component, which can vary in amplitude between animals [Fig. 2 (H12), compare with Fig. 7 (H16)], but also between seizures or within a seizure in the same animal (Fig. 7,H16). Previous studies have shown that the spike at the cortical surface is correlated with unit firing in all neocortical layers (Inoue et al., 1993; Kandel and Buzsáki, 1997). Current source density analysis of intracortical depth profiles of the spikes showed that there was a consistent strong sink in layer 4 during all spikes and that the early deep (layer 6) and late superficial (layer 2/3) sinks were stronger during spikes with a preceding positive component than during the monophasic spikes (Kandel and Buzsáki, 1997).
Fig. 1.

Intra-hemispheric and inter-hemispheric corticocortical relationships. A, Typical example of an electrographic seizure recorded from bilaterally symmetrical cortical sites (rat H4). Negativity is up. B, Intra-hemispheric associations (%) as a function of electrode distance (mm). Each point in the graph represents the average strength of association for a given electrode pair over eight seizures. The relationships can be described by astraight line and are identical for the left and right hemisphere. C, Intra-hemispheric time delays (ms) as a function of electrode distance (mm). Each point in the graph represents the average time lag (ms) for a given electrode pair over eight seizures. Data of electrode 1–12 are taken into account. The relationships can be described by a straight lineand are similar for the left (CxL) and right (CxR) hemisphere, resulting in an average propagation velocity of 1 m/sec. D, Intra-hemispheric versus inter-hemispheric association. The average associations over eight seizures for electrode pairs with an inter-electrode distance of 6 mm are used to calculate the associations within one hemisphere (= intra-hemispheric association; mean and SEM; n = 6 electrode pairs, 3 pairs in each hemisphere) and between the homologous points of the two hemispheres (= inter-hemispheric association; mean and SEM; n = 6 electrode pairs). The inter-hemispheric association is twice as high as the intra-hemispheric association (p < 0.005; two-tailedt test; df = 10). (For B,C, and D, data of electrodes 1–12 are taken into account).
Fig. 2.

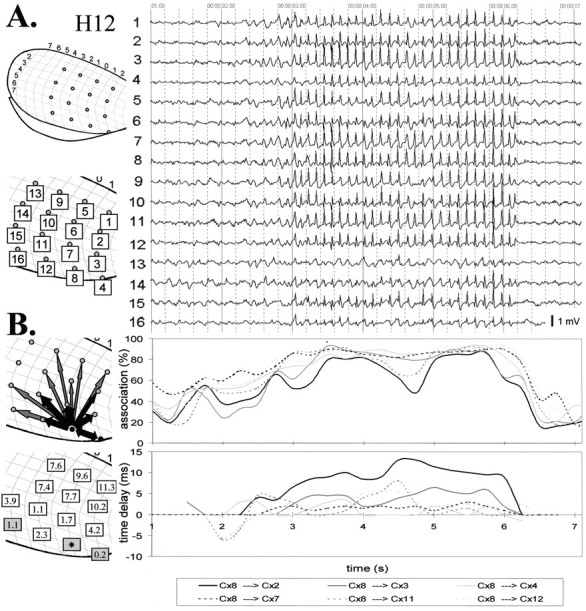
Intra-hemispheric corticocortical relationships.A, A typical electrographic seizure recorded with a cortical grid that covers a great part of the lateral convexity of the neocortex (rat H12). The position of the electrodes and their labels are shown on the left. The generalized nature of the discharges can be readily recognized. B, Topographical arrow representations of the results of the nonlinear association analysis (averaged over 10 seizures) from five different perspectives. The thickness of thearrow represents the strength of the association, and the direction of the arrowhead points to the direction of the lagging site. Electrodes 4 and 8 (black dots) were found to consistently lead the other sites across seizures. The numbers depict the average time delays (in milliseconds) over 10 seizures with respect to electrode 8.C, The association (left) and time delay (middle and right) as a function of electrode distance (mm). Each point in the graphs represents the average association (%) or average time lag (ms) for a given electrode pair over 10 seizures. The linear regression lines and their corresponding equations are also plotted. When all possible electrode pairs are taken into account, the relationship between time delay and distance is weak (middle). When only the time delays with respect to the focal site of electrode 8 are considered, this relationship is quite strong (left) and corresponds to an average propagation velocity of 2 m/sec.
Fig. 7.

Typical example of an electrographic seizure (with negativity up) from simultaneously recorded cortical and thalamic leads in rat H16. The schematic drawing at the left depicts the position of the electrodes on the cortex (Cx) (SmI, primary somatosensory cortex; HP, hindpaw area; UL, upper lip area; LL, lower lip area; established with somatosensory evoked potentials) and the thalamus (Th) (VPL, ventroposterior lateral nucleus; VPM, ventroposterior medial nucleus), with their respective labels. The arrows indicate which cortical and thalamic sites are interconnected as established by histology, electrical stimulation of the thalamic sites, and somatosensory evoked potentials. In the field potentials from the VPM (bottom two traces: B3,B4), a typical spike-wave morphology can be seen, with a highly sharp but often small negative spike appearing on the decreasing slope of the negative wave. In contrast, the signals from the VPL (A4) and the LD (A2) show a much more (sharp or arched) spindle-like pattern. In the two cortical focal sites (i, f) and the two sites anterior from these (b, c), some rhythmic activity can be seen preceding the onset of the generalized seizure. The same is observed in the two VPM traces.
The spikes usually appear on the crest of a negative-going wave. The amplitude of the wave component is relatively small but can vary considerably between animals [Fig. 2 (H12), compare with Fig. 7 (H16)]. The spike component is maximum at the frontal sites, decreasing in amplitude in the caudal direction. In the occipital sites the spikes are hardly visible, and only some rhythmic waves can be distinguished at the most. The wave component is maximum at the parietal sites and becomes more prominent toward the end of the seizure. This is in full agreement with the findings of Midzianovskaia et al. (2001). The intra-episode frequency of the SWDs can range from 7 to 11 Hz, with the frequency always being somewhat higher at the beginning of the seizure and slowing down toward the end.
Nonlinear association analysis: intra-hemispheric relationships
Within one hemisphere the association values between adjacent electrodes were high, i.e., ∼80–90% for the nonoccipital electrodes. In general, the strength of association decreased with increasing distance between the electrodes, as can be seen in Figure1B. The relationship between association strength and electrode distance can be well described by a linear regression line [with R2 values of 0.59 (left hemisphere) and 0.78 (right hemisphere) for animal H4, and 0.84 (left) and 0.67 (right) for animal H5], predicting a loss of 8% of association value per millimeter distance on average.
Furthermore, nonlinear association analysis revealed time delays between signals. These time delays were usually small (0–2 msec) between adjacent sites but in general increased with increasing electrode distance (Fig. 1C). This relationship could also be described by a straight line [R2 = 0.45 (left) and 0.84 (right) for animal H4, and R2 = 0.87 (left) and 0.52 for animal H5 (right)], corresponding to an average “propagation velocity” of 1 m/sec (or 1 mm/msec).
Nonlinear association analysis: intra- versus inter-hemispheric relationships
Except for the two most posterior cortical sites, the association values were high between homologous sites of the left and right hemisphere (80–95%). These inter-hemispheric association values [76.29 ± 6.21% (mean ± SEM;n = 6) for H4; 71.54 ± 5.76% (n= 6) for H5] were (almost) twice as large as the intra-hemispheric association values [38.97 ± 6.45% (n = 6) for H4; 42.35 ± 7.57% (n= 6) for H5] for the same inter-electrode distance of 6 mm, as shown in Figure 1D. This difference was significant (p < 0.005 for H4; p < 0.05 for H5; two-tailed t test; df = 10). The average inter-hemispheric time delay between homologous sites at 6 mm distance was 1.8 ± 0.3 msec for H4 (from left to right) and 2.6 ± 0.6 msec for H5 (from right to left). This corresponds roughly to a propagation velocity of 3 m/sec (3 mm/msec), which is a factor 3 higher than the intra-hemispheric velocity.
Unilateral cortical grid
Four animals were implanted with multiple electrode rows (in rostrocaudal direction) placed in parallel to each other on the dorsal surface of one hemisphere. Time delays were found between recording sites. It appeared that the direction of these time lags was in general from posterior to anterior and always from the lateral to the more medial sites (results not shown). In other words, the more lateral sites were always leading the more medial sites. To study these time delays in more depth and to search for the “ultimate” leading site, it was necessary to place the electrodes on the lateral convexity of the cortical surface. For this purpose, the temporal muscle was resected, a bone flap was removed, and a silicone grid with electrodes was implanted directly onto the cortical surface.
An example of a grid recording (rat H12) is shown in Figure 2. This electrode grid covered a great part of the dorsal and lateral aspect of the cortical surface with 2 mm spacing between the electrodes. Only the occipital sites, which do not show clear SWD activity (Fig. 1), and part of the frontal cortex, which in previous animals (H4 and H5 among others) had been shown to lag behind, were not covered. Visual inspection of the multisite recordings from the lateral aspects of the convexity of the brain revealed that the typical generalized spike-and-wave activity was often preceded by sharp rhythmic activity in the most anterior lateral sites. Sometimes even focal spike-and-wave activity could occur one cycle or a few cycles before the generalized occurrence of SWDs. These phenomena appeared either at the sites that were “leading” during the generalized seizure activity (see the following paragraphs) or at the sites located anterior to these leading sites (for an example, see Fig. 7). The placement of the cortical grid electrodes in seven other rats can be found in Figure3.
Fig. 3.

Topography of the cortical focus. These are the pooled results from eight rats with cortical grids. The positions of the recording sites are indicated by the position of the symbols, with a different symbol for each individual rat. Filled symbols represent the leading sites as established by nonlinear association analysis; open symbols represent the lagging sites. The focus is found almost exclusively at the most ventrolateral recording sites. The foci of different animals overlap for a great part.
Nonlinear association analysis: average relationships during the whole seizure
Association analysis of the whole seizure revealed the average or overall pattern of the relationships between cortical recording sites during the seizure in eight rats [for an example (rat H12), see Fig.2, B and C]. There was a general tendency for the strength of association to decrease with increasing electrode distance (Fig. 2C). A linear relationship between strength of association and electrode distance could account for the obtained results. The average R2 for the linear regression curve for eight rats was 0.62 (range, 0.48–0.73), explaining an average decrease in association of 8% per millimeter. However, the strength of association was not always a simple function of distance. For instance, in rat H12 (Fig. 2B), the association was very strong between certain neighboring electrodes but weaker between other neighboring electrodes.
With respect to the time shifts between cortical sites, it appeared that in each animal there was one electrode or there were two or three (neighboring) electrodes that were consistently leading across seizures (n = 8–10 seizures) (Figs. 2B, 3). The other sites significantly lagged behind (according to the 95% confidence interval) by a few milliseconds. For a given electrode pair, the time lag was consistent across seizures. In general, the farther away from this focus or “focal zone,” the larger the time lag. This relationship could be well explained by linear regression (Fig.2C) with an averageR2 of 0.69 (range, 0.39–0.95;n = 8 rats), corresponding to an average propagation velocity of 1.4 m/sec (range, 0.9–2.1).
(Functional) topography of cortical focus
In all eight animals with a cortical grid, the focus was always found to be located at the most (ventro-)lateral recording sites on the cortex (Figs. 2, 3). In two animals, part of the focal zone was also located at the second most lateral sites. The anteroposterior coordinates of the focus ranged between +2.0 mm (anterior to bregma) and −3.0 mm (posterior to bregma), whereas the lateral coordinate ranged between 6.0 and 8.0 mm. Hence, the focal zones of the different animals showed a great part of overlap (Fig. 3). The chronic recording technique did not allow to place the grid further lateroventral over the convexity of the cortical surface than the present 8 mm as measured from the longitudinal fissure, because this would have required the removal of the zygomatic bone. However, in one of the pilot animals, one electrode accidentally ended up just ventral of the rhinal sulcus (in the perirhinal cortex, AP −2.0 mm). The SWDs found at this site showed a prominent wave component, whereas the spike was very small (smaller than the wave component). This site was found to lag 33 msec behind a site in the somatosensory cortex (AP −2.0, ML 4.8 mm).
It thus appears that the focal zone is located in the more ventrolateral aspects of the somatosensory cortex. To study the functional topography of the focus in depth, we compared the location of the SWD focus with the location of the “focus” of the different SEPs. To this end, association analysis was performed on the multisite SEP data, and the leading site according to the resulting time lags was considered to be the location of the “SEP focus.” Both the spatial distribution of the “raw” SEP responses and the calculated SEP foci (Fig. 4) corresponded well with the somatotopy of the somatosensory cortex of the rat as it has been described in literature (Woolsey, 1958; Welker, 1971; Chapin and Lin, 1984). Figure 4 shows the cortical topography of the different SEP foci in relationship with the SWD focus in rat H12. From Table1 it becomes clear that the SWD focus in all animals corresponded to the SEP response to peripheral stimulation of the nose. In addition, in seven of eight animals, the SWD focus was found at the leading site for stimulation of the contralateral upper lip, and in five animals it was found at the leading site for stimulation of the contralateral vibrissae.
Fig. 4.
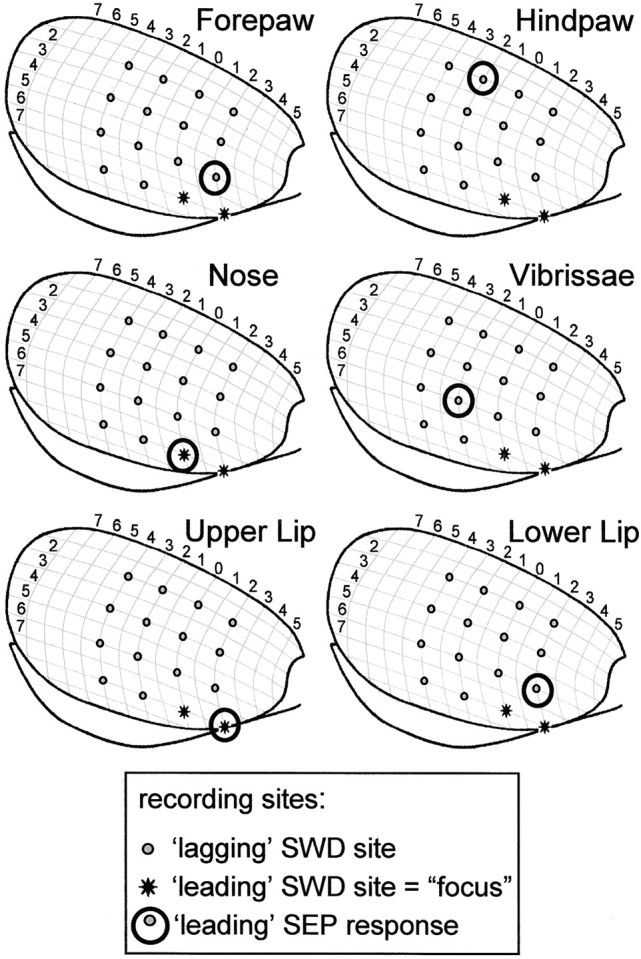
Functional topography of the focus. The leading sites of the somatosensory evoked potentials (SEPs) (circles) for different peripheral mechanical stimulations are shown for rat H12. The focal sites for SWDs (asterisk) correspond to the leading SEP sites for stimulation of the upper lip and nose. The results for the other seven animals can be found in Table 1.
Table 1.
Correspondence between SWD focus and SEP foci in cortex
| H11 | H12 | H15 | H16 | H18 | H19 | H20 | H21 | |
|---|---|---|---|---|---|---|---|---|
| Forepaw | N.A. | − | − | − | − | − | +/− | − |
| Hindpaw | N.A. | − | − | − | − | − | − | − |
| Vibrissae | + | − | +/− | + | + | − | − | + |
| Upper lip | + | + | +/− | + | ++ | ++ | + | − |
| Lower lip | − | − | − | − | − | − | − | − |
| Nose | + | + | ++ | ++ | + | ++ | + | +/− |
| Tongue | N.A. | N.A. | N.A. | − | N.A. | − | + | − |
Correspondence between leading sites of the SWDs and of the different somatosensory evoked potentials (SEPs), according to the time delays from the nonlinear association analysis. ++, All leading SWD sites also lead during the SEP; +, at least one of the leading SWD sites leads during the SEP; +/−, at least one of the SWD leading sites lags only one sample behind (τ = 0.5 msec) during the SEP; −, the leading SWD sites lag by 1 msec or more during the SEP; N.A., no information available.
Nonlinear association analysis: temporal dynamics
Association analysis of successive 500 msec epochs (50% overlapping) before, during, and after the seizure was performed to study the seizure dynamics. Figure 5shows an example of the time evolution of the association parameters of a typical seizure of rat H12.
Fig. 5.
Time evolution of the intra-hemispheric corticocortical relationships. A, A typical electrographic seizure recorded (with negativity up) with a cortical grid that covers a great part of the lateral convexity of the neocortex (rat H12). The position of the electrodes and their labels are shown on the left. B, Time courses of the corticocortical nonlinear associations (top panel) and time delays (bottom panel) for several sites (as indicated by theblack arrows on the left) with respect to the focal site (electrode 8). The association and time delays were assessed for successive 50% overlapping 500 msec epochs. For comparison the pictures on the left depict the average overall associations (top) and the average overall time delays (bottom; in milliseconds), as in Figure 2. There is a gradual increase in association strength before the start of the seizure and a steep drop in association strength at the end. Before the seizure, time delays are inconsistent, and there is often a zero time lag. During the seizure, time delays are always in the same direction, although the magnitude of the delay can vary.
Association strengths with the focal site. The corticocortical associations before and after the seizure were not constant. They were relatively high during non-REM sleep (slow delta waves and spindle-like activity) and relatively low during wakefulness (desynchronized EEG). Depending on the sleep-wake state before the seizure and whether the seizure started abruptly or gradually, there was either a slow or steep rise in association strength at the onset of the seizure. In Figure 5B for instance, the focal area shows a slow rise in association with other sites starting already before the appearance of typical SWDs. At the end of the seizure there is a sudden drop in association, corresponding to the abrupt end of the SWD activity. Thus, the association strength is highly dynamic, and it seems to follow the subtle changes in ECoG activity.
Time delays with respect to the focal site. During wakefulness there is usually zero time lag between channels. During slow-wave sleep, both zero time lags and other time delays between channels can be found. However, during the seizure, these time relationships change systematically. The focal site now starts to consistently lead the other channels (Fig. 5B). The values of these time delays (with respect to the focal area) are not constant throughout the seizure, but they can fluctuate, although they are always in the same direction. Often there is a gradual rise in time delay at the beginning of the seizure and a gradual decline again at the end of the seizure, the maximum time delay being reached somewhere in the middle part of the seizure. The time point at which this maximum is reached is not always the same for different electrodes.
Consistencies during the transition period. To investigate whether the transition between ongoing activity and SWD activity showed a consistent pattern, the association parameters were calculated for the 2 sec time window around seizure onset. To this end, statistics (mean, SEM, 95% confidence interval) were calculated for the 50% overlapping 500 msec epochs within this time window, for each individual animal over 8–10 seizures. The time point of the onset of the seizure (t = 0) was defined as the time of the peak of the first generalized spike. Typical examples can be found in Figure6. There was a gradual rise in association strength throughout the transition period, without any sudden changes.
Fig. 6.

Average corticocortical relationships during the transition period. The average (of 8 seizures) association (in %;middle) and time delay (in milliseconds;right) with SEMs (vertical bars) for two different sites (indicated by the black arrows on theleft) with respect to the focal site (Cx-8) are plotted for successive 50% overlapping 500 msec epochs. Values belonging to a given epoch are plotted at the mid time point of the corresponding epoch (for example, values plotted at t = 0.5 are derived from the 250–750 msec epoch). t = 0 denotes the onset of the generalized seizure (= peak of the first generalized spike). For both sites there is a gradual increase in association strength. The time delay between the two focal sites (Cx-8 andCx-4; top) does not differ significantly from zero. The time delay of a relatively distant site (Cx-2; bottom; with an average overall time delay of 10.2 msec; left) starts to differ significantly from zero with respect to the focal site during the transition epoch (−250 to +250 msec) and increases in value during the first second of the seizure.
Time delays, on the other hand, did show a sudden change at the time of the transition. Before the onset of the seizure (beforet = 0), time delays did not differ significantly from zero and usually had large SEMs, indicating that they were highly variable. However, during the transition epoch [the epoch around the onset of the seizure (−0.250 msec, +0.250 msec)], the SEMs decreased sharply, and time delays between focal and nonfocal sites started to differ significantly from zero. In some cases time delays increased during the first second of the seizure, indicating that the “transmission time” increased, i.e., the propagation velocity slowed down during the first second of the seizure.
Intra-thalamic relationships
Placement of thalamic electrodes
To investigate whether the observed cortical relationships are mirrored by corresponding thalamic relationships, the placement of a cortical grid was combined with implantation of depth electrodes in the thalamus in six animals. We were particularly interested in the VB complex (VPM and VPL nuclei), because this is the primary thalamic nucleus of the somatosensory system, thus providing the main source of specific thalamic input to the somatosensory cortex. Like the somatosensory cortex, the VB complex also has a somatotopic organization, with VPM representing the head and VPL representing the body and paws. Therefore, in all six animals, at least one electrode bundle was implanted in the VB complex. In four animals this was combined with a second electrode bundle in the VB complex in such a way that one bundle was placed in the lateral regions of the VB (i.e., VPL) and the other in more medial regions of the VB (i.e., VPM). In another two animals, the second electrode bundle was aimed at the ventrolateral (VL) nucleus, which is the primary thalamic nucleus of the motor system, providing specific thalamic input to the primary motor cortex, a cortical region found to lag behind the peri-oral region of the somatosensory cortex. In addition to the placement of electrodes in the VB complex and VL nucleus, all animals had electrodes located in the lateral dorsal (LD) nucleus.
Morphology of thalamic seizure activity
A typical example of thalamic seizure activity is shown in Figure7. The thalamic sites displayed rhythmic activity of 7–11 Hz in phase with the cortical spike-and-wave discharges. The thalamic discharges were characterized by slow negative waves combined with a positive sharp wave or positive spike, resulting in spindle-like activity with an arched appearance or discharges with a spike-wave morphology. At certain thalamic recording sites, the positive spike was preceded by a highly sharp (small) negative spike appearing on the decreasing slope of the negative wave. These highly sharp spike-and-wave discharges were found in VPM sites and in sites that were located in or close to the posterior complex, but not in other thalamic nuclei. These highly sharp spike-wave discharges were especially prominent at the beginning of the seizure. In addition to these highly sharp spikes during the seizure, the medial VPM sites that were found to be functionally related to the leading sites in the cortex showed other focal signs, in the sense that they could already display some small amplitude spikes or sharp rhythmic activity a few cycles before the generalized onset of the seizure (Fig. 7).
Nonlinear association analysis: overall relationships during the whole seizure
In contrast to what was found for the cortex, in the thalamus there was a not a general tendency for the strength of association to decrease with increasing electrode distance. The relationship between strength of association and electrode distance could be explained only poorly by linear regression (averageR2 =0.28; range, 0.10–0.43;n = 6 rats).
Considering the time delays between recording sites, a high degree of (near-)synchrony was encountered, although time lags between electrodes could also be found. However, the degree of synchrony and the magnitude of the time delays (range of maximum intra-individual time delay, 1.9–10.5 msec) were highly variable between animals. When the time delays were studied as a function of electrode distance, the observed relationship could be strongly explained by linear regression in animals H16 (R2 = 0.93) and H18 (0.65), less strongly in animals H15 (0.30) and H21 (0.32), and not at all in animals H19 (0.02) and H20 (0.00).
Time delays and anatomical location
In all animals the leading electrode was located in the LD nucleus, and in addition in the lateral posterior (LP) nucleus in animals H20 and H21. The electrode that displayed the highest time delay with respect to this leading site was found in the most ventral–medial recording site within the VPM in five of six animals. Only in animal H19 did the electrode in the VL have the highest time lag, although the only VPM electrode did not show a significant time delay with respect to this VL electrode. Thus, the intra-thalamic relationships as found by theh2 analysis do not correspond simply with the focal signs observed by visual inspection.
Relationships within the VB complex. Within the ventrobasal complex, synchrony was found between sites that were located along the same dorsoventral line (same ML coordinate, same vertical electrode bundle) in four animals (H15, H16, H20, H21). In two animals, time delays were found along the dorsoventral line, but in opposite directions (H18 and H19). Between sites with different ML coordinates (different electrode bundles), a time lag from the lateral to the medial direction (lateral site leading) was found in three animals (H16, H20, H21), whereas zero-lag synchrony was found in one animal (H15).
Relationships between VB complex and VL nucleus. Between sites in the ventrobasal complex on the one hand and the ventral lateral nucleus on the other hand, both synchrony and time delays different from zero were found in both animals (H18 and H19). However, the observed time delays appeared to be in opposite directions, with the VL leading in H18 and lagging behind in H19.
Thus, the intra-thalamic interrelationships are much less consistent across animals than the corticocortical relationships and cannot account for the observed corticocortical relationships.
Nonlinear association analysis: temporal dynamics
In general, associations between thalamic sites increased before or at the onset of the seizure and decreased again after the cessation of the seizure. The strength of association was fairly constant throughout the seizure, except when there was a sudden change in morphology in one of the channels. Time delays fluctuated a little in magnitude but not in direction.
Corticothalamic relationships
Visual inspection of cortical and thalamic signals
An example of simultaneously recorded cortical and thalamic signals can be found in Figure 7. The thalamic discharges were in phase with the cortical ones. The leading cortical sites could start to display rhythmic activity or SWDs a few cycles earlier than the other cortical sites. The same could be found for VPM sites that were functionally related to the leading cortical sites, as compared with the other thalamic sites. Either the related cortical and thalamic sites started to display rhythmic activity or SWDs simultaneously or the cortical sites started a few cycles earlier than the thalamic sites. Furthermore, thalamic SWDs could transiently disappear during the course of a cortical train of SWDs (data not shown). Hence, cortical spike-and-waves could sometimes occur without concomitant thalamic spike-and-waves, whereas the reverse was never observed.
Nonlinear association analysis: overall relationships during the whole seizure
For the assessment of corticothalamic relationships, combinations of cortical and thalamic recording sites were taken into account only if their functional interconnectivity could be established in three independent ways (histology, SEPs, and thalamic electrical stimulation; see Materials and Methods, Signal analysis). The average overall corticothalamic association strengths for a whole seizure, taken as one epoch, were relatively low (20–50%) compared with corticocortical and intra-thalamic values. There was a large range of average time delays [i.e., ranging from +29.3 msec (= thalamus leading) to −16.5 msec (= cortex leading)], with different values for different electrode pairs, both within animals and between animals. These average time delays often had large SEMs, indicating that for a given electrode pair there was no consistency in overall time lags across seizures. The distribution of the time delays for individual seizures, however, was not normal but bimodal (Fig. 8a), with maxima around −10 msec (cortex leading) and +20 msec (thalamus leading).
Fig. 8.

Thalamocortical relationships in rat H16.A, Distribution of the overall thalamocortical time delays (= time delay when whole seizure is analyzed as one epoch) for individual seizures (n = 10) for the combinations of cortical and thalamic sites, which were shown to be interconnected as indicated by the black and grayarrows in the schematic drawing on theright. The time delays τ (in milliseconds) are bimodally distributed with both positive and negative delays, corresponding to either thalamus “leading” orcortex “leading.”B, Thalamocortical association strengths and time delays for the 500 msec epochs during the transition to a seizure for the electrode pair with a cortical focus (Th-B4 and Cx-f), indicated by the black arrow in the schematic drawing underA. The left panel shows theh2(τ) plots (association as a function of time delay) for three successive 50% overlapping epochs during a single seizure. Time point 0 indicates the onset of the seizure (appearance of the first generalized spike). During the first 500 msec of the seizure, the h2(τ) plot is characterized by a clear maximum at a negative time delay, indicating that the cortex is leading. In the successive epochs, a maximum at a positive time delay, corresponding to thalamus leading, appears. During the second 500 msec of the seizure the latter maximum has become larger than the former maximum. The right panel shows the time evolution of the average association parameters over seizures (mean ± SEM; n = 10 seizures) during the transition phase. Values belonging to a given epoch are plotted at the mid time point of the corresponding epoch (for example, values plotted at t = 0.5 are derived from the 250–750 msec epoch). A steady rise in the strength of association can be noticed at the top. At thebottom, before onset of the seizure there is a large variation in time delay. During the first 500 msec of the seizure, however (time point 0.25 sec; epoch 0–500 msec), this variation decreases to almost zero, resulting in a significant negative time delay, which signifies that the cortex consistently leads the thalamus. After this first seizure epoch the variation in time delay increases again, resulting in values that do not differ significantly from zero.
Nonlinear association analysis: temporal dynamics
To study these corticothalamic relationships in more detail, we analyzed successive, 50% overlapping, epochs of 500 msec. Before and after the seizure, the association was usually too low (<25%) to estimate a time delay. Throughout a seizure, association values could fluctuate between 30 and 80%. Time delays could also fluctuate throughout the seizure, with the values being either negative (cortex leading) or positive (thalamus leading), but never around zero. This highly nonstationary behavior is reflected in the shape of theh2(τ) plots (Fig.8B). These plots often had a bimodal curve with maxima around −10 msec and +20 msec. The amplitude of these maxima and the amplitude difference between them, however, could vary, such that for some epochs the overall maximum corresponded to “thalamus leading” and for other epochs it corresponded to “cortex leading.” This suggests that instead of one structure exclusively driving the other one, both thalamus and cortex influence each other (bi-directional coupling). In contrast to this, theh2(τ) plots of the corticocortical and intra-thalamic associations usually had only one clear maximum (results not shown).
Consistencies during the transition period
A typical example of the average dynamics of the association parameters for a cortical focus site can be found in Figure8B, showing the results for rat H16. There was a high variation in time delays before onset of the seizure. However, during the first 500 msec of the seizure, this variation suddenly decreased and the cortex significantly led the thalamus (according to the 95% confidence interval, n = 10 seizures). In subsequent epochs the variation increased again, and time delays did not differ significantly from zero. Similar findings were obtained for the other animals for the cortical focus site. In five of six animals (Fig.9), the variation suddenly decreased at the start of the seizure, with the cortex significantly leading the thalamus. In rats H15, H16, and H18, this was found for the 0–500 msec epoch, and in rats H20 and H21 it was found for the −250 to +250 msec epoch. In these latter two rats, SWD activity at the focal sites started a few cycles before the generalized onset of the seizure, which was defined as t = 0. The epoch after this first seizure epoch did not show consistency across animals. In one animal (H19), however, there was no such decrease in variation, but in this animal we obtained values for time delay from only three seizures. Nevertheless, the mean time delays at 0.25 and 0.5 sec were also negative.
Fig. 9.

Thalamocortical time delays (mean ± SEM;n = 8–10 seizures) for successive 50% overlapping 500 msec epochs for a cortical focus site in four other rats. Before onset of the seizure there is usually a large variation, and time delays do not differ significantly from zero. In all animals, however, this variation decreases at the start of the seizure, resulting in a significant negative time delay, corresponding to consistent leading by the cortex. In rats H15, H16 (Fig. 8), and H18, this occurs for the 0–500 msec epoch; in rats H20 and H19, this occurs for the −250 to +250 msec epoch. After this initial seizure epoch, consistency across animals (or across electrode combinations) is lost. Time delays do not differ significantly from zero in rats H15, H16 (Fig. 8), and H18, whereas in rat H20 the thalamus consistently starts to lead and in H21 the cortex continues to lead.
Nonlinear association coefficienth2 compared with the linear correlation coefficient r2
The currently applied method of nonlinear association is suitable to establish interrelationships between signals whether the relationship between the two signals is linear or nonlinear. Therefore, it is more general and more sensitive than the linear correlation or cross-correlation. If the interrelationship between the two signals is purely linear, the nonlinear association coefficienth2 gives values that are equal to the ordinary linear correlation (or cross-correlation) coefficientr2; otherwise,h2 gives larger values thanr2.
For the corticocortical and intra-thalamic relationships,h2 turned out to be similar to or only marginally (∼10%) larger thanr2, indicating that there was only a very small nonlinear component, and thus the relationship between signals was approximately linear.
For the thalamocortical relationships, however, relatively larger differences could be found between theh2 curve and ther2 curve. This could result in the h2 maximum being substantially larger than ther2 maximum, or even in the appearance of an additional maximum in theh2 curve as compared with ther2 curve. Hence, computingh2 instead ofr2 could not only result in larger association values, but in some cases it could also result in a change of the direction of the time delay. This indicates that the corticothalamic coupling can have a significant nonlinear component. This further implies that if we had usedr2 instead ofh2, we would not have been able to detect significant thalamocortical couplings, and we would not have been able to reveal the consistent direction of the coupling from cortex to thalamus at the start of the seizure.
Summarized results
All the typical characteristics of the corticocortical, intra-thalamic, and thalamocortical interrelationships are summarized in Figure 10 and Table 2 for the case of rat H16. A consistent cortical focus was found within the peri-oral subregion of the somatosensory cortex, i.e., in the areas corresponding to the nose, upper lip, and vibrissae. The location of the focus as found by nonlinear association analysis was supported by focal signs that were observed in the electrocorticogram by visual inspection. Other cortical sites were consistently found to lag behind this focal site, with time delays that increased with electrode distance, corresponding to a “whole seizure” propagation velocity of 1 m/sec in this case (1.4 m/sec average over animals). The location of the focus was stationary throughout the seizure, but the time delays with respect to the lagging sites could vary. The propagation velocity was higher at the beginning and end of the seizure.
Fig. 10.

Summary of the corticocortical (represented by the black arrows), intra-thalamic (light gray arrows), and corticothalamic (dark gray arrows) interdependencies during spontaneous absence seizures in the WAG/Rij rat as established by the nonlinear association analysis (values for associations and time delays are derived from rat H16 and can be found in detail in Table 2). The thickness of thearrow represents the average strength of the association, and the direction of thearrowhead points to the direction of the lagging site. The values represent the corresponding average time delays in milliseconds. For this rat, 10 seizures were analyzed.A, The relationships as found for the first 500 msec of the generalized seizure. A consistent cortical focus was found in the upper lip and nose area of the somatosensory cortex (SmI), because this site consistently led the other cortical recording sites. The hindpaw area, for instance, was found to lag by 2.9 msec on average with respect to this focal site. Within the thalamus, the laterodorsal (LD) nucleus was found to consistently lead other thalamic sites. The ventroposterior medial (VPM) nucleus was found to lag behind the ventroposterior lateral (VPL) nucleus, with an average time delay of 4.3 msec. Concerning corticothalamic interrelationships, the cortical focus site consistently led the thalamus (VPM), with an average time delay of 8.1 msec. Within the somatosensory system of the hindpaw, the (nonfocal) cortical site led the thalamic site (VPL) during 3 of 10 seizures; the thalamus led the cortex during 1 seizure, whereas for the other 6 seizures no direction of the delay could be established.B, The relationships as found when the whole seizure is analyzed as one epoch. The same cortical focus as during the first 500 msec was found consistently. Compared with the first 500 msec, the time delay from the cortical focus with respect to the nonfocal cortical sites has increased. Furthermore, the strength of association between VPL and VPM has increased. The direction of the corticothalamic couplings has changed. For the nonfocal cortical sites, the thalamus was found to lead during all seizures. For the focal cortical site, the cortex was found to lead during two seizures, whereas the thalamus was found to lead during seven seizures.
Table 2.
Corticocortical, corticothalamic, and intra-thalamic relationships in rat H16
| Leading site | Lagging site | First 500 msec | Whole seizure | |||||||
|---|---|---|---|---|---|---|---|---|---|---|
| Association (%) | Time delay (msec) | Association (%) | Time delay (msec) | |||||||
| Mean | Mean | Range | n | Mean | Mean | Range | n | |||
| A | Cx − focus | → Cx − HP | 56.2 | 2.9 | 1.5–5.5 | 10 | 54.2 | 4.9 | 4.0–6.5 | 9 |
| B | Th − VPM | → Cx − focus | 0 | 38.7 | 18.4 | 15.5–20.0 | 7 | |||
| Cx − focus | → Th − VPM | 41.0 | 8.1 | 7.0–10.0 | 8 | 26.1 | 8.8 | 8.5–9.0 | 2 | |
| B | Th − VPL | → Cx − HP | 23.4 | 30.0 | 1 | 28.6 | 29.3 | 24.0–32.5 | 6 | |
| Cx − HP | → Th − VPL | 30.5 | 11.7 | 7.5–15.5 | 3 | 0 | ||||
| C | Th − VPL | → Th − VPM | 69.1 | 4.3 | 3.0–6.5 | 10 | 80.0 | 3.1 | 2.5–3.5 | 9 |
| C | Th − LD | → Th − VPM | 47.8 | 6.1 | 3.5–10.0 | 8 | 47.5 | 9.9 | 6.5–12.0 | 9 |
Summary of the corticocortical (A), corticothalamic (B), and intra-thalamic (C) interdependencies during spontaneous absence seizures (n = 10) in rat H16. The values for the strength of association (%) and time delay (msec) are given both for the first 500 msec and for the whole duration of the seizure. Direction-specific averages were made for the association parameters. For the corticocortical (A) and intra-thalamic (C) associations, the delay was always found in the same direction, and thus averages were made of all seizures for which a time delay could be established. For the corticothalamic associations, however, delays were found in both directions, and thus separate averages were made for those cases in which the thalamus was leading and for those cases in which the cortex was leading.
In the thalamus, consistent focal signs were found by visual inspection at the VPM sites that were mutually connected to the focal cortical sites. However, these findings were not supported by the results of theh2 analysis, which suggested that the LD nucleus was the leading site, whereas the VPL led the VPM. Furthermore, a large degree of near-synchrony was found.
The overall direction of the coupling between mutually connected cortical and thalamic sites varied for different seizures, and for short epochs the direction could also change throughout the seizure. However, during the first 500 msec of the seizure the cortical focus was consistently found to lead the thalamus.
DISCUSSION
The analysis of spontaneous bilaterally generalized SWDs in freely moving WAG/Rij rats revealed a consistent cortical focus and suggested a fast intracortical spread of seizure activity. Cortical and thalamic sites influenced each other, but during the first 500 msec of the seizure the cortical focus consistently led the thalamus.
Cortical focus and fast intracortical spread of seizure activity
The location of the cortical focus was always found in the somatosensory cortical area where nose and upper lip are represented, in some animals extending to the area of the vibrissae. Interestingly, these body parts show rhythmical tremor during the SWDs.
This cortical focus was revealed using advanced signal analysis methods. It was found to be the leading site by a few milliseconds with respect to other cortical areas. This focus was highly stationary throughout the seizure and among different seizures of the same rat. The SWDs at the nonfocal sites showed consistent overall time lags, corresponding to an average intra-hemispheric propagation velocity of 1.4 m/sec. Within one seizure, however, the magnitude of the time delays was time dependent, with the exact evolution varying for different sites. If only these distant sites had been recorded, erroneous conclusions (e.g., shifting focus or inconsistent time differences) might have been drawn. This emphasizes the significance of a high spatial sampling to study these phenomena.
The intra-hemispheric corticocortical time delays that we found during SWDs were similar to those found during SEPs. Furthermore, the same speed of spread (1 m/sec) of activity through the neocortex has been observed for evoked thalamocortical responses in the rat (Castro-Alamancos and Connors, 1996). This is evidence that the propagation is mediated through normal synaptic pathways, likely consisting of short- and long-range horizontal fibers (Szentágothai, 1978), with the intra-hemispheric pathways being slower than the inter-hemispheric myelinated callosal fibers.
The existence of such a cortical focus and cortical propagation pattern of seizure activity has never been observed in other animal models of spontaneous bilaterally generalized SWDs. However, a comparable intracortical propagation speed of seizure activity has been observed in other models. In cat, self-sustained cortically generated 2–4 Hz SWDs with a morphological resemblance to human absence spike-and-wave, but without the typical bilateral generalization, could be found to spread to areas at 10 mm distance with time lags as short as 3–10 msec (Steriade and Amzica, 1994; Neckelmann et al., 1998), obeying the rules of synaptic circuits (Steriade and Amzica, 1994). In line with this, a 5 msec time difference has been observed between frontal and occipital areas in picrotoxin-induced 5–7 Hz SWDs in rat (Medvedev et al., 1996). Pentylenetetrazol or electrically induced generalized SWDs in the rabbit propagated at a slightly slower speed of 10−1 m/sec (Petsche and Sterc, 1968). Deep transcortical cuts in both the cat (Neckelmann et al., 1998) and rabbit model (Petsche and Rappelsberger, 1970) disrupted the propagation and synchronization between areas, showing that these processes are mediated by intracortical connections.
The present results suggest that the large-scale synchronization during generalized SWDs primarily arises from intracortical processes. This is corroborated by the demonstration that the majority of the intracortical extracellular currents underlying SWDs in the WAG/Rij rat result from activation of intracortical circuits (Kandel and Buzsáki, 1997). In line with this, we recently found that the RTN–TCR network is not necessary for hypersynchronization in the thalamocortical network, because WAG/Rij rats with lesions of the RTN but largely intact TCR nuclei showed abundant thalamocortical paroxysmal oscillations, albeit of a lower frequency than SWDs in intact animals (H. K. M. Meeren, T. A. E. Möderscheim, J. G. Veening, A. M. L. Coenen, and E. L. J. M. van Luijtelaar, unpublished observation).
The former conclusion is consistent with the findings that the cortex plays a major role in the synchronization of other types of thalamocortical oscillations, such as sleep spindles in cats (Contreras and Steriade, 1996; Contreras et al., 1996) and α rhythm in dogs (Lopes da Silva et al., 1973, 1980).
Cortical focus initiates the oscillation in the thalamocortical–corticothalamic loop
A frequently raised question is whether the primary driving source of SWDs resides in the cortex or in the thalamus. Our results clearly show that during the first 500 msec of the seizure the cortex led the thalamus. This indicates that the cortical focus is the main driving factor in initiating the paroxysmal oscillation within the corticothalamocortical loop. After this initial period the time relations between cortex and thalamus could switch directions in an unpredictable way, indicating that during the sustainment of the SWDs, cortex and thalamus form a unified oscillatory network. The leading role for the cortex is supported by our observation that cortical spike-and-waves could sometimes occur without concomitant thalamic spike-and-waves, whereas the reverse was never observed. This is corroborated by findings in the cat that cortical spike-wave seizures could still be recorded after ipsilateral thalamectomy (Steriade and Contreras, 1998).
Our present findings appear not to be consistent with the cellular relationships between cortex and thalamus as found in anesthetized WAG/Rij rats, in which EEG spike-triggered averaged cortical multiunits were found to lag only behind thalamic units, not to lead (Inoue et al., 1993), a result that was later confirmed (Seidenbecher et al., 1998) in the Genetic Absence Epilepsy Rats from Strasbourg [GAERS, a model similar to the WAG/Rij rat; see Vergnes et al. (1982) and Danober et al. (1998)]. In both of these studies, however, recordings were obtained from only one cortical site, which was relatively far from the focal site as identified by us. Accordingly, these results were likely biased toward late cortical units. Nevertheless, in GAERS, rhythmic unit firing was reported to start a few cycles earlier in the cortex than in the thalamus, and cortical units significantly led thalamic units at the start of the SWDs (Seidenbecher et al., 1998), supporting the view that the cortex initiates the paroxysmal oscillations.
Important additional evidence for this notion comes from intracellular recordings of TCR neurons in GAERS. At the start of a train of SWDs, all recorded neurons displayed rhythmic sequences of EPSPs followed by IPSPs (Pinault et al., 1998), implying that they were driven by excitatory input, most likely from the cortex. Thereafter, 93% of neurons continued to display this activation pattern, whereas only 7% showed low-threshold calcium currents, presumably deinactivated by the inhibitory actions of RTN neurons. In addition, simultaneous cortical and thalamic intracellular, extracellular, and field potential recordings during cortical spike-wave seizures in cat demonstrated that phasic IPSPs and post-inhibitory rebound spike bursts occurring in a subsample of TCR neurons clearly followed the cortical events, whereas most of the TCR cells (60%) were tonically hyperpolarized (Steriade and Contreras, 1995).
The present results are in full agreement with the findings in the FPGE model, in which EEG spike-concurrent firing patterns developed a few cycles earlier in the cortex than in the thalamus. Once SWDs were fully developed, thalamic single units tended to fire either before or after the cortical unit (Avoli et al., 1983).
Highly similar corticothalamic dynamics have been found for a 7–12 Hz oscillation occurring in the somatosensory system during attentive immobility (comparable to human μ rhythm) in the behaving rat (Nicolelis et al., 1995). This rhythm occurred as a traveling wave in the cortex; it was found to start in the cortex before spreading to the thalamus one or a few cycles later, and throughout the oscillation cortical neurons tended to lead thalamic neurons.
Implications for the pathophysiology of generalized epilepsy
The present experiments demonstrated the existence of a cortical focus and suggest a fast intracortical spread of seizure activity as the mechanism of primary generalization of spontaneous SWDs in the WAG/Rij rat, a genetic model of absence epilepsy. We propose that these mechanisms may form the basis for a hypothesis concerning the pathophysiology of human generalized epilepsy.
This hypothesis challenges two common assumptions. First, instead of being nonfocal, generalized seizures are of focal origin. The generalized and apparent “synchronous” character of the SWDs from the outset is caused by an extremely fast cortical spread of seizure activity. Second, the primary driving source for the rhythmic discharges is not the thalamus but the cortex. However, after the oscillation has been set into motion, cortex and thalamus form a unified oscillatory network in which both structures drive each other. The role of the thalamus probably lies in providing a resonant circuitry to amplify and sustain the rhythmic discharges.
Several findings from patients with generalized epilepsy are in line with the current hypothesis (Niedermeyer, 1996). An extensive clinical study suggested a cortical origin with maximal frontal lobe involvement (Niedermeyer, 1972), and consistent EEG focalities have been detected (Lombroso, 1997). Early studies by Petsche (1962) showed preferred points of origin of human absence spike-and-wave and directional spread over the scalp with a speed of 2–15 m/sec by use of a vector technique and toposcopic method. Investigation of these phenomena with today's advanced acquisition and post-processing techniques should be able to reveal whether the mechanism of a cortical focus with fast cortical propagation is unique for the WAG/Rij rat or whether it is a general principle that governs the immediate widespread synchronization of large-scale cortical networks in generalized epilepsy.
Footnotes
This study was supported by the Dutch Organization for Scientific Research, Grant 575-58-057. We thank Willie van Schaijk and Gerard van Ooyen for the development of the head-connector and their expert electrotechnical assistance. We are grateful to Dr. Hans Beldhuis for his advice on experimental techniques, Elly Willems-van Bree for preparing chemical solutions, Hans Krijnen and Jean-Paul Dibbets for animal care, and Wouter Blanes for help with data transfer. We are furthermore indebted to the Department of Anatomy of the University Medical Centre St. Radboud for providing histological facilities.
REFERENCES
- 1.Avanzini G, Panzica F, De Curtis M. The role of the thalamus in vigilance, epileptogenic mechanisms. Clin Neurophysiol. 2000;111[Suppl 2]:S19–S26. doi: 10.1016/s1388-2457(00)00398-9. [DOI] [PubMed] [Google Scholar]
- 2.Avoli M, Gloor P, Kostopoulos G, Gotman J. An analysis of penicillin-induced generalized spike and wave discharges using simultaneous recordings of cortical and thalamic single neurons. J Neurophysiol. 1983;50:819–837. doi: 10.1152/jn.1983.50.4.819. [DOI] [PubMed] [Google Scholar]
- 3.Buzsáki G. The thalamic clock: emergent network properties. Neuroscience. 1991;41:351–364. doi: 10.1016/0306-4522(91)90332-i. [DOI] [PubMed] [Google Scholar]
- 4.Castro-Alamancos MA, Connors BW. Spatiotemporal properties of short-term plasticity in sensorimotor thalamocortical pathways of the rat. J Neurosci. 1996;16:2767–2779. doi: 10.1523/JNEUROSCI.16-08-02767.1996. [DOI] [PMC free article] [PubMed] [Google Scholar]
- 5.Chapin JK, Lin CS. Mapping the body representation in the SI cortex of anesthetized and awake rats. J Comp Neurol. 1984;229:199–213. doi: 10.1002/cne.902290206. [DOI] [PubMed] [Google Scholar]
- 6.Coenen AML, Drinkenburg WHIM, Peeters BWMM, Vossen JMH, Van Luijtelaar ELJM. Absence epilepsy and the level of vigilance in rats of the WAG/Rij strain. Neurosci Biobehav Rev. 1991;15:259–263. doi: 10.1016/s0149-7634(05)80005-3. [DOI] [PubMed] [Google Scholar]
- 7.Coenen AML, Drinkenburg WHIM, Inoue M, Van Luijtelaar ELJM. Genetic models of absence epilepsy, with emphasis on the WAG/Rij strain of rats. Epilepsy Res. 1992;12:75–86. doi: 10.1016/0920-1211(92)90029-s. [DOI] [PubMed] [Google Scholar]
- 8.Contreras D, Steriade M. Spindle oscillations in cats: the role of corticothalamic feedback in a thalamically generated rhythm. J Physiol (Lond) 1996;490:159–179. doi: 10.1113/jphysiol.1996.sp021133. [DOI] [PMC free article] [PubMed] [Google Scholar]
- 9.Contreras D, Destexhe A, Sejnowski TJ, Steriade M. Control of spatiotemporal coherence of a thalamic oscillation by corticothalamic feedback. Science. 1996;274:771–774. doi: 10.1126/science.274.5288.771. [DOI] [PubMed] [Google Scholar]
- 10.Danober L, Deransart C, Depaulis A, Vergnes M, Marescaux C. Pathophysiological mechanisms of genetic absence epilepsy in the rat. Prog Neurobiol. 1998;55:27–57. doi: 10.1016/s0301-0082(97)00091-9. [DOI] [PubMed] [Google Scholar]
- 11.Drinkenburg WHIM, Coenen AML, Vossen JMH, Van Luijtelaar ELJM. Spike-wave discharges and sleep-wake states in rats with absence epilepsy. Epilepsy Res. 1991;9:218–224. doi: 10.1016/0920-1211(91)90055-k. [DOI] [PubMed] [Google Scholar]
- 12.Drinkenburg WHIM, Van Luijtelaar ELJM, Coenen AML. Information processing during aberrant electroencephalographic activity in rats: motor responses and stimulus evaluation. In: Bonke B, Bovill JG, Moerman N, editors. Memory and awareness in anesthesia III. Van Gorcum; Assen, The Netherlands: 1996. pp. 186–196. [Google Scholar]
- 13.Flint AC, Connors BW. Two types of network oscillations in neocortex mediated by distinct glutamate receptor subtypes and neuronal populations. J Neurophysiol. 1996;75:951–956. doi: 10.1152/jn.1996.75.2.951. [DOI] [PubMed] [Google Scholar]
- 14.Gloor P, Avoli M, Kostopoulos G. Thalamocortical relationships in generalized epilepsy with bilaterally synchronous spike-and-wave discharge. In: Avoli M, Gloor P, Kostopoulos G, Naquet R, editors. Generalized epilepsy: neurobiological approaches. Birkhäuser; Boston: 1990. pp. 190–212. [Google Scholar]
- 15.Inoue M, Duysens J, Vossen JMH, Coenen AML. Thalamic multiple-unit activity underlying spike-wave discharges in anesthetized rats. Brain Res. 1993;612:35–40. doi: 10.1016/0006-8993(93)91641-5. [DOI] [PubMed] [Google Scholar]
- 16.Jasper HH, Droogleever-Fortuyn J. Experimental studies of the functional anatomy of petit mal epilepsy. Res Publ Ass Res Nerve Ment Dis Proc. 1947;26:272–298. [Google Scholar]
- 17.Jasper HH, Kershman J. Electroencephalographic classification of the epilepsies. Arch Neurol Psychiat (Chicago) 1941;45:903–943. [Google Scholar]
- 18.Kandel A, Buzsáki G. Cellular-synaptic generation of sleep spindles, spike-and-wave discharges, and evoked thalamocortical responses in the neocortex of the rat. J Neurosci. 1997;17:6783–6797. doi: 10.1523/JNEUROSCI.17-17-06783.1997. [DOI] [PMC free article] [PubMed] [Google Scholar]
- 19.Lombroso CT. Consistent EEG focalities detected in subjects with primary generalized epilepsies monitored for two decades. Epilepsia. 1997;38:797–812. doi: 10.1111/j.1528-1157.1997.tb01467.x. [DOI] [PubMed] [Google Scholar]
- 20.Lopes da Silva FH, Pijn JP, Boeijinga P. Interdependence of EEG signals: linear vs. nonlinear associations and the significance of time delays and phase shifts. Brain Topogr. 1989;2:9–18. doi: 10.1007/BF01128839. [DOI] [PubMed] [Google Scholar]
- 21.Lopes da Silva FH, Van Lierop THMT, Schrijer CF, Storm van Leeuwen W. Organization of thalamic and cortical alpha rhythms: spectra and coherences. Electroencephalogr Clin Neurophysiol. 1973;35:627–639. doi: 10.1016/0013-4694(73)90216-2. [DOI] [PubMed] [Google Scholar]
- 22.Lopes da Silva FH, Vos JE, Mooibroek J, Van Rotterdam A. Relative contributions of intracortical and thalamo-cortical processes in the generation of alpha rhythms, revealed by partial coherence analysis. Electroencephalogr Clin Neurophysiol. 1980;50:449–456. doi: 10.1016/0013-4694(80)90011-5. [DOI] [PubMed] [Google Scholar]
- 23.McCormick DA, Bal T. Sleep and arousal: thalamocortical mechanisms. Annu Rev Neurosci. 1997;20:185–215. doi: 10.1146/annurev.neuro.20.1.185. [DOI] [PubMed] [Google Scholar]
- 24.Medvedev A, Mackenzie L, Hiscock JJ, Willoughby JO. Frontal cortex leads other brain structures in generalised spike-and-wave spindles and seizure spikes induced by picrotoxin. Electroencephalogr Clin Neurophysiol. 1996;98:157–166. doi: 10.1016/0013-4694(95)00225-1. [DOI] [PubMed] [Google Scholar]
- 25.Meeren HKM, Ates N, Coenen AML, Van Luijtelaar ELJM, Drinkenburg WHIM. Cortical spreading depression suppresses spike-wave discharges in the WAG/Rij rat. Soc Neurosci Abstr. 1997;23:808. [Google Scholar]
- 26.Meeren HKM, Möderscheim TAE, Coenen AML, Van Luijtelaar ELJM. Unilateral thalamic lesions produce bilateral effects on spike-wave discharges in a genetic model of absence epilepsy. Eur J Neurosci. 1998;10[Suppl 10]:49. [Google Scholar]
- 27.Midzianovskaia IS, Kuznetsova GD, Coenen AML, Spiridonov AM, Van Luijtelaar ELJM. Electrophysiological, pharmacological characteristics of two types of spike-wave discharges in WAG/Rij Rats. Brain Res. 2001;911:62–70. doi: 10.1016/s0006-8993(01)02705-6. [DOI] [PubMed] [Google Scholar]
- 28.Neckelmann D, Amzica F, Steriade M. Spike-wave complexes and fast components of cortically generated seizures. III. Synchronizing mechanisms. J Neurophysiol. 1998;80:1480–1494. doi: 10.1152/jn.1998.80.3.1480. [DOI] [PubMed] [Google Scholar]
- 29.Nicolelis MAL, Baccala LA, Lin RCS, Chapin JK. Sensorimotor encoding by synchronous neural ensemble activity at multiple levels of the somatosensory system. Science. 1995;268:1353–1358. doi: 10.1126/science.7761855. [DOI] [PubMed] [Google Scholar]
- 30.Niedermeyer E. The generalized epilepsies–a clinical electroencephalographic study. Charles C. Thomas; Springfield, IL: 1972. [Google Scholar]
- 31.Niedermeyer E. Primary (idiopathic) generalized epilepsy and underlying mechanisms. Clin Electroencephalogr. 1996;27:1–21. doi: 10.1177/155005949602700103. [DOI] [PubMed] [Google Scholar]
- 32.Paxinos G, Watson C. The rat brain in stereotaxic coordinates. Academic; Sydney: 1986. [DOI] [PubMed] [Google Scholar]
- 33.Peeters BWMM, Spooren WPJM, Van Luijtelaar ELJM, Coenen AML. The WAG/Rij model for absence epilepsy: anticonvulsant drug evaluation. Neurosci Res Commun. 1988;2:93–97. [Google Scholar]
- 34.Penfield W, Jasper HH. Epilepsy and the functional anatomy of the human brain. Little, Brown; Boston: 1954. [Google Scholar]
- 35.Petsche H. Pathophysiologie und Klinik des Petit Mal. Toposkopische Untersuchungen zur Phänomenologie des Spike-Wave-Musters. Wien Z Nervenheilkd Grenzgeb. 1962;19:345–442. [Google Scholar]
- 36.Petsche H, Rappelsberger P. Influence of cortical incisions on synchronization pattern and travelling waves. Electroencephalogr Clin Neurophysiol. 1970;28:592–600. doi: 10.1016/0013-4694(70)90201-4. [DOI] [PubMed] [Google Scholar]
- 37.Petsche H, Sterc J. The significance of the cortex for the travelling phenomenon of the brain. Electroencephalogr Clin Neurophysiol. 1968;25:11–22. doi: 10.1016/0013-4694(68)90081-3. [DOI] [PubMed] [Google Scholar]
- 38.Pijn JPM. PhD thesis. University of Amsterdam; 1990. Quantitative evaluation of EEG signals in epilepsy: nonlinear associations, time delays and nonlinear dynamics. [Google Scholar]
- 39.Pijn JPM, Vijn PCM, Lopes da Silva FH, Van Emde Boas W, Blanes W. The use of signal-analysis for the localization of an epileptogenic focus: a new approach. Adv Epileptology. 1989;17:272–276. [Google Scholar]
- 40.Pinault D, Leresche N, Charpier S, Deniau JM, Marescaux C, Vergnes M, Crunelli V. Intracellular recordings in thalamic neurones during spontaneous spike and wave discharges in rats with absence epilepsy. J Physiol (Lond) 1998;509:449–456. doi: 10.1111/j.1469-7793.1998.449bn.x. [DOI] [PMC free article] [PubMed] [Google Scholar]
- 41.Seidenbecher T, Staak R, Pape H-C. Relations between cortical and thalamic cellular activities during absence seizures in rats. Eur J Neurosci. 1998;10:1103–1112. doi: 10.1046/j.1460-9568.1998.00123.x. [DOI] [PubMed] [Google Scholar]
- 42.Silva LR, Amitai Y, Connors BW. Intrinsic oscillations of neocortex generated by layer 5 pyramidal neurons. Science. 1991;251:432–435. doi: 10.1126/science.1824881. [DOI] [PubMed] [Google Scholar]
- 43.Steriade M, Amzica F. Dynamic coupling among neocortical neurons during evoked and spontaneous spike-wave seizure activity. J Neurophysiol. 1994;72:2051–2069. doi: 10.1152/jn.1994.72.5.2051. [DOI] [PubMed] [Google Scholar]
- 44.Steriade M, Contreras D. Relations between cortical and thalamic cellular events during transitions from sleep patterns to paroxysmal activity. J Neurosci. 1995;15:623–642. doi: 10.1523/JNEUROSCI.15-01-00623.1995. [DOI] [PMC free article] [PubMed] [Google Scholar]
- 45.Steriade M, Contreras D. Spike-wave complexes and fast components of cortically generated seizures. I. Role of neocortex and thalamus. J Neurophysiol. 1998;80:1439–1455. doi: 10.1152/jn.1998.80.3.1439. [DOI] [PubMed] [Google Scholar]
- 46.Steriade M, Llinás RR. The functional states of the thalamus and the associated neuronal interplay. Physiol Rev. 1988;68:649–742. doi: 10.1152/physrev.1988.68.3.649. [DOI] [PubMed] [Google Scholar]
- 47.Steriade M, Jones EG, McCormick DA. Thalamus, Vol I: organisation and function. Elsevier; Amsterdam: 1997. [Google Scholar]
- 48.Szentágothai J. Specificity versus (quasi-) randomness in cortical connectivity. In: Brazier MAB, Petsche H, editors. Architectonics of the cerebral cortex. Raven; New York: 1978. pp. 77–97. [Google Scholar]
- 49.Van Luijtelaar ELJM, Coenen AML. Two types of electrocortical paroxysms in an inbred strain of rats. Neurosci Lett. 1986;70:393–397. doi: 10.1016/0304-3940(86)90586-0. [DOI] [PubMed] [Google Scholar]
- 50.Van Luijtelaar ELJM, Van der Werf SJ, Vossen JMH, Coenen AML. Arousal, performance and absence seizures in rats. Electroencephalogr Clin Neurophysiol. 1991;79:430–434. doi: 10.1016/0013-4694(91)90208-l. [DOI] [PubMed] [Google Scholar]
- 51.Vergnes M, Marescaux C, Micheletti G, Reis J, Depaulis A, Rumbach L, Warter JM. Spontaneous paroxysmal electroclinical patterns in rat: a model of generalized non-convulsive epilepsy. Neurosci Lett. 1982;33:97–101. doi: 10.1016/0304-3940(82)90136-7. [DOI] [PubMed] [Google Scholar]
- 52.Welker C. Microelectrode delineation of fine grain somatotopic organization of (SmI) cerebral neocortex in albino rat. Brain Res. 1971;26:259–275. [PubMed] [Google Scholar]
- 53.Wendling F, Bartolomei F, Bellanger JJ, Chauvel P. Interpretation of interdependencies in epileptic signals using a macroscopic physiological model of the EEG. Clin Neurophysiol. 2001;112:1201–1218. doi: 10.1016/s1388-2457(01)00547-8. [DOI] [PubMed] [Google Scholar]
- 54.Williams D. A study of thalamic and cortical rhythms in petit mal. Brain. 1953;76:50–69. doi: 10.1093/brain/76.1.50. [DOI] [PubMed] [Google Scholar]
- 55.Woolsey CN. Organization of somatic sensory and motor areas of the cerebral cortex. In: Harlow HF, Woolsey CN, editors. Biological and biochemical bases of behavior. University of Wisconsin; Madison, WI: 1958. pp. 63–81. [Google Scholar]