

Abstract
Responses of low-frequency neurons in the inferior colliculus (IC) of anesthetized guinea pigs were recorded to interaural phase modulation (IPM) before, during, and after iontophoresis of bicuculline, an antagonist to the inhibitory neurotransmitter GABA. Sensitivity to the direction of virtual motion resulting from IPM is an emergent property of neurons at the level of the IC. One model to account for this emergent sensitivity depends on GABAergic inhibition. Blocking GABAergic inhibition with bicuculline substantially increased neuronal discharge rates and increased the extent to which neurons were sensitive to the apparent-motion cues of IPM. The effect of GABA blockade is consistent with the hypothesis that sensitivity to the motion cues of IPM results from a process of adaptation-of-excitation whereby the magnitude of the recent response history influences subsequent neuronal responsiveness. These results indicate that GABAergic inhibition strongly influences the context-dependent processing of low-frequency binaural signals in the IC.
Keywords: inferior colliculus, binaural sensitivity, interaural phase differences, auditory motion, inhibition, adaptation-of-excitation
Although motion of a sound source or motion of the head in a sound field are common experiences, the neural mechanisms responsible for detecting movement of sound sources remain to be determined. Unlike in vision, for example, no studies at any level of the auditory pathway have demonstrated unequivocal selectivity for the direction or the velocity of sound motion. Nevertheless, psychophysical (Grantham, 1998) and neuroimaging (Griffiths et al., 1998) studies have indicated that specialized motion detectors and brain regions selectively activated by perceived motion do exist. What is not clear is whether these constitute evidence for specialized motion detectors or for a process by which motion is inferred from sequential localization of different spatial positions.
Neurons in the inferior colliculus (IC), the major auditory nucleus in the midbrain, are sensitive to the dynamic interaural phase disparity (IPD) cues of interaural phase modulation (IPM) (Spitzer and Semple, 1993; McAlpine et al., 2000), a stimulus that, in humans, produces the percept of sound motion. In contrast, neurons in the superior olivary complex (the primary site of binaural interaction) are generally insensitive to these apparent motion cues (Spitzer and Semple, 1998). This suggests a hierarchical processing of binaural responses, with sensitivity to auditory-motion cues emerging with ascent from brainstem to midbrain (Spitzer and Semple, 1998). As with psychophysical and neuroimaging data, however, the extent to which sensitivity to IPM constitutes evidence for the existence of specific motion detectors is unclear.
Spitzer and Semple (1998) suggested that the sensitivity to IPM of IC neurons could be mediated by binaural inhibition, possibly derived from the dorsal nucleus of the lateral lemniscus (DNLL). The contralateral DNLL provides the IC with a GABA inhibitory projection (Adams and Mugnaini, 1984; González-Hernández et al., 1996; Chen et al., 1999). Because one of the ascending inputs to the DNLL is the medial superior olive (MSO) on the same side of the brain (Goldberg and Moore, 1967), the potential exists for a low-frequency, interaural time difference (ITD)-sensitive, inhibitory input from the contralateral MSO indirectly via the DNLL from the contralateral MSO to influence the responses of IC neurons receiving excitatory inputs from the ipsilateral MSO, rendering them sensitive to the dynamic motion cues of IPM. This seems plausible, given the influence of GABAergic inhibition mediated via the DNLL on processing of high-frequency interaural cues in the IC of the rat (Li and Kelly, 1992; Kidd and Kelly, 1996).
An alternative mechanism is suggested by the sensitivity of IC neurons to IPM observed by McAlpine et al. (2000). Their data appeared explicable on the basis of adaptation-of-excitation, with discharge rates dependent on the instantaneous value of ITD and the response of neurons to recent stimulation.
To test directly the hypothesis that GABAergic inhibition is a requirement of sensitivity to apparent-motion cues in the midbrain, we recorded responses of IC neurons to a range of IPM cues before, during, and after iontophoresis of the GABAA antagonist bicuculline. The expectation was that bicuculline would abolish or reduce sensitivity to the virtual motion cues of IPM. However, for most neurons, sensitivity to IPM was dramatically enhanced in the presence of bicuculline. Neurons that appeared insensitive to the motion cues of IPM under control conditions exhibited vastly enhanced sensitivity to IPM cues under the influence of bicuculline. Neurons that appeared most sensitive to the motion cues of IPM under control conditions showed similar or greater sensitivity under the influence of bicuculline. These data provide positive confirmation that low-frequency IC neurons are influenced by the inhibitory neurotransmitter GABA. The data also support the contention (McAlpine et al., 2000) that adaptation-of-excitation contributes to the apparent sensitivity of IC neurons to the auditory motion cues of interaural phase modulation.
MATERIALS AND METHODS
Preparation and recording. Recordings were made from the right IC of 300–400 gm guinea pigs anesthetized with urethane (1.3 gm/kg in 20% solution) with additional analgesia obtained using Hypnorm (fentanyl–fluanisone). A premedication of atropine sulfate (0.06 mg/kg) was administered to reduce bronchial secretions. Supplementary doses of urethane (one-half to one-third of the induction dose) or Hypnorm were administered when required. All animals were tracheotomized, and core temperature was maintained at 37°C with a heating blanket and rectal probe. Animals respired spontaneously.
All experiments were conducted in a sound-attenuating chamber. The animals were placed in a stereotaxic frame with hollow ear bars in preparation for IC recordings by exposing the surface of the cortex overlying the IC and removing the covering dura. Single-neuron action potentials were recorded using tungsten-in-glass microelectrodes (Merrill and Ainsworth, 1972; Bullock et al., 1988) that were attached with epoxy resin to glass multibarrel iontophoresis electrodes so that the tip of the tungsten was within a few tens of micrometers of the drug barrels. After positioning the electrode stereotaxically to ∼2 mm above the surface of the IC, it was advanced in a dorsal-to-ventral direction using a Burleigh Instruments (Victor, NY) IW-700/710 Inchworm from outside the recording chamber.
Stimulus production and presentation. Stimuli were delivered separately to each ear via attenuators and sealed acoustic systems comprising custom-modified Radio Shack (Fort Worth, TX) 40–1377 tweeters (M. Ravicz, Eaton Peabody Laboratory, Boston, MA) that were coupled to damped 4-mm-diameter probe tubes, which fitted into the hollow ear bars. In every experiment, a probe tube microphone was used to calibrate the sound system close to the tympanic membrane in decibels with respect to 20 μPa. The sound system for each ear was flat ±5 dB from 100–10,000 Hz and were matched to within ±2 dB. All stimuli were generated by an array processor at 100 kHz sampling rate (Tucker-Davis Technologies AP2), which was housed in a personal computer (Viglen, Middlesex, UK) operating with an Intel Pentium II 300 MHz processor, running with 64 megabytes of random access memory and Windows 95. Stimuli were output via a waveform reconstruction filter set to 25 kHz. Search stimuli consisted of 50 msec bursts of wideband noise presented binaurally. When a single neuron was isolated, its best frequency (BF) and threshold to binaural tones at zero interaural delay were determined audiovisually. The binaural frequency-versus-level response area of the neuron was then mapped for frequencies two octaves above and four octaves below the BF of the neuron and in 5 dB steps from full-system output (∼100 dB sound pressure level) to 20 dB below the audiovisually determined threshold at BF.
IPM stimuli were produced by fixing the phase at the left (contralateral) ear and triangularly modulating the phase at the right (ipsilateral) ear. Details of the algorithms used to produce the stimuli have been published previously (McAlpine et al., 2000). The IPM stimuli were 3 sec in duration, with a 2 msec rise–fall time. Each stimulus was presented 10 times at a modulation rate of 1 Hz. The range of IPDs traversed was controlled by adjusting the depth of the phase modulation at the right ear. In the experiments reported here, an IPD excursion of ±90°, which modulated the IPD through 180° in each direction, was used. Each cycle of the IPM stimulus consisted of a full sweep of 180° IPD in one direction, followed by a reversal and a full sweep of 180° IPD in the other direction. The center IPD is defined as the IPD midway through the excursion in each direction, and four different center IPDs were used: 0, +90, 180, and −90° IPD. Thus, each IPM stimulus overlaps by 50% with two other stimuli with center IPDs offset from its own center by +90 or −90° IPD. IPM stimuli with center IPDs separated by 180° IPD have no overlap in IPD. The two schematics at the top of Figure1 illustrate the waveforms at each ear. In each case, the stimulus phase at the left ear is unmodulated. For the schematic above Figure 1A, the signal at the left ear initially lags that at the right ear by 90°, giving a center IPD of −0.25 cycles (compare thick sine waves). The modulation of the phase of the signal at the right ear ±90° (thinsine waves indicate extent of modulation) around the center produces IPD excursions between −0.50 and 0.0 cycles of IPD. A similar scenario exists for the schematic above Figure 1B, except that the signal at the left ear initially leads that at the right ear by 90°, giving a center IPD of +0.25 cycles. The modulation of the phase of the signal at the right ear produces IPD excursions between 0.0 and +0.50 cycles of IPD.
Fig. 1.

Responses of an IC neuron (BF of 159 Hz) to ±90° IPM around center IPDs of −90° (A) and +90° (B). The schematic above Aindicates that the signal at the left ear initially lags that at the right ear by 90°, giving a center IPD of −0.25 cycles (comparethick sine waves). The modulation of the phase of the signal at the right ear ±90° (thin sine waves indicate extent of modulation) around the center produces IPD excursions between −0.50 and 0.0 cycles of IPD. The schematic aboveB indicates that the signal at the left ear initially leads that at the right ear by 90°, giving a center IPD of +0.25 cycles. The modulation of the phase of the signal at the right ear produces IPD excursions between 0.0 and +0.50 cycles of IPD. PSTHs inA and B were obtained before (top), during (middle), and after (bottom) recovery from the effects of bicuculline.Solid histogram bars indicate apparent motion in the counterclockwise direction, corresponding to a shift in IPD from negative toward more positive IPDs. Hatched histogram bars indicate apparent motion in the clockwise direction, corresponding to a shift in IPD from positive toward relatively negative IPDs. The IPD range covered is plotted above the PSTHs.C–E, Response to ±90° IPM centered at 0, 90, 180, and −90° IPD before (C), during (D), and after (E) recovery from the effects of bicuculline. In C–E, responses to IPM centered at 0° extend from −0.25 to +0.25 cycles, responses to IPM centered at −90° extend from −0.50 to 0.0 cycles, responses to IPM centered at +90° extend from 0.0 to +0.5 cycles, and responses to IPM centered at 180° extend from +0.25 cycles to 0.50 cycles, before “wrapping,” reappearing at −0.50 cycles and extending to −0.25 cycles. The gray lines in D replot the responses in C for comparison. sp/s, Spikes per second.
Iontophoresis and drugs. Five-barrel iontophoresis electrodes were pulled from 1.2 mm glass tubes containing a glass fiber (product code 5BBL W/FIL 1.2 mm; World Precision Instruments, Sarasota, FL). The tip was broken against a glass rod under a microscope to have a tip diameter of the order of 10 μm. A tungsten recording electrode was attached, and the iontophoresis electrode barrels were backfilled with drugs. For the present purposes, 10 mm bicuculline chloride in distilled water and 0.5 m GABA were used. The central barrel was filled with 2.0 m sodium chloride for current balancing. Retention and ejection currents were provided by a NeuroPhore (Digitimer, Hertfordshire, UK) BH-2 iontophoresis system with IP2 iontophoresis current pumps.
Bicuculline was retained in the pipette barrel using a negative holding current of 10–15 nA. Ejection of bicuculline was achieved by passing a positive current, of variable magnitude generally <50 nA, through the micropipette barrel. As a control, the neuron response to equal current injection from the current balancing barrel was checked, and no responses were observed.
Data analysis. Three analyses were conducted for each neuron. First, and simplest, the total discharge rate for each IPM configuration was calculated before, during, and after iontophoresis of bicuculline. Second, the discharge rate ratio between clockwise and counterclockwise motion was calculated for each IPM configuration. As well as being used to examine the effects of blocking GABAergic inhibition within IPM configurations, this measure was also used to compare the ratio of clockwise with counterclockwise discharge rates pooled across different IPM configurations. Third, a normalized difference between the responses to the two directions of motion was obtained for each IPM configuration to provide for a quantitative measure of the effects of blocking GABAergic inhibition. Each IPM sweep was divided into 60 bins of equal duration (16.67 msec), 30 for each direction of motion. After normalizing the discharge rate at each IPD, by subtracting the minimum discharge rate and dividing by the range (maximum to minimum), the absolute difference between the clockwise and counterclockwise responses at each IPD was calculated, and the average difference was assigned as the “difference metric.” The difference metric provides a measure of the difference in the form of responses to the two directions of motion that is independent of any changes in discharge rate that might occur as a result of blocking GABAergic inhibition. The theoretical maximum difference metric of 1.0 would be attained if one direction of motion evoked an unmodulated, non-zero output over the full 180° excursion of the sweep and the other direction of motion evoked zero output across the full 180° range.
RESULTS
Responses were obtained from 25 low BF single neurons in the inferior colliculus to partially overlapping ±90° IPMs modulated around center IPDs of 0, +90, −90, and 180°. Figure 1 shows responses of an IC neuron to two of these IPM configurations, ±90° IPM modulated around a center IPD of −90° (Fig.1A) and ±90° IPM modulated around a center IPD of + 90° (Fig. 1B). The three poststimulus time histograms (PSTHs) in Figure 1, A and B, were obtained before (top), during (middle), and after (bottom) recovery from the effects of bicuculline. Each PSTH plots the response to 10 repetitions of the entire 3000 msec of the IPM stimulus. The functions above the PSTHs in Figure 1, A andB, denote the value of the IPD throughout the duration of the stimulus. Thin lines indicate apparent motion in the clockwise direction, corresponding to a shift in IPD from positive toward relatively negative IPDs. Thick lines indicate apparent motion in the counterclockwise direction, corresponding to a shift in IPD from negative toward relatively positive IPDs. Note the range of IPDs covered by the stimuli in A and B. In each case, the IPM stimulus commences at the value of the center IPD (−0.25 and 0.25 cycles, respectively) and moves for one-quarter of a cycle of the IPM period (one-half of a sweep in one motion direction) toward more positive values (counterclockwise motion). It then reverses and moves through a complete sweep from positive to more negative values (clockwise motion) before reversing again and moving through a complete sweep from negative to more positive values (counterclockwise motion). This process is repeated twice more, with the stimulus ending on a half-sweep of motion in the counterclockwise direction. The responses to the counterclockwise and clockwise excursions are plotted as the corresponding solid and hatched bars in the histograms of the PSTHs of Figure 1, A andB. The panels to the right of each PSTH plot the responses shown in the PSTHs, folded to obtain the average discharge rate as a function of the IPD for the counterclockwise and clockwise sweeps. The initial half-sweep of response (corresponding to the first 250 msec of the IPM stimulus) is excluded from this analysis to remove any onset effects. Thearrows above these panels indicate the motion direction corresponding to the counterclockwise and clockwise responses. From the top right panel in Figure 1,A and B, and from C, it is evident that the responses evoked by the two motion directions were similar under control conditions. Note also that, although maximum instantaneous discharge rates of ∼150 spikes/sec were attained, the relatively fine binning of the response for each direction (30 bins in each direction, of 16.67 msec each) means that this rate was actually evoked for only a relatively short time. Averaged across the entire 30 bins in each direction, the long-term average discharge rate is considerably lower (∼50 spikes/sec). Figure1C–E plots the responses to each of the four IPM configurations (the two in A and B, plus ±90° modulated around center IPDs of 0 and 180°), plotted on the same IPD axis before (C), during (D), and after (E) recovery from the effects of bicuculline. Each IPM configuration overlaps partially (by 90°) two flanking IPM configurations. Under control conditions (Fig. 1C), the response at any one IPD was primarily independent of the context in which it was presented; neither the center IPD nor the direction of motion differentially influenced the response.
Figure 2 shows responses of six IC neurons to IPM at the four center IPDs. The neurons in Figure2A–C were strongly influenced by the direction and center of IPM. The partially overlapping IPMs evoked different discharge rates at the same value of interaural phase for motion over the same range of IPDs in opposite directions or at the same IPDs in the context of motion in a single direction around other center IPDs. For example, in Figure 2A, zero IPD could evoke discharges from 50 to 150 spikes/sec, depending on context, whereas at +90°, IPD discharge rates varied from 15 to 70 spikes/sec. Such neurons likely form the extreme end of a continuum that extends through to neurons, such as those in Figures 1C and2D–F, which show little evidence of sensitivity to the dynamic IPD cues of IPM (Spitzer and Semple, 1993; McAlpine et al., 2000).
Fig. 2.

A–F, Responses of six IC neurons to ±90° IPM centered at 0, 90, 180, and −90° IPD. Thick curves show responses to counterclockwise motion (IPD moving from negative to positive IPDs, indicated by thick arrowabove A), and thin curves show responses to clockwise motion (IPD moving from positive toward negative IPDs, indicated by thin arrow above A).A–C show responses from three neurons that were sensitive to the dynamic IPD cues of IPM: BF of 112, 154, and 376 Hz, respectively. D–F show responses from three neurons that were primarily insensitive to the dynamic IPD cues of IPM: BF of 250, 372, and 561 Hz, respectively. sp/s, Spikes per second.
Influence of GABAergic inhibition on sensitivity to IPM
The influence of GABAergic inhibition on the responses of low-frequency IC neurons to IPM was examined using the GABAA blocker bicuculline. In all recordings, care was taken to ensure that single neurons were well isolated, because the effect of rapid, repeated firing was often to decrease the magnitude of later spikes in a train of action potentials. Failure to discriminate all evoked spikes could bias the data with later spikes in the train being particularly susceptible to exclusion on this basis.
Two main effects of blocking GABAergic inhibition with bicuculline on the responses of IC neurons to IPM were observed. First, all neurons showed a substantial increase in discharge rate across a wide range of IPDs during iontophoresis of bicuculline. The middle PSTHs of Figure 1, A and B, indicate that the discharge rate increased by approximately threefold during iontophoresis of bicuculline compared with control (top and bottomPSTHs) conditions. Note the change in the ordinate scaling of themiddle PSTHs of Figure 1, A and B, compared with the top and bottom PSTHs.
The second, concomitant effect of blocking GABAergic inhibition with bicuculline was a substantial increase in differential sensitivity to the dynamic IPD cues of the IPM. This is evident in thepanels to the right of the PSTHs in Figure 1,A and B, in which before iontophoresis of bicuculline (top right panels), the two directions of motion evoked similar responses. However, during iontophoresis of bicuculline, responses to the two directions of motion differed substantially (middle right panels). Termination of the bicuculline current eventually returned responses to the predrug form (bottom right panels). The effect of bicuculline on sensitivity to the motion cues of IPM is illustrated in Figure 1D for all IPM configurations. Here, compared with before (Fig.1C,D, gray lines) and after (Fig.1E) recovery from the effects of bicuculline, the neuron appeared highly sensitive to the context in which a particular IPD was presented. For any one IPD, both the motion direction and the center around which the interaural phase was modulated influenced the response.
Responses of three IC neurons that exhibited a range of predrug motion sensitivities to ±90° IPM modulated around the four center IPDs before, during, and after the iontophoresis of bicuculline are shown in Figure 3 as the average discharge rate as a function of the IPD for the counterclockwise and clockwise sweeps (A–C, G–I, M–O). A,G, and M plot responses to partially overlapping ±90° IPMs before the application of bicuculline, B,H, and N plot responses during iontophoresis of bicuculline, and C, I, and O plot responses after recovery from the effects of bicuculline. Again, note the change in the ordinate scaling between the panels for each neuron. Termination of the bicuculline current led to the gradual and systematic recovery of predrug discharge rates, and ∼8–10 min later recovery was complete (C, I, O).D, J, and P in Figure 3 plot average discharge rates for the four center IPDs before, during, and after recovery from the effects of bicuculline and clearly demonstrate the several-fold increase in discharge rate that accompanied iontophoresis of bicuculline.
Fig. 3.
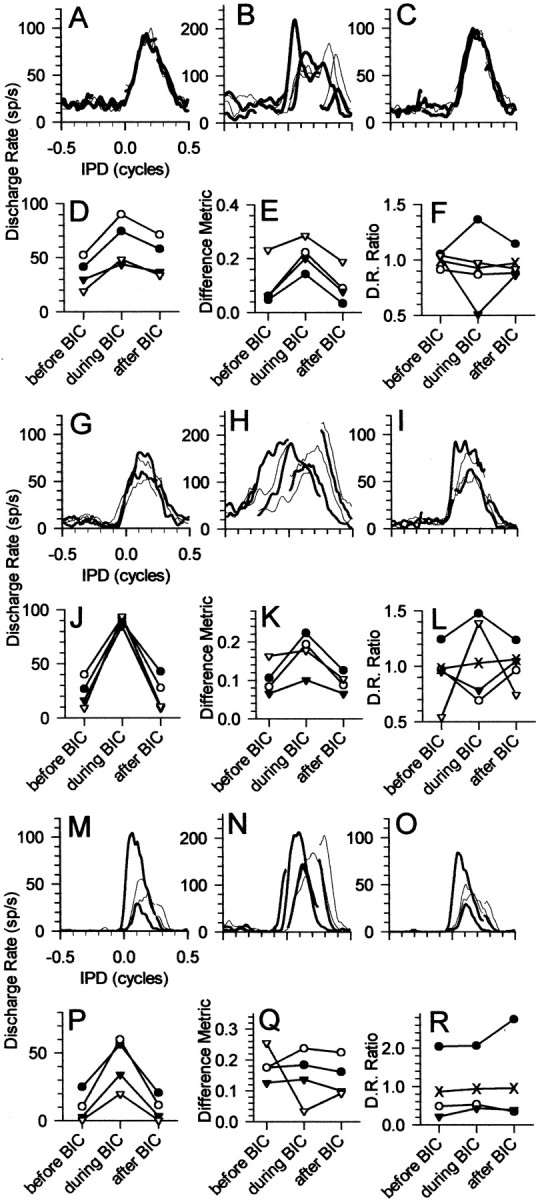
Response of three neurons (A–F, BF of 280 Hz; G–L, BF of 120 Hz; M–R, BF of 679 Hz) before, during, and after recovery from iontophoresis of the GABA antagonist bicuculline (BIC). Thick curves show counterclockwise motion, and thin curves show clockwise motion. A,G, and M plot responses before iontophoresis of bicuculline, B, H, andN plot responses during iontophoresis of bicuculline, and C, I, and O plot responses after recovery from the effects of bicuculline.D, J, and P plot the average discharge rate evoked by the four IPM configurations before, during, and after recovery from the effects of bicuculline (filled circles, 0°; open circles, +90°; filled triangles, 180°;open triangles, −90°). E,K, and Q plot the difference metric before, during, and after recovery from the effects of bicuculline; for additional details, see Results. F, L, and R plot the ratio of discharge rates for clockwise versus counterclockwise motion for the four IPM configurations (filled circles, 0°; open circles, +90°; filled triangles, 180°;open triangles, −90°). The crossesplot the ratio of discharge rates for clockwise versus counterclockwise motion summed across the four IPM configurations.
In the presence of bicuculline (Fig.3B,H,N), all IC neurons responded in a similar manner to the neurons in Figures2A–C, which constitute the most extreme forms of IPM sensitivity that were normally observed in the IC under control conditions. Neurons that were primarily insensitive to the direction or center of IPM under control conditions (i.e., before bicuculline was applied) showed pronounced enhancement in sensitivity to the direction of apparent motion when bicuculline was applied. Furthermore, for IPM configurations with partially overlapping ranges of IPDs, larger differences in the responses to the overlapping range of IPDs were observed for the same direction of motion. This is particularly evident in Figure 3, B and H. Neurons that were differentially sensitive to IPM under control conditions either showed increased sensitivity to IPM or, in the extreme case such as in Figure3N, showed similarly sensitive responses. Notably, in the context of the neuron in Figure 3M–R, blocking GABAergic inhibition neither abolished nor reduced systematically sensitivity to IPM.
The increase in apparent sensitivity to the motion cues of IPM when GABAergic inhibition was blocked was quantified by calculating the difference metric for each IPM stimulus (i.e., for the four center IPDs), as described in Materials and Methods. The difference metric between clockwise and counterclockwise motion at each center IPD constitutes the average, normalized difference in the response to the two directions of motion. This difference metric is plotted in E, K, andQ for each neuron in Figure 3. In each case, the magnitude of the difference metric increased during iontophoresis of bicuculline and returned close to control values after termination of the bicuculline current. This follows the pattern of discharge rate changes observed over the same time period and suggests a relationship between the two.
Figure 4 plots the distribution of difference metrics before, during, and after recovery from the effects of bicuculline for all neurons. Eighteen neurons for which full data sets (i.e., all four conditions before, during, and after iontophoresis of bicuculline) were obtained constitute the black bars in Figure 4, with the remaining neurons for which responses to IPM were obtained only before or during iontophoresis included as white bars. The difference metric before iontophoresis of bicuculline was 0.12 ± 0.06 (mean ± SD). This increased to 0.23 ± 0.11 during iontophoresis of bicuculline. After recovery from the effects of bicuculline, the mean difference metric returned to predrug values (0.11 ± 0.05).
Fig. 4.

The difference metric calculated for the four IPM configurations for each neuron before (A), during (B), and after (C) recovery from iontophoresis of bicuculline. Black bars indicate neurons for which full data sets were obtained. White bars indicate neurons for which data were obtained only for before or before and during iontophoresis of bicuculline. Number of IPM configurations refers to the number of IPM configurations across all neurons that showed a particular value of the difference metric. For the black bars, this was 4 configurations × 18 neurons. The remaining white bars are from neurons for which responses to IPM were obtained before or before and during iontophoresis only. Similarly for Figure7A–C.
Time course of the effects of bicuculline
It was always observed that, during initiation of the ejection current, the increase in discharge rate accompanying iontophoresis of bicuculline took several minutes to develop. Once the effect became apparent, however, the increase in discharge rate was usually substantial. No doubt several factors could contribute to the relatively slow build-up of the effect of bicuculline. These include the distance from the recording site of the electrode tip, the concentration of bicuculline within the multibarrel pipettes, and the magnitude of the current used to eject the bicuculline.
After termination of the iontophoresis current, the effects of bicuculline took at least 5 min to dissipate. This confirms that it was the presence of the bicuculline, and not the ejection current per se (which was balanced by current ejection of the opposite polarity through the NaCl electrode barrel), that induced the increase in discharge rate and enhanced sensitivity to the motion cues of IPM. In a few instances, we checked that simple current injection of similar magnitude did not affect the neural response. In contrast to the effects of bicuculline, IC neurons, including those in Figure 3, responded to iontophoresis of even very low GABA ejection currents with an immediate and substantial reduction in discharge rate (data not shown). This was typical of the effects of GABA, which very rapidly abolished spontaneous and evoked neuronal activity after the onset of current ejection. Recovery from the effects of GABA, once the ejection current was terminated, was equally rapid, probably because of highly effective uptake mechanisms for GABA that exist in the CNS, and, indeed, to offset these it was necessary to use a high concentration of GABA.
The time course of the build-up of the effects of bicuculline is illustrated for a single neuron in Figure5. Responses to each of the four IPM configurations before, during, and after recovery from iontophoresis of bicuculline are shown in Figure 5A–C, respectively. Again, blocking GABAergic inhibition increased sensitivity to the motion cues of IPM (Fig. 5B; note also the change in scale for the ordinate in 5A). After recovery from the effects of bicuculline, responses returned to predrug values (Fig. 5C). The response of the neuron to the two directions of motion centered at different IPDs (0° in Fig. 5D–G; +90° in Fig.5H–K) indicates that the effects of blocking GABAergic inhibition with bicuculline increased over time. Approximately 3 min after the bicuculline current was initiated, the discharge rate had increased approximately twofold to threefold (Fig.5L). However, ∼6 min later, the discharge rate had increased still further. This increase was accompanied by an increase in the extent to which responses to the two directions differed. When the effect of bicuculline was greatest in terms of the observed increase in discharge rate, responses to the two directions of motion were most dissimilar (Fig. 5, compareE,I withF,J). This was reflected in the increased value of the difference metric compared with predrug and recovery conditions (Fig. 5M). After termination of the bicuculline current, the response returned toward predrug conditions (data not shown) and was fully restored after ∼13 min had elapsed (Fig. 5G,K).
Fig. 5.

Responses from an IC neuron (BF of 347 Hz) before, during, and after recovery from iontophoresis of bicuculline (BIC). A–C, Responses to ±90° IPM centered at each of the four center IPDs for clockwise (thin) and counterclockwise (thick) apparent motion. D–G, H–K, Responses to ±90° IPM centered at 0° IPD and +90° IPD, respectively.D, H, Before iontophoresis of bicuculline. E, I, Three minutes after onset of bicuculline current. F, J, Nine minutes after onset of bicuculline current. G,K, Thirteen minutes after termination of bicuculline current. L, Discharge rate; M, difference metric; N, ratio of discharge rates before, during, and after recovery from iontophoresis of bicuculline for the four center IPDs. L–N, Filled circles, 0°;open circles, +90°; filled triangles, 180°; open triangles, −90°. Crossesplot the ratio of discharge rates for clockwise versus counterclockwise motion summed across all four IPM configurations. sp/s, Spikes per second.
The time course of the recovery from the effect of bicuculline is illustrated for a second neuron in Figure6. Once more, blocking GABAergic inhibition increased sensitivity to the motion cues of IPM (Fig.6B; note the change in scale for the ordinate in 6A). After recovery from the effects of bicuculline, responses returned to predrug values (Fig. 6C). Figure 6,D–G and H–K, indicates the time course of the effect of blocking GABAergic inhibition and recovery from its effects for the two IPM configurations centered at +90 and 0° IPD, respectively. In the absence of bicuculline (Fig.6D,I), there was a tendency for motion into the range of favorable IPDs to evoke higher discharge rates than motion out of the favorable range. This occurred regardless of motion direction. When the bicuculline ejection current was initiated, several minutes elapsed before any effect was observed. However, ∼4.5 min after the ejection current was started, discharge rates for each of the four IPM configurations had increased substantially (Fig. 6L). Accompanying this increase in discharge rate was an increase in the value of the difference metric for each of the four configurations (Fig. 6M). Termination of the bicuculline current did not result in an immediate return to predrug response patterns. Rather, the effects of bicuculline took some minutes to dissipate. Approximately 5 min after termination of the current, the differences between the responses to the two directions of motion (Fig.6F,J) remained greater than in the predrug control condition. However, ∼9 min after termination of the bicuculline current, responses had returned to predrug values (Fig. 6G,K).
Fig. 6.

Responses from an IC neuron (BF of 292 Hz) before, during, and after recovery from iontophoresis of bicuculline (BIC). A–C, Responses to ±90° IPM centered at each of the four center IPDs for clockwise (thin) and counterclockwise (thick) apparent motion. D–G, H–K, Responses to ±90° IPM centered at 0° IPD and +90° IPD, respectively.D, H, Before iontophoresis of bicuculline. E, I, Four and a half minutes after onset of bicuculline current. F,J, Five minutes after termination of bicuculline current. G, K, Nine minutes after termination of bicuculline current. L, Discharge rate;M, difference metric; N, ratio of discharge rates before, during, and after recovery from iontophoresis of bicuculline for the four center IPDs. L–N,Filled circles, 0°; open circles, +90°; filled triangles, 180°; open triangles, −90°. Crosses plot the ratio of discharge rates for clockwise versus counterclockwise motion summed across all four IPM configurations. sp/s, Spikes per second.
Blocking GABAergic inhibition reveals a mechanism responsible for IPM sensitivity
The data show that blocking GABAergic inhibition in the IC with bicuculline substantially increases the discharge rate of low-BF neurons to IPM stimuli. This increase in discharge rate is accompanied by an increase in the extent to which IC neurons are sensitive to the apparent motion cues of IPM. Previously, we argued that adaptation-of-excitation is a plausible explanation for much of the apparent sensitivity of IC neurons to the motion cues of IPM (McAlpine et al., 2000). In that study, it was noted that, whenever motion in the two directions over the same IPDs evoked different responses, the response to the motion moving away from a peak of activity was lower than the response to the direction moving into the peak of activity. This occurred regardless of whether counterclockwise or clockwise motion first moved through the favorable IPDs. Thus, for any center IPD, one direction of motion evokes a greater response than the other direction by virtue of unequal periods of recovery between the stimulus moving through the range of favorable IPDs. Only when recovery periods are equivalent should discharge rates be similar (McAlpine et al., 2000, their Fig. 5A).
The PSTHs in Figure 1, A and B, provide evidence supporting this notion. Before (Fig.1A,B, top) and after (Fig. 1A,B, bottom) recovery from blockade of GABAergic inhibition, the solidand hatched histogram bars were almost symmetric around the point at which the motion direction reversed in each IPM cycle. Note that each sweep of the counterclockwise response in the PSTHs of Figure1A was preceded by a much longer period of recovery than each sweep of the clockwise response, but, for this neuron, this had relatively little influence on the responses under control conditions. However, during iontophoresis of bicuculline (Fig.1A, middle PSTH), there was a substantial asymmetry in the response to the two directions of motion, with each sweep of counterclockwise (solid) motion evoking a much greater response than the subsequent sweep of clockwise (hatched) motion. When plotted as a function of IPD (Fig.1A, middle right), the response at any one IPD appears to depend on the direction of apparent motion, with counterclockwise motion evoking a much greater response than clockwise motion. In Figure 1B, however, the opposite temporal relationship between each sweep of counterclockwise and clockwise motion occurred. Here, simply because of the different center IPD of the IPM configuration, each sweep of the clockwise response was preceded by a much longer period of recovery than each sweep of the counterclockwise response. Again, although this also had relatively little influence on the responses to the two directions under control conditions, there was a substantial asymmetry during iontophoresis of bicuculline (Fig. 1B, middle PSTH); each sweep of clockwise (hatched) motion evoking a much greater response than the subsequent sweep of counterclockwise (solid) motion. When plotted as a function of IPD (Fig.1B, middle right), the response at any one IPD is greater for clockwise motion than for counterclockwise motion, again with motion into the range of favorable IPDs evoking a much greater response than motion out of the range of favorable IPDs. Note from Figure 1, A and B, that it is the response history and not the stimulus history per se that appears to be the critical factor in determining differential sensitivity to the apparent motion cues of IPM. This was the case for all IPM configurations and across all neurons examined, for both those differentially sensitive to the IPD cues of IPM in the absence of bicuculline and for those that the differential sensitivity was only observed when GABAergic inhibition was blocked.
It was generally the case that combining discharge rates across different IPM configurations produced similar discharge rates for clockwise and counterclockwise directions of motion. Thus, for example, the relatively greater response to counterclockwise compared with clockwise motion in the middle PSTH of Figure1A is offset by the relatively greater response to clockwise compared with counterclockwise motion in themiddle PSTH of Figure 1B. This is demonstrated for each of the neurons in Figure 3, F,L, and R. Triangles andcircles plot the ratio of discharge rates for clockwise versus counterclockwise motion for the four IPM configurations individually (for details, see figure legend), and thecrosses plot the ratio of discharge rates for clockwise versus counterclockwise motion combined across the four configurations. In the first example (Fig. 3F), discharge rate ratios were close to unity before iontophoresis of bicuculline for each IPM configuration, indicating that clockwise and counterclockwise motion evoked similar numbers of discharges for each configuration. Furthermore, combined across the four configurations (Fig.3F, crosses), the ratio of clockwise to counterclockwise discharge rates was also close to unity (0.97). Blocking GABAergic inhibition, however, increased dramatically the difference in discharge rates for clockwise to counterclockwise motion for each of the individual IPM configurations. Depending on the configuration, the ratio of clockwise to counterclockwise discharge rates varied from 0.51 to 1.3. In each case, motion into the range of favorable IPDs evoked higher discharge rates than did motion out of the range of favorable IPDs: the direction of motion with the longer period of recovery before it moved through the range of favorable IPDs evoked higher discharge rates than did the direction of motion with the shorter period of recovery. However, when combined across the four configurations, the ratio of discharge rates for clockwise versus counterclockwise motion remained close to unity (1.02), indicating that clockwise and counterclockwise motion evoked virtually identical numbers of discharges across the four configurations. Even when there was asymmetry of response to the clockwise versus counterclockwise motion before drug (Fig. 3G), when combined across the four configurations, similar numbers of discharge rates were evoked by clockwise and counterclockwise motion (ratio of 0.98). Despite the increased asymmetry attributable to blocking GABAergic inhibition (the ratio varied from 0.69 to 1.48 depending on the configuration), when combined across configurations, the ratio of clockwise to counterclockwise discharge rates was virtually unchanged (1.03). Recovery from the effects of bicuculline returned ratios of individual configurations to predrug values, whereas the ratio combined across configurations remained close to unity (1.06). Finally, when the predrug responses were quite asymmetric (Fig. 3M; ratios ranging from 0.20 to 0.04 in Fig. 3R), the ratio combined across the four IPM configurations was relatively close to unity (0.87). Similar analysis for the neurons in Figures 5 and 6 demonstrate that, during the build-up of and recovery from the effects of iontophoresis of bicuculline, the ratio of clockwise to counterclockwise discharge rates when combined across the four IPM configurations remained close to unity (Figs. 5N,6N, crosses), despite the fact that, for individual IPM configurations, the ratio of discharge rates could be considerably removed from unity.
Figure 7A–C plots the distribution of the ratios of discharge rates for the two directions of motion (counterclockwise and clockwise) for each of the four center IPDs before (A), during (B), and after (C) iontophoresis of bicuculline. Eighteen neurons for which full data sets (i.e., all four conditions before, during, and after iontophoresis of bicuculline) were obtained constitute the black bars in Figure 7, with the remaining neurons for which IPMs were obtained only before or during iontophoresis included as white bars. It is apparent that the spread of the discharge ratios during blocking of GABAergic inhibition (Fig. 7B) was greater than before (Fig.7A) or after recovery from (Fig. 7C) the blocking of GABAergic inhibition. The average deviation from a discharge ratio of 1.0 for counterclockwise versus clockwise motion across all IPM configurations was 11 ± 18% before iontophoresis of bicuculline, 29 ± 18% during iontophoresis of bicuculline, and 12 ± 14% after recovery from the effects of bicuculline. The increase in asymmetry of responses during GABAergic blockade (greater deviation of the discharge rate ratios from unity) when the two directions of motion were compared individually for the four IPM configurations (i.e., the four center IPDs) contrasts with what was observed when the data from different center IPDs were combined (Fig. 7D–F). When discharge rates were summed across all center IPDs, the average response to clockwise motion was virtually identical to the average response to counterclockwise motion in with the absence or presence of bicuculline. The average deviation from unity was 4 ± 4% in the predrug condition compared with 8 ± 5% during iontophoresis of bicuculline and 5 ± 3% in the postdrug condition.
Fig. 7.

A–C, Ratio of discharge rates for clockwise versus counterclockwise motion calculated separately for the four IPM configurations for each neuron before (A), during (B), and after (C) recovery from iontophoresis of bicuculline.D–F, Ratio of discharge rates for clockwise versus counterclockwise motion summed across all four IPM configurations for each neuron before (D), during (E), and after (F) recovery from iontophoresis of bicuculline. Black bars indicate neurons for which full data sets were obtained before, during, and after iontophoresis of bicuculline. White bars indicate neurons for which data were obtained only for before or before and during iontophoresis of bicuculline.
Effects of iontophoresis of GABA on IPM sensitivity
We did not make a systematic study of the effects of iontophoresing GABA on the responses of IC neurons to IPM. However, when recording stability permitted, we examined the effect of iontophoresis of GABA on many IC neurons studied to one of the IPM configurations. In each case, in contrast to the slow build-up of the effects of bicuculline, the effect of iontophoresing GABA on neuronal responses was an immediate reduction in discharge rate evoked by IPM.
For a small number of neurons, more extensive data examining the effects of iontophoresing GABA on sensitivity to IPM was obtained. Figure 8A–C shows responses of three IC neurons before (gray curves) and during (thick and thin curves) iontophoresis of GABA. In each case, discharge rates evoked by IPM were reduced, but the effects on sensitivity to the dynamic IPD cues of the IPM differed. The neuron in Figure 8A was insensitive to the dynamic IPD cues of IPM both before and during iontophoresis of GABA. The neuron in Figure 8B initially showed some sensitivity to IPM, indicated by the extent to which the responses only partially overlap at any one IPD (gray curves). As well as reducing the discharge rate, iontophoresis of GABA reduced the extent to which the neuron was sensitive to IPM. The neuron in Figure8C was strongly sensitive to IPM before iontophoresis of GABA. However, although iontophoresis of GABA reduced the discharge rate at all ejection currents examined (including the highest shown here), sensitivity to the dynamic IPD cues of IPM remained, with the functions seemingly shifted downward compared with the predrug situation.
Fig. 8.

Effects of iontophoresis of GABA on the responses of three IC neurons to the four IPM configurations.Thin curves indicate responses to clockwise motion, andthick curves indicate responses to counterclockwise motion during iontophoresis of GABA. Gray curvesindicate responses before iontophoresis of GABA. A, BF of 275 Hz. This neuron was insensitive to the apparent motion cues of IPM before and during iontophoresis of GABA. B, BF of 376 Hz. The effect of iontophoresis of GABA on this neuron was to reduce the discharge rate and the extent to which the neuron was sensitive to IPM. C, BF of 112 Hz. Although the discharge rate of this neuron was reduced during iontophoresis of GABA, it remained sensitive to the apparent motion cues of IPM.
For two IC neurons, sufficient data were obtained to demonstrate the dose dependency of GABA on sensitivity to IPM. Figure9 shows the effect of increasing GABA ejection current on the responses of one of these neurons to ±90° IPM centered at 90° IPD at different GABA ejection currents. As the ejection current was increased (from A toF), the difference in the response to the two directions of motion progressively decreased, quantified by the reduction in the difference metric with increasing GABA current in Figure 9H. This reduction in the difference between the responses to the two directions was accompanied by a reduction in the evoked discharge rate (Fig. 9G).
Fig. 9.

A–F, Normalized responses of an IC neuron (BF of 243 Hz) to ±90° IPM centered at +90° IPD during iontophoresis of different GABA ejection currents. A, Before iontophoresis of GABA; B, 5 nA of GABA current;C, 8 nA; D, 12 nA; E, 20 nA; F, 40 nA. Thin lines show responses to clockwise motion, and thick lines show responses to counterclockwise motion. G, Effect of GABA iontophoresis current on average discharge rate combined across clockwise and counterclockwise motion for data in A–F.H, Effect of GABA iontophoresis current on difference metric between clockwise and counterclockwise motion for data inA–F.
DISCUSSION
The main finding of this study is that the responses of low-BF, ITD-sensitive neurons in the IC to IPM are strongly influenced by GABAergic inhibition. Specifically, blocking GABAergic inhibition with bicuculline greatly enhanced sensitivity to the apparent-motion cues of IPM. Thus, it appears that one effect of GABAergic inhibition in the IC might be to modulate sensitivity to dynamic aspects of a stimulus by maintaining the discharge rate below the maximum of which the neurons might otherwise be capable. The effect of GABAergic inhibition on the responses of IC neurons to the dynamic binaural cues of IPM, therefore, appears to be opposite to that which has been postulated recently. Rather than GABAergic inhibition, possibly mediated via the DNLL (Spitzer and Semple, 1998), contributing to the appearance of sensitivity to the apparent-motion cues of IPM in the IC, the current data suggest that GABAergic inhibition diminishes greatly such sensitivity.
For each neuron, the direction of motion with the longer period of recovery before it moved through the range of favorable IPDs evoked higher discharge rates than did the direction of motion with the shorter period of recovery (McAlpine et al., 2000). The exacerbation of these effects when GABAergic inhibition is blocked is associated with an increase in discharge rate: the higher discharge rates evoked by motion into the range of favorable IPDs appear to reduce the capacity of the neuron to respond equally to the same IPDs subsequently encountered. A striking observation in our data were that the extent to which the discharge rate across all of the IPM configurations was equivalent for clockwise and counterclockwise motion, despite the often highly asymmetric responses to the two directions of motion for any single IPM configuration. This was apparent under both control and test conditions. It suggests that the relatively greater discharge rate to one direction of motion, brought about by the temporal relationship of the responses evoked by the two directions, can be counterbalanced by the relatively greater discharge rate to the other direction of motion for another IPM configuration.
Sources of GABAergic inhibition in the IC
Potential source nuclei for GABAergic inhibition to the IC include, but may not be restricted to, the contralateral and ipsilateral DNLL (Schneiderman et al., 1988). Other sources include the contralateral IC, descending input from thalamus and cortex as has been demonstrated functionally in echo-locating bats (Suga et al., 2000), and interneurons in the IC itself. Little is known of how local interneurons in the IC influence neural processing, and the existence or function of any local (to the IC) network properties is only poorly, if at all, understood. Thus, although the DNLL is likely to be a major contributor to GABAergic inhibition in the IC, blockade of GABAergic inhibition at the level of the IC does not permit separation of the effects mediated via the DNLL and those mediated via other sources.
Because the DNLL does provide a major source of GABAergic input to the IC, an interesting and important question is how neurons in the DNLL respond to IPM. Compared with the IC, many more neurons in the DNLL show phase-locked responses to monaural stimulation (Aitkin et al., 1970; Brugge et al., 1970), as well as higher discharge rates to binaural stimulation (Boehnke and McAlpine, 2001). However, a detailed study of the responses of low-frequency, ITD-sensitive DNLL neurons, including their response to IPM, is yet to be undertaken. Thus, it is unknown whether DNLL neurons are similar to MSO neurons or to IC neurons in their response to IPM. However, the potential role of the DNLL and GABAergic inhibition mediated by it, in the appearance of IPM sensitivity in the IC, remains to be elucidated. This is particularly so because the DNLL, like the IC, also receives multiple convergent inputs, including inhibitory inputs, some of which are potentially ITD sensitive. In vitro studies of DNLL neurons indicate that inhibitory postsynaptic potentials evoked by stimulation of the lateral lemniscus are blocked by the glycine receptor antagonist strychnine but not by bicuculline, whereas IPSPs elicited by stimulation of the commissure of Probst, providing input from the opposite DNLL, demonstrate the opposite sensitivity (Wu and Kelly, 1996; Chen et al., 1999).
Potential role for of GABAergic inhibition in the IC
A number of investigations into possible roles for GABA in IC processing of binaural auditory signals have been reported previously (Li and Kelly, 1992), including processing ITDs in the envelope structure of high-frequency signals (Kidd and Kelly, 1996). However, the current study is the first to demonstrate the effects or role of GABAergic inhibition in the processing of ITDs in the fine structure of low-frequency signals. Recent demonstrations by Semple and his colleagues (Malone and Semple, 2001) that a range of dynamic acoustic stimuli produce similar effects to that observed using IPM, e.g., sensitivity to the direction of monaural frequency modulation when the modulation is swept into and out of the frequency-tuning curve, argue against any specific mechanism contributing to motion sensitivity. Semple's data provide additional support for a hierarchical processing of temporal information, because primary auditory cortical neurons showed even greater sensitivity to dynamic acoustic stimuli than did IC neurons (Malone and Semple, 2000). If the same mechanisms contributes to both monaural and binaural processing, it argues against any specific action of ITD-sensitive GABAergic input from the DNLL in producing sensitivity to IPM in the IC.
Adaptation-of-excitation
As discharge rates increased during the blockade of GABAergic inhibition, neurons exhibited much greater sensitivity to the motion cues of IPM. This increase, rather than decrease, in sensitivity is consistent with the direction that would be observed if the effects were attributable to a process of adaptation-of-excitation. It was always the case that, for any one IPM configuration, relatively high discharge rates were evoked by motion into the range of favorable IPDs compared with motion out of the range of favorable IPDs (Fig. 1) in the manner described by McAlpine et al. (2000). Responses of many neurons were transformed from being not differentially sensitive to IPM to being highly differentially sensitive to IPM. Compared with the IC, neurons in the MSO appear primarily insensitive to the dynamic cues of IPM, an observation that lead Spitzer and Semple (1998) to propose a hierarchical processing of responses to low-frequency binaural signals in the auditory brainstem and midbrain. MSO neurons might be intrinsically less susceptible to the effects of adaptation-of-excitation than IC neurons, or MSO neurons might receive stronger inhibitory projections than IC neurons, ameliorating the effects of adaptation-of-excitation more completely than is observed in the IC.
If adaptation-of-excitation is responsible for the appearance in the IC of sensitivity to apparent motion cues, what specific cellular mechanisms might be implicated? Two possible forms–sites of adaptation-of-excitation are often considered: presynaptic adaptation in which depletion of neurotransmitter results in a less effective synapse and postsynaptic adaptation in which the properties of specific membrane channels contribute to the temporal pattern of responses. Although the intrinsic response properties of IC neurons are relatively less well characterized than those of brainstem auditory nuclei subserving binaural hearing, data from several studies, both in vivo (Kuwada et al., 1997) and in vitro(Shivaramakrishnan and Oliver, 2001), suggest heterogeneity of response properties in the IC. This includes several different forms of adapting response profiles to injected current (Shivaramakrishnan and Oliver, 2001), as well as hyperpolarizing responses to acoustic stimulation (Kuwada et al., 1997). The current study suggests that blocking GABAergic inhibition reveals intrinsic properties of IC neurons consistent with a postsynaptic mechanism of adaptation-of-excitation, because the increased probability of discharge increased the amount of adaptation observed. However, other than ascribing the effects to a mechanism of (postsynaptic) adaptation-of-excitation, the extracellular recording technique does not permit the specific mechanisms responsible for the response patterns observed to be elucidated.
Footnotes
This work was supported by the Medical Research Council.
Correspondence should be addressed to David McAlpine, Department of Physiology, University College London, Gower Street, London, WC1E 6BT, UK. E-mail: d.mcalpine@ucl.ac.uk.
REFERENCES
- 1.Adams JC, Mugnaini E. Dorsal nucleus of the lateral lemniscus: a nucleus of GABAergic projection neurons. Brain Res Bull. 1984;13:585–590. doi: 10.1016/0361-9230(84)90041-8. [DOI] [PubMed] [Google Scholar]
- 2.Aitkin LM, Anderson DJ, Brugge JF. Tonotopic organisation and discharge characteristics of single neurones in nuclei of the lateral lemniscus of the cat. J Neurophysiol. 1970;33:421–440. doi: 10.1152/jn.1970.33.3.421. [DOI] [PubMed] [Google Scholar]
- 3.Boehnke S, McAlpine D. Effects of stimulus level on ITD tuning of low frequency cells in the auditory midbrain. Assoc Res Otolaryngol Abstr. 2001;24:190. [Google Scholar]
- 4.Brugge JF, Anderson DJ, Aitkin LM. Responses of neurons in the dorsal nucleus of the lateral lemniscus of cat to binaural tonal stimulation. J Neurophysiol. 1970;33:441–458. doi: 10.1152/jn.1970.33.3.441. [DOI] [PubMed] [Google Scholar]
- 5.Bullock D, Palmer AR, Rees A. A compact and easy to use tungsten-in-glass microelectrode manufacturing workstation. Med Biol Eng Comput. 1988;26:669–672. doi: 10.1007/BF02447511. [DOI] [PubMed] [Google Scholar]
- 6.Chen L, Kelly JB, Wu SH. The commissure of Probst as a source of GABAergic inhibition. Hear Res. 1999;138:106–114. doi: 10.1016/s0378-5955(99)00156-2. [DOI] [PubMed] [Google Scholar]
- 7.Goldberg JM, Moore RY. Ascending projections of the lateral lemniscus in the cat and the monkey. J Comp Neurol. 1967;129:143–156. [Google Scholar]
- 8.González-Hernández T, Mantalon-Sarmiento B, Gonzalez-Gonzalez B, Perez-Gonzalez H. Sources of GABAergic input to the inferior colliculus of the rat. J Comp Neurol. 1996;372:309–326. doi: 10.1002/(SICI)1096-9861(19960819)372:2<309::AID-CNE11>3.0.CO;2-E. [DOI] [PubMed] [Google Scholar]
- 9.Grantham DW. Auditory motion aftereffects in the horizontal plane: the effects of spectral region, spatial sector, and spatial richness. Acustica. 1998;84:337–347. [Google Scholar]
- 10.Griffiths TD, Rees G, Rees A, Green GGR, Witton C, Rowe D, Büchel C, Turner R, Frackowiak RSJ. Right parietal cortex is involved in the perception of sound movement in humans. Nat Neurosci. 1998;1:74–79. doi: 10.1038/276. [DOI] [PubMed] [Google Scholar]
- 11.Kidd SA, Kelly JB. Contribution of the dorsal nucleus of the lateral lemniscus to binaural responses in the inferior colliculus of the rat: interaural time delays. J Neurosci. 1996;16:7390–7397. doi: 10.1523/JNEUROSCI.16-22-07390.1996. [DOI] [PMC free article] [PubMed] [Google Scholar]
- 12.Kuwada S, Batra R, Yin TCT, Oliver DL, Haberley LB, Stanford TR. Intracellular recordings in response to monaural and binaural stimulation of neurons in the inferior colliculus of the cat. J Neurosci. 1997;17:7565–7581. doi: 10.1523/JNEUROSCI.17-19-07565.1997. [DOI] [PMC free article] [PubMed] [Google Scholar]
- 13.Li L, Kelly JB. Inhibitory influence of the dorsal nucleus of the lateral lemniscus on binaural responses in the rat's inferior colliculus. J Neurosci. 1992;12:4530–4539. doi: 10.1523/JNEUROSCI.12-11-04530.1992. [DOI] [PMC free article] [PubMed] [Google Scholar]
- 14.Malone B, Semple MN. Effects of stimulus context on single unit response properties in core auditory cortex of the alert macaque. Assoc Res Otolaryngol Abstr. 2000;23:298. [Google Scholar]
- 15.Malone B, Semple MN. Effects of stimulus context on the representation of frequency in the gerbil inferior colliculus. J Neurophysiol. 2001;86:1113–1130. doi: 10.1152/jn.2001.86.3.1113. [DOI] [PubMed] [Google Scholar]
- 16.McAlpine D, Jiang D, Shackleton TM, Palmer AR. Responses of neurones in the inferior colliculus to dynamic interaural phase cues: evidence for a mechanism of adaptation of excitation. J Neurophysiol. 2000;83:1356–1365. doi: 10.1152/jn.2000.83.3.1356. [DOI] [PubMed] [Google Scholar]
- 17.Merrill EG, Ainsworth A. Glass-coated, platinum-coated tungsten microelectrodes. Med Biol Eng. 1972;10:662–672. doi: 10.1007/BF02476084. [DOI] [PubMed] [Google Scholar]
- 18.Schneiderman A, Oliver DL, Henkel CK. Connections of the dorsal nucleus of the lateral lemniscus: an inhibitory pathway in the ascending auditory system? J Comp Neurol. 1988;276:188–208. doi: 10.1002/cne.902760204. [DOI] [PubMed] [Google Scholar]
- 19.Sivaramakrishnan S, Oliver DL. Distinct K currents in physiologically distinct cell types in the inferior colliculus of the rat. J Neurosci. 2001;21:2861–2877. doi: 10.1523/JNEUROSCI.21-08-02861.2001. [DOI] [PMC free article] [PubMed] [Google Scholar]
- 20.Spitzer MW, Semple MN. Responses of inferior colliculus neurones to time-varying interaural phase disparity: effects of shifting the locus of virtual motion. J Neurophysiol. 1993;69:1245–1263. doi: 10.1152/jn.1993.69.4.1245. [DOI] [PubMed] [Google Scholar]
- 21.Spitzer MW, Semple MN. Transformation of binaural response properties in the ascending auditory pathway: influence of time-varying interaural phase disparity. J Neurophysiol. 1998;80:3062–3076. doi: 10.1152/jn.1998.80.6.3062. [DOI] [PubMed] [Google Scholar]
- 22.Suga N, Goa E, Zhang Y, Ma X, Olsen JF. The corticofugal system for hearing: recent progress. Proc Natl Acad Sci USA. 2000;97:11807–11814. doi: 10.1073/pnas.97.22.11807. [DOI] [PMC free article] [PubMed] [Google Scholar]
- 23.Wu SH, Kelly JB. In vitro brain slice studies in the rat's dorsal nucleus of the lateral lemniscus. III. Synaptic pharmacology. J Neurophysiol. 1996;75:1271–1282. doi: 10.1152/jn.1996.75.3.1271. [DOI] [PubMed] [Google Scholar]