

Abstract
Descriptions of receptive fields at subcortical levels of the visual system have mostly considered only the classical receptive field (CRF). A suppressive extraclassical receptive field (ECRF) has been demonstrated in relay cells within the primate lateral geniculate nucleus (LGN), but the quantitative properties and specific influence of the ECRF on the distinct magnocellular (MC), koniocellular (KC), and parvocellular (PC) pathways are not known. Here we quantified the effect of ECRF stimulation on visually responsive cells in the LGN of a diurnal New World primate, the marmoset. We show that for all cells, visually evoked responses are reduced by stimulation of the ECRF. The magnitude of the suppression is greatest for MC cells and smallest for PC cells. The effect of ECRF stimulation on KC cells is variable but always suppressive. We refer to these effects as extraclassical inhibition (ECI). The contrast–response relationship of the ECI parallels that of CRF-induced excitation for each cell class: for MC cells, ECI contrast threshold is close to 10% and the ECI saturates at 50% contrast, but the contrast dependence of ECI on PC cells is more linear. The ECI also contributes to contrast-dependent changes in spatial summation: on average for all LGN cells the radius of the excitatory spatial summation field (measured from aperture-tuning curves) at low contrast is 1.31 times that at high contrast. No consistent effects of orientation on ECI were seen. The data suggest that the suppressive component of the ECRF seen in cortical neurons could primarily be inherited from subcortical input streams.
Keywords: vision, marmoset, parallel pathways, receptive field, extraclassical, surround modulation
The classical receptive field (CRF) is a region of visual space where presentation or withdrawal of light causes changes in the rate of action potentials in a visually responsive unit (Hartline, 1940; Kuffler, 1953; Hubel and Wiesel, 1959). The extraclassical receptive field (ECRF) is a region of visual space where an appropriate stimulus can modulate the responses evoked from the CRF (for review, see Allman et al., 1985). In primary visual cortex, the ECRF can act to either suppress or to facilitate responses, and the ECRF has been proposed to underlie perceptual phenomena including detection of orientation discontinuities, “filling-in” phenomena, and figure-ground processing (Fiorani et al., 1992; Kapadia et al., 1995; Polat et al., 1998; Li et al., 2000).
One manifestation of an ECRF, termed the “suppressive field,” has been consistently demonstrated in relay cells within the lateral geniculate nucleus (LGN) (Hubel and Wiesel, 1961; Singer and Creutzfeldt, 1970; Levick et al., 1972). In the cat LGN, the ECRF acts primarily by inhibition (Cleland et al., 1983; Vidyasagar, 1984; Murphy and Sillito, 1987; Sillito et al., 1993; Jones et al., 2000). Few studies have examined the ECRF in primate LGN, and fundamental questions remain unanswered. First, it is not clear whether the ECRF is solely suppressive in primates (McClurkin and Marrocco, 1984; Marrocco and McClurkin, 1985; Felisberti and Derrington, 2001). Second, whether the ECRF influences activity in each of the distinct parallel [parvocellular (PC), magnocellular (MC), and koniocellular (KC)] subdivisions of the subcortical visual pathway is not known. Third, quantitative comparison between the ECRF effects in primate visual cortex and lateral geniculate nucleus is still lacking.
Here we describe the ECRF of relay cells in the LGN of the marmosetCallithrix jacchus, a diurnal New World monkey with high-acuity spatial vision (Ordy and Samorajski, 1968). Its retina and subcortical pathways are quantitatively comparable with that of Old World primates (Dacey and Petersen, 1992; Goodchild et al., 1996). The marmoset LGN contains a well defined KC layer between the main PC and MC layers (Kaas et al., 1978; Goodchild and Martin, 1998), making it possible to record selectively from KC cells in this species (for review, see Hendry and Reid, 2000).
The CRF properties of PC and MC cells in primates are overlapping but distinctive (Dreher et al., 1976; Derrington and Lennie, 1984; Kaplan and Shapley, 1986; Kremers and Weiss, 1997; Usrey and Reid, 2000; White et al., 2001). The properties of KC cells in the marmoset and in nocturnal primates (Norton and Casagrande, 1982; Norton et al., 1988;Solomon et al., 1999; White et al., 2001; Xu et al., 2001) are intermediate between those of PC and MC cells. Felisberti and Derrington (2001) showed that abrupt movement of remote targets (the “shift effect”; McIlwain, 1966; Cleland et al., 1971) inhibits ongoing activity in cells in all divisions of marmoset LGN. Here we characterize the ECRF of geniculate cells at a more local spatial scale, where robust ECRF effects are seen in cortical neurons (Kapadia et al., 1995; Levitt and Lund, 1997; Li et al., 2000).
MATERIALS AND METHODS
Extracellular recordings. Recordings were made from five adult male marmosets (Callithrix jacchus jacchus), body weight 250–390 gm. Animals were obtained from the Australian National Health and Medical Research Council (NHMRC) combined breeding facility. All procedures used conform with the provisions of the Australian NHMRC code of practice for the care and use of animals. All animals were initially sedated with isoflurane (ICI, 1.5–2%) and intramuscular ketamine (30 mg/kg) for surgery. A femoral vein and the trachea were cannulated. Animals were artificially respired with a 70–30% mixture of NO2:carbogen (5% CO2 in O2). A venous infusion of 40 μg · kg−1 · hr−1alcuronium chloride (Alloferin; Roche Products, Dee Why, Australia) in dextrose Ringer's solution was infused at a rate of 1 ml/hr to maintain muscular relaxation. Anesthesia was maintained during recording by intravenous infusion of sufentanil citrate (Sufenta-Forte; Janssen-Cilag; 4–8 μg · kg−1 · hr−1). Electroencephalogram and electrocardiogram signals were monitored to ensure adequate depth of anesthesia. End-tidal CO2 was measured and maintained near 4% by adjusting the rate and stroke volume of the inspired gas mixture. The pupils were dilated with topical atropine and neosynephrine. Penicillin and corticosteroids were administered daily.
The animal was mounted in a stereotaxic headholder. The eyes were protected with oxygen-permeable contact lenses and focused on a tangent screen at a distance of 114 cm. Refraction was optimized by adding the supplementary lens that maximized the spatial acuity of the first (parvocellular) unit encountered for each eye. The stereotaxic frame was tilted to bring the optic axis close to the horizontal plane, and the positions of the fovea and optic disk were mapped onto the tangent screen with the aid of a fundus camera equipped with a rear projection device. The table supporting the stereotaxic frame could be rotated as required to bring the receptive fields of recorded cells close to the center of the tangent screen. Such movements were monitored by means of a laser attached to the table.
A craniotomy was made over the LGN, and a microelectrode (parylene-coated tungsten or glass-coated steel; Impedance 5–12 MΩ; Frederick Haer Co., Bowdoinham, ME) was lowered into the LGN. Action potentials arising from visually responsive units were identified (Bishop et al., 1962). The time of their occurrence was measured with an accuracy of 0.1 msec and stored.
Visual stimuli. The location of the receptive field of each cell encountered was mapped on the tangent screen. A gimballed, front-silvered mirror was placed in the optical path, and its angle was adjusted to position the receptive field of the cell at the center of a CRT monitor. The optical path length to the monitor was 114 cm. Care was taken to position the receptive field precisely by centering the receptive field on a grating presented within a 0.1 or 0.2° diameter aperture at the center of the screen. The position of the receptive field was checked periodically. Adjustment was rarely required. Visual stimuli were generated by a VSG Series Three computer (Cambridge Research Systems, Cambridge, UK) and presented on a Reference Calibrator Plus monitor (Barco) at a frame refresh rate of 100 Hz. The mean luminance of the screen was 55 cd/m2. The colorimetric properties of the monitor were measured using a Pritchard-type photometer (PR-650; Photo Research, Palo Alto, CA). The reader should note that the small size of the marmoset eye (Troilo et al., 1993) means that retinal flux per candela is almost four times higher than for human. The maximum Michelson contrast was 98%. For all stimuli described below, gratings were surrounded by a uniform field (outer dimensions, 20 × 15°) at the mean luminance. Analysis of responses to heterochromatic stimuli (Yeh et al., 1995) for a subset of cells in each animal (data not shown) revealed that all animals expressed the 543 nm opsin in the medium–long (ML) wavelength-sensitive cone.
The optimal spatial frequency, temporal frequency, and orientation were determined for each cell using drifting gratings presented within a 2° diameter aperture. A contrast–response curve was measured to find a contrast that gave robust responses (generally 15–30 impulses/sec) within the linear contrast–response range of the cell. This “optimum grating” was presented in a series of circular apertures with varying radius (0.05–6°). It rapidly became apparent that responsivity to stimuli presented in large apertures was lower than that in smaller apertures for all but a few of the visually responsive units. Furthermore, for the vast majority of units, visual stimuli presented outside the optimal aperture (defined by the peak of the aperture-tuning curve) did not have any effect on the maintained discharge rate. The border of the optimum aperture thus lies outside the CRF. We hereinafter refer to these two regions as the CRF and extraclassical inhibitory field (ECI), and consider that properties of the contributing mechanisms are revealed by stimuli restricted to either inside, or outside, the optimum aperture. The reader should note, however, that the ECI mechanism, by analogy with the CRF surround mechanism, could extend through the CRF region.
The effect of ECI on spatial resolution was determined by measuring spatial frequency tuning curves in optimal and large (4–6o radius) apertures. Orientation tuning in the ECI was measured by presenting the optimum grating to the CRF and simultaneously presenting a second grating in a contiguous annulus. The parameters for the ECI stimulus were the same as for the CRF stimulus except that the ECI stimulus orientation was systematically varied. For some units the effect of orientation and spatial frequency of the CRF and ECI stimuli were investigated by systematically varying these parameters. The contrast–response relationship of CRF and ECI regions was measured. Responses were measured for seven CRF grating contrasts at each of four ECI grating contrasts between 0 and 100%. The spatial phase of the CRF and ECI stimuli was identical.
The effect of contrast on aperture tuning was measured, using two contrasts that gave robust responses and were within the linear range of the cell response. Presentations of high- and low-contrast conditions were interleaved. Aperture radius varied from 0.05–6o.
All stimuli were presented in interleaved or pseudorandom order, with a uniform field of mean luminance interposed for one second between each presentation.
Histological processing. The position of each recorded cell was noted by reading the depth from the hydraulic microelectrode advance (David Kopf Model 640). Electrolytic lesions (6–10 μA × 6–10 sec, electrode-positive) were made to mark the position of each electrode track. At the conclusion of the recording session, the animal was killed with an overdose of pentobarbitone sodium (80–150 mg/kg, i.v.) and perfused with 0.25 l of saline (0.9% NaCl) followed by 0.3 l of freshly prepared 4% paraformaldehyde in 0.1m phosphate buffer (PB). The brain was removed and post-fixed in the 4% paraformaldehyde in PB for 12 hr then placed in 30% sucrose in PB until it sank. Serial coronal sections at 30 μm thickness were cut on a freezing microtome, mounted, air-dried, counterstained with cresyl violet, dehydrated, and coverslipped with Ultramount. The position of recorded cells was reconstructed by identifying lesions and correlating changes in eye dominance with layer changes.
Data analysis. For each data point, 8–12 sec of cell response to two or three presentations of the stimulus was obtained. Peristimulus time histograms were constructed for each presentation and subject to discrete Fourier analysis. The average first harmonic amplitude was used as the measure of response. Spontaneous activity was calculated as the first harmonic amplitude during presentation of a uniform field at mean luminance. These presentations occurred between trials and at the end of each stimulus set. Optimal parameters were found by minimizing the mean square error (MSE) between the data and the function prediction using a Levenberg–Marquet optimization routine (Matlab version 5.2; Mathworks, Natick, MA).
Spatial frequency tuning. The difference-of-Gaussians (DOG;Rodieck, 1965) model of the CRF represents the sensitivity profiles of center and surround as Gaussian functions. For gratings of varying spatial frequency and fixed contrast, the center response,Rc, can be expressed as:
| Equation 1 |
where f is the spatial frequency of the stimulus in cycles per degree, C is the Michelson contrast of the stimulus, Kc is the peak sensitivity of the center Gaussian, and rc is the radius of the center Gaussian where sensitivity has fallen to 1/eof the peak (Enroth-Cugell and Robson, 1966; Croner and Kaplan, 1995). A similar expression can be written for the surround,Rs. The center and surround regions are considered to be antagonistic such that the response of the cell,R, is:
where R0 is spontaneous activity. Substituting in the expressions for the spatial frequency tuning curves of center and surround (Eq. 1) gives:
| Equation 2 |
where Ks is the peak sensitivity of the surround Gaussian, and rs is the radius of the surround Gaussian where sensitivity has fallen to 1/e of the peak. Spatial frequency tuning curves were fit with Equation 2 with four free parameters:Kc, rc,Ks, and rs. The parameters were constrained to be positive. For some purposes (see below), only the center radius and sensitivity were estimated, from data points at and above the optimal spatial frequency, using two free parameters, Kc andrc.
Aperture-tuning curves. Responses to stimuli presented in variable-sized apertures were fit with a model developed to describe spatial summation in visual cortex (Sceniak et al., 1999). Response amplitude is modelled as the difference of the integrals of two Gaussians. One Gaussian describes the excitatory discharge region, and the other Gaussian describes the inhibitory surround. In the spatial domain, this equation has the form:
| Equation 3 |
where s is the radius of the aperture in degrees, andR0 is the spontaneous activity. There are four free parameters: Ke andre, the peak sensitivity and radius of the excitatory Gaussian; and Ki andri, the peak sensitivity and radius of the inhibitory Gaussian. As with the classical DOG model, the radii in this model, re andri, are the radius of the relevant Gaussian where sensitivity has fallen to 1/e of the peak. For each aperture radius (s), the excitatory and inhibitory responses are estimated by integrating each Gaussian for ally such that −s ≤ y ≤ s. The four free parameters were estimated by fitting the function to the data with the only constraint that these parameters be positive.
Contrast–response curves in annuli of varying contrast. By separately presenting stimuli to the classical and extraclassical fields, it should be possible to gain more insight into the nature of the interactions between the two regions. The contrast–response relationships of the excitatory and inhibitory regions were measured, and modelled as independent Naka-Rushton functions with the form:
| Equation 4 |
where a is the saturating response amplitude of the mechanism, and b is the contrast at half that amplitude. We evaluated two ways in which the ECI could exert its effect on the CRF response: (1) the ECI is subtractive or (2) the ECI is divisive. Subtractive inhibition was modelled as:
| Equation 5 |
and divisive inhibition was modelled as:
| Equation 6 |
where R0 is the spontaneous activity of the LGN cell, E is the Naka-Rushton function for excitation, of the form in Equation 4, I is the function for inhibition, SC is the contrast of the inner grating, andAC is the contrast of the annulus grating. We assumed that both contrast–response functions passed through 0 at 0% contrast and therefore that the LGN cell generated any spontaneous activity (R0). For the subtractive model (Eq. 5), the contrast–response curve must pass through the point (0,R0) only when the annulus contrast is 0%. For the divisive model (Eq. 6), the contrast–response curve must pass through the point (0, R0) for all annulus contrasts. When negative firing rates were predicted by the subtractive model, they were coerced to zero before calculating the fit error. Both Equations 5 and 6 have four free parameters: the maximum amplitude,ae and half-saturation contrast,be, of the excitatory region; and the maximum amplitude, ai and half-saturation contrast, bi, of the inhibitory region. The initial gain of each mechanism is defined asa/b. For a cell with a linear contrast–response function, the half-saturation constant and response maximum are poorly constrained. For this reason the upper limit of the half-saturation constants, be andbi was set to be 3000. The parameters were estimated by fitting the function to the matrix of 28 data points (seven CRF contrasts at each of four ECRF contrasts).
RESULTS
In the following, we show that the ECRF in marmoset LGN cells acts to inhibit visually evoked activity. This effect is referred to as ECI. We show that ECI is more pronounced in MC cells and KC cells than in PC cells. The ECI has a higher spatial frequency resolution than the classical surround, is not sensitive to orientation, and its strength increases with increasing contrast. The ECI thus contributes to length tuning and provides a contrast gain control to LGN cells. Furthermore, the ECI contributes to contrast-dependent changes in spatial summation. Thus, significant attributes of the ECRF of cortical cells are already manifest at the subcortical level.
A total of 61 LGN cells was recorded. Of these, 27 were PC cells, 23 were MC cells, and 11 were in the KC layer between the internal parvocellular and magnocellular layers, also called the Ipm (Kaas et al., 1978; White et al., 1998). Three of the KC cells were “blue-on” cells. All but one cell (a KC cell) in the dataset showed linear spatial summation (presence of a null spatial phase) when tested with contrast reversal gratings.
Figure 1 shows the fundamental observation. For this MC cell the spontaneous activity (Fig.1A) is not changed when an annulus grating is presented outside the CRF (Fig. 1B). However, the vigorous response elicited from the CRF by a grating of optimal spatial and temporal frequency (Fig. 1C) is substantially reduced when the grating is extended to cover 12° of visual space (Fig.1D). The DOG model of the CRF (Rodieck, 1965) and the frequency-domain fit to the responses of one MC cell are shown in Figure 2. Note that the DOG model (Eq. 2) (Fig. 2A,B) predicts that at the optimal spatial frequency or above, the classical surround does not contribute to the cell response. Nevertheless, this grating, which isolates the classical center mechanism, causes response attenuation in large apertures (Fig.2D). Sceniak et al. (1999) showed that for primary visual cortex in macaque, a spatial difference-of-Gaussians (sDOG) model (Eq. 3) (Fig. 2C) provides a good description of the cell response to varying aperture size. In the following we show that the model can be used to study ECI in primate LGN cells.
Fig. 1.

Extraclassical inhibition in an MC cell. Each panel shows the stimulus configuration above a peristimulus time histogram. A, Spontaneous activity to uniform field at mean luminance. Solid circle shows the radius where sensitivity of the CRF center falls to 5% of peak (0.152° radius).Dashed circle shows the inner radius of the annulus inB. B, Spontaneous activity is not changed by the presence of an annulus grating with inner diameter beyond the CRF. C, Response to grating of optimal spatial frequency and optimal aperture. D, Response to large field grating. Outer diameter in B, D, 12°. Grating contrast, 98%; spatial frequency, 0.8 cycles/°; drift velocity, 16 cycles/sec.
Fig. 2.

Analytic descriptions of receptive field.A, CRF. Sensitivity is the sum of antagonistic, concentric subregions. Response to sinusoidal gratings that vary in spatial frequency but not spatial extent is predicted as shown in the DOG equation (see Materials and Methods). B, Responses (circles) and the best fitting DOG model (solid line) for one MC cell. C, Response amplitude for gratings presented in varying apertures is predicted by the sum of excitatory and inhibitory summation fields (see Materials and Methods). D, Response amplitude (circles) and best fitting prediction of the model (solid line) to gratings of fixed spatial frequency (0.4 cycles/°). MC cell: contrast, 12%; fit parameters: B,rc = 0.281,rs = 2.093; D,re = 0.698,ri = 2.562.
Figure 3 shows aperture-tuning curves and the best-fitting sDOG model for typical PC, MC, and KC cells. We emphasize that these curves were measured at optimal spatial frequency, and thus the contribution of the classical surround to the aperture tuning curve should be negligible. We first asked whether the different cell classes were equally affected by ECI. Response suppression was quantified as response amplitude to large (diameter 12°) gratings as a percentage of response amplitude at the peak of the aperture-tuning curve. The mean response in MC cells in large apertures was 46.4% of the response in optimal aperture (SD = 16.6%; n = 23). For PC cells, suppression was also present, but was weaker (mean = 71.1%; SD = 13.0%; n = 27). The two populations are significantly different (p < 0.0001; Student's t test). The KC cells showed various degrees of aperture tuning: suppression in three of the eleven cells was greater than any observed in the PC layers. No clear differences between on- and off-center units were apparent for any cell group. In summary, all LGN cells show suppression from the ECRF, and this suppression is, on average, greatest in MC cells.
Fig. 3.

Extraclassical inhibition in marmoset LGN.A–C, Responses of one PC (A), one MC (B), and one KC (C) cell to optimal spatial frequency gratings as a function of aperture radius.Solid lines show predictions of the model described in Figure 2C. Arrows show the radii of center (open arrows) and surround (filled arrows) components of the DOG model, as described in Figure2A. The KC cell had coextensive center and surround. All cells show a reduction in response in large apertures. The magnitude of this reduction (amplitude in 6° radius aperture as a percentage of maximum amplitude) was: PC cell, 67.1%; MC cell, 53.2%; and KC cell, 70.4%. Error bars are ± 1 SEM for at least 40 stimulus cycles. D–F, Response suppression for each subdivision of the LGN. Solid bars in Fshow “blue-on” cells. Stimulus and fit parameters:A, 2.4 cycles/°, 50% contrast,rc = 0.076,rs = 0.333,re = 0.185,ri = 1.08; B, 0.8 cycles/°, 25% contrast, rc = 0.135,rs = 0.647,re = 0.481,ri = 1.279; C, 0.4 cycles/°, 80% contrast, rc = 0.145,rs = 0.145,re = 0.922, ri = 0.939.
Effect of ECI on spatial tuning
How does the ECI act to reduce the sensitivity to stimuli in the CRF? We considered two possibilities: the action of the ECI could be manifest as a reduction in either (1) the radius, or (2) the peak sensitivity, of the CRF center. To distinguish these possibilities, spatial frequency tuning curves were measured within the linear contrast range in both optimal and large apertures. The high-frequency limb of each response function was fit with a single Gaussian describing the classical center mechanism (see Materials and Methods). For the cell shown in Figure4A, the classical center radius (rc) in the large aperture was reduced to 98.4% of that in the optimum aperture. On average, little change in radius was seen in the sample of cells (mean, 100.22%; SD, 26.04%; n = 40) (Fig.4B). The differences in peak sensitivity (Kc) of the center were quantified in the same way. For the cell in Figure 4A, the peak sensitivity in the large aperture was 72.4% that in the optimum aperture. The average decrease for the population of cells was 72.5% (SD, 29.7%; n = 40). Thus, the peak sensitivity of the center mechanism is substantially decreased in large apertures. This ECI-induced attenuation was more pronounced in MC cells (mean, 57.0%; SD, 24.7%; n = 17) than PC cells (mean, 80.5%; SD, 16.9%; n = 18). As noted above, contribution of the classical surround mechanism to this effect is practically ruled out because the surround does not contribute to responses at or above the optimal spatial frequency. We conclude that the ECI action is predominantly manifest as a decrease in the peak sensitivity of the CRF. Figure 4C shows that for the majority of cells, this leads to a decrease in the contrast sensitivity (volume) of the center mechanism.
Fig. 4.

Aperture dependence of center size.A, Spatial frequency tuning curves measured in large (filled circles; radius, 4°) and optimal (open circles; radius, 0.5°) apertures. Coarse dashed line, Prediction of DOG model (Eq. 2 in Materials and Methods) for responses in the large aperture. Solid line, dotted line, Prediction for center Gaussian in the optimal and large apertures, respectively. The center radius in optimal aperture (0.063°) was slightly larger than that in large aperture (0.062°).B, Comparison of center radii estimated in large and optimal apertures for all cells tested (n = 40). The dashed line shows 1:1 relationship. There is little change in the size of the classical receptive field center with changing aperture size. C, Comparison of center volume (Kc .π . rc2) estimated in large and optimal apertures for all cells tested. The dashed line shows 1:1 relationship. Most points lie below the line, indicating that the contrast sensitivity of receptive field centers is lower in large apertures.
The radius and peak sensitivity of the CRF center increases with eccentricity in the visual field (Derrington and Lennie, 1984; Croner and Kaplan, 1995; Kremers and Weiss, 1997). We asked whether the optimum aperture size also increases with eccentricity. Figure5A shows classical center radius as a function of eccentricity, measured within large apertures (radius 4–6o). Figure 5B shows that excitatory field radius also increases with eccentricity. There were similar increases for classical surround and inhibitory field radii, although these values were more variable (Fig. 5C,D). Regression lines with the form rc = exp(a.x + b), wherex is eccentricity in degrees, were fit to the CRF center data. For PC cells, the slope, a, was 0.11, and therc intercept, b, was −3.4. For MC cells, a was 0.07 and b was −2.4. Regression lines with the same form, re = exp(a.x + b), wherex is eccentricity in degrees, were fit to the excitatory field radius data. For PC cells, the slope, a, was 0.078, and the intercept, b, was −1.7. For MC cells, awas 0.084, and b was −1.5. Thus, PC cells have, on average, smaller CRF center radii and smaller excitatory summation field radii than MC cells at any eccentricity.
Fig. 5.

Eccentricity dependence of classical and extraclassical receptive field size. A, Classical center radius (rc). B, Excitatory summation radius of LGN cell (re). C, Classical surround radius (rs).D, Radius of extraclassical inhibitory region (ri). Lines inA and B show best fitting power laws for MC and PC cells, as described in Results.
Figure 6 shows that the CRF center size is strongly correlated to the excitatory radius, but less so to the inhibitory radius. Two possible relationships between the sizes of the CRF center and the excitatory or inhibitory summation field were evaluated. The first was a linear relationship, with the formre = a ·rc + b. The second was a power law relationship, with the form re =b ·rca. The MSE between the data points and the regression line was calculated for each relationship. Excitatory radius (re) was highly correlated with CRF radius (rc) (linear: re = 3.191 ·rc + 0.075;r2 = 0.696; MSE = 0.068; power: re = 2.023 ·rc0.721;r2 = 0.611; MSE = 0.086;p < 0.0001 in both cases). The linear function provides a slightly better fit to the relationship between CRF center size and excitatory field radius, although as is obvious from Figure6A, the two functions are similar in the range measured. Inhibitory radius (ri) showed a similar, though less well correlated, relationship with CRF center size (linear: ri = 3.184 ·rc + 0.64;r2 = 0.338; MSE = 0.289; power: ri = 2.884 ·rc 0.512;r2 = 0.407; MSE = 0.305;p < 0.0001 in both cases). In summary, there is a strong relationship between the CRF center radius and the dimensions of the excitatory and inhibitory summation fields of LGN neurons.
Fig. 6.

Comparison of classical and extraclassical receptive field size. The estimated radii of the classical receptive field center is compared with the excitatory (A) and inhibitory (B) summation field estimated from the sDOG model. Dashed lines showing a 1:1 relationship are shown in each panel. Solid and dotted lines show linear and power relationships, as described in Results.
Orientation tuning of ECI
Studies in the cat LGN show that the ECI effect is dependent on the relative orientation of stimuli presented to the classical and extraclassical fields (Sillito et al., 1993). We asked whether this effect is also present in primate LGN. Gratings were presented simultaneously to the CRF and ECI regions. The orientation of the CRF grating was optimized for the cell. The orientation of the ECI grating was varied. Other stimulus parameters were optimal for the CRF, and were identical for both regions. The results (Fig.7) showed that in general, ECI grating orientation has only weak effects. The cells in Figure 7,A and B, are the cells in the dataset that showed the greatest dependence on ECI grating orientation. The cell in Figure7A shows least suppression when the two stimuli were orthogonal. This effect was independent of the direction of movement of the ECI grating. The KC cell in Figure 7B shows least suppression when the two stimuli were parallel and shows some direction-dependent effect of ECI orientation, with a minimum at approximately −90°. Two other KC cells also showed ECI grating direction dependence. A more typical cell is shown in Figure7C. In this case, the most obvious effect of the annulus was to suppress the response of the cell at all annulus orientations, with a slightly greater suppression when the annulus and inner grating were parallel.
Fig. 7.

Response of LGN cells to annulus orientation. Stimulus was two concentric gratings with different orientations.A–C, Response (open circles) of three LGN cells as a function of the outer grating orientation. The response of the cell to the inner grating alone is shown by the filled circle at the right of each plot.D, E, Inhibition in LGN cells is unaffected by the orientation of the annulus grating at optimal (D) and low (E) spatial frequencies. Response was calculated as a percentage of the response without an annulus grating present. Error bars indicate 1 SEM.
Overall, there was little difference between the effect of parallel or orthogonal gratings of optimal spatial frequency for any of the cell groups (Fig. 7D). It has been suggested that the effect of annulus orientation is greater at low spatial frequencies (Cudeiro and Sillito, 1996). We tested a subset of cells (Fig. 7E) with low spatial frequency gratings (≤0.4 cycles/°). There was no systematic effect of annulus orientation. In cells where the CRF showed significant orientation bias, the effect of annulus orientation was also tested at preferred and nonpreferred orientations of the center spot (data not shown). Many cells were also tested with the annulus-orientation paradigm at several spatial frequencies and with aperture sizes above or below optimum. None of these manipulations generated consistent annulus orientation tuning.
Effect of contrast on spatial summation in LGN neurons
Sceniak et al. (1999) showed that spatial summation in macaque primary visual cortical cells is contrast-dependent. We asked whether this effect is already present at the level of the LGN. The effect of contrast on the sizes of the excitatory (re) and inhibitory (ri) spatial summation mechanisms was measured as shown in Figure 8. For the cells in Figure 8A–C, the excitatory summation region was larger at lower contrast. For the PC cell in Figure8A, the value of re at low contrast was 1.45 times the size at high contrast; for the MC cell in Figure 8B the ratio ofre at low contrast to that at high contrast was 2.37; for the KC cell in Figure 8C, the ratio was 1.16. The radius of the inhibitory region showed less consistent changes.
Fig. 8.

Effect of contrast on aperture tuning in LGN.A–C, The sDOG model was fit to the responses at low (open circles) and high (filled circles) contrast for a PC cell (A), MC cell (B), and KC cell (C).Insets show contrast–response curves for each neuron.Arrows indicate the contrasts used. Fit parameters (re,ri): A, low contrast (50%), 0.38, 0.58, high contrast (75%), 0.26, 1.52; B, low contrast (10%), 1.1, 1.13, high contrast (20%), 0.47, 2.19, C, low contrast (50%), 0.96, 1.08, high contrast (98%); 0.84, 0.87.
Aperture tuning curves were measured at two contrasts for 57 cells (26 PC, 20 MC, 11 KC). For all cell groups, the radius of the excitatory field increases at lower contrasts. On average the radius of the excitatory field at low contrast is 1.31 times that at high contrast (Fig. 9A,B) (p < 0.001, paired Student's ttest). Such a consistent change in size was not the case for the inhibitory field (mean ratio of ri at low contrast to ri at high contrast was 1.05, data not shown, p = 0.3, paired Student's ttest). The relative strength of the ECI also declines at low contrast, particularly for MC cells (Fig. 9C,D). On average, the percentage-of-peak response of the cell at low contrast is 1.18 times that at high contrast (p < 0.0001; paired Student's t test).
Fig. 9.

Effect of contrast on spatial summation.A, Excitatory field size (re). Dashed line is a 1:1 relationship. Most points fall above the line, indicating that the size of the excitatory field is reduced at higher contrast for all cell classes. B, Histogram of the ratio ofre (low contrast) tore (high contrast) for all cells.C, Effect of contrast on the magnitude of ECI inhibition calculated as in Figure 3. Dashed line is a 1:1 relationship. D, Histogram of the ratio of ECI inhibition at low contrast to that at high contrast for all cells. The majority of cells show a ratio greater than one, indicating that as contrast increases, there is an increase in the amount of ECI.
For one blue-on koniocellular cell, aperture-tuning curves were measured for achromatic gratings and also for isoluminant gratings modulated along a short wavelength-sensitive (SWS) cone-isolating axis [CIE 1931 (x,y): (0.323, 0.271) to (0.400, 0.456)]. The maximum cone contrasts along this axis were 60.8% in the marmoset SWS cone and 1.7% contrast in the single ML cone present (in this case a cone with peak absorbance at 543 nm). These aperture tuning curves are shown in Figure10. For both conditions, the cell shows extraclassical inhibition that increases with contrast. For low achromatic contrast, the response in large aperture was 64.3% of the peak; for high contrast, it was 53.2% of the peak. For SWS-isolating gratings, responses in large apertures were 93.8% of the peak at low contrast and 85.2% of the peak at high contrast. Thus, extraclassical inhibition was higher for achromatic gratings than for SWS cone isolating gratings. Another difference can be seen in Figure 10: for achromatic gratings the peak aperture shrinks with increasing contrast such that the excitatory field radius at low contrast was 1.29 times that at high contrast. This phenomenon was not evident when SWS cone-isolating gratings were used (radius ratio, 1.03). Extraclassical inhibition to this blue-on cell is therefore dominated by input from ML cone mechanisms, with weaker input from SWS cone mechanisms.
Fig. 10.
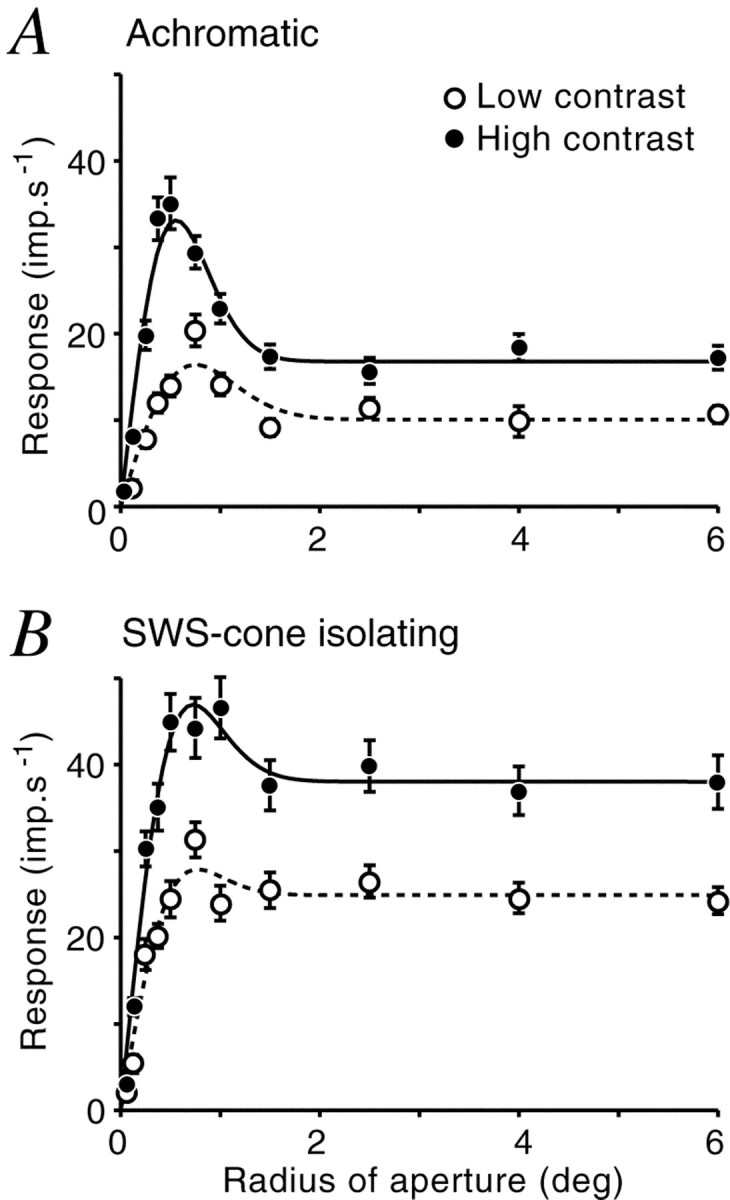
Extraclassical inhibition in a blue-on cell. Extraclassical inhibition was induced by either achromatic (A) or SWS-cone isolating (B) gratings. Achromatic gratings were presented at 25 and 50% contrast, and isoluminant gratings were presented at SWS-cone contrasts of 30.4% and 60.8%. Spatial frequency was the same in both conditions (0.8 cycles/°). Fit parameters (re,ri): A, low contrast, 0.747, 0.860, high contrast, 0.656, 0.680. B, Low contrast, 0.669, 0.698, high contrast, 0.642, 0.810.
The effect of ECI contrast on the contrast sensitivity of LGN cells
The final experiment examined the contrast–response relationship of the CRF and ECI regions. Concentric gratings with independently variable contrast were presented simultaneously. The diameter of the inner grating was optimal for the cell and therefore mainly stimulated the excitatory input of the CRF. The contiguous annulus grating was used to stimulate the ECI region. The stimulus configuration is shown in Figure 11B.
Fig. 11.
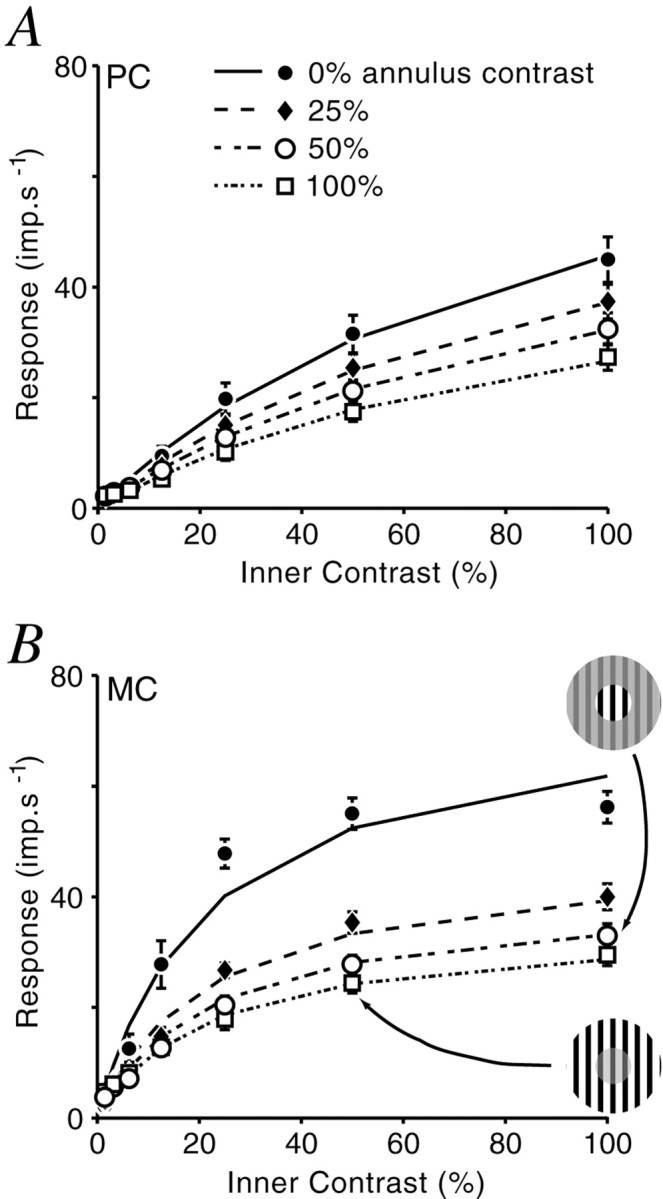
Contrast–response relationship of ECI.A, Average response of PC cells (n = 18). B, Average response of MC cells (n = 14). Lines are the prediction of a model of divisive inhibition from the extraclassical field. Two examples of the stimuli are shown in the diagram in B. Error bars indicate ± 1 SEM.
Figure 11 shows average responses of PC (Fig. 11A) (n = 18) and MC (Fig. 11B) (n = 14) cells. When the contrast delivered to the CRF was below ∼8%, the response of most cells was not altered by the presence of an annulus grating. In three of the MC cells in this sample, responses at low CRF contrasts were facilitated by high-contrast annulus gratings. At CRF contrasts >8%, however, the effect on all cells was exclusively suppressive. The contrast–response properties of both MC and PC cells are preserved at all ECI contrasts: PC cells are relatively insensitive, and their response is an approximately linear function of contrast delivered to the CRF; MC cells are more sensitive, and their response shows saturation at higher CRF contrasts.
Responses were fit to a model incorporating separate contrast–response functions for the CRF and ECI. Two models were evaluated (see Materials and Methods). The divisive model of inhibition (Eq. 6) proved superior to the subtractive model (Eq. 5). The MSE returned by the divisive model was 11.87 (SD = 11.45). This value is significantly lower than that of the subtractive model (MSE, 21.94; SD, 22.32;p = 0.0081; paired Student's t test). Best-fit results of the divisive model are shown as solid lines in Figure 11.
In Figure 12A, the half-saturation constants of CRF excitation (be) and ECI inhibition (bi) from the divisive model are plotted. The dashed lines show the maximum values allowed in the fit. This plot shows that MC and PC cells are primarily segregated by the half-saturation constant of the CRF, with MC cells having, as expected, lower values. In Figure 12B, the initial gain of CRF excitation and ECI inhibition is plotted for each cell. As expected, the contrast gain of excitation to MC cells is generally higher than that for PC cells. Contrast gain values of ECI inhibition to MC and PC cells are less well segregated, but are on average higher in MC cells. We conclude that the contrast–response properties of the ECI largely reflect the properties of the CRF.
Fig. 12.

Contrast–response characteristics of CRF excitation and ECI. A, Contrast at half-maximum response for excitation and inhibition. Dashed lines show the upper constraint boundary of the fit. B, The initial contrast gain of excitation and inhibition. The values from fits to average PC and MC responses (Fig. 11) are shown by theopen and filled crosses, respectively. Histograms of each parameter are shown above each plot for CRF excitation and to the right of each plot for extraclassical inhibition.Solid line, PC cells; dashed line, MC cells. The CRF excitation to MC cells is more sensitive to contrast and saturates at lower contrasts than does the excitation to PC cells. The extraclassical inhibition to the two classes shows a similar functional division, but there is more overlap.
DISCUSSION
We show that the functional properties of marmoset lateral geniculate neurons are influenced by stimuli that extend beyond the boundary of the classical receptive field. This ECI is probably equivalent to the suppressive field identified previously (Hubel and Wiesel, 1961; Singer and Creutzfeldt, 1970; Levick et al., 1972). We have three major findings. First, the ECI influences the response of PC cells less than it does MC or KC cells. Second, the degree of ECI inhibition is dependent on the contrast of the stimulus. Third, the spatial summation properties of PC and MC cells are influenced by ECI contrast.
Classical receptive fields and extraclassical inhibition in the LGN
We show here that the size of excitatory summation field of PC cells is smaller than that of MC cells at a given eccentricity. The radius of both CRF center and excitatory summation field increases with visual eccentricity. The excitatory field radius (re) is larger than the classical receptive field radius (rc), but the two sizes are strongly linked. This suggests that the two measurements have a common underlying determinant.
Two possible sources of the excitatory summation field can be identified. The first is subthreshold excitation from the classical center mechanism. This is compatible with a Gaussian model of the classical center mechanism because a Gaussian is, by definition, infinitely large. Much of this region will be below threshold activation levels for the cell. A second potential source is the receptive field of one or more cortical cells, which provide an additional excitatory input to an LGN cell. The excitatory field size is compatible with cortical minimum discharge fields in marmoset V1 (radius of ∼0.5° for parafoveal region) (Rosa et al., 1997). In macaque monkey, cortical feedback to LGN cells increases the sensitivity of LGN neurons when stimuli are presented within optimal apertures (Przybyszewski et al., 2000).
The source of extraclassical inhibition to LGN cells is unlikely to be the classical surround for three reasons. First, ECI gratings at or above the optimal spatial frequency of each cell caused inhibition (Fig. 4A). Second, there was no apparent relationship between the sizes of the classical surround and the ECI field. Third, although some contribution of the classical surround would be expected for small aperture diameters (this arises because space-averaged luminance is only constant if the aperture diameter is an integer multiple of the grating period), yet this effect would decrease with increasing aperture diameter. In summary, it is possible that the classical surround contributes to the size of the excitatory summation field, but it most probably will not contribute to the ECI.
All this suggests that the ECI arises from a mechanism with a summation field that is slightly larger than the CRF center. One likely source of the ECI is interneurons within the LGN. In cat, these interneurons have similar spatial tuning to relay cells (Dubin and Cleland, 1977), and each relay cell receives input from inhibitory interneurons with receptive fields slightly displaced from that cell (Singer and Creutzfeldt, 1970). If this situation holds in the primate, then the spatial extent of inhibition will be larger than that for excitation, causing aperture tuning. An additional source of the ECI field may already be present in retinal ganglion cells as a result of the action of inhibitory amacrine and horizontal cell networks. We asked whether the peripheral inhibition found here relates to the “shift-effect” of retinal and LGN cells (McIlwain, 1966; Cleland et al., 1971;Felisiberti and Derrington, 1999). Felisberti and Derrington (2001)(their Fig. 3) showed that the shift effect in marmoset LGN, like the ECI, acts by divisive suppression on both MC and PC contrast sensitivity. Quantitative comparison on other dimensions, however, suggests that the shift effect and the ECI are quite distinct phenomena. The inhibitory summation field radius for ECI is <2° for all cells of <10° eccentricity (Fig. 5D). This is much smaller than the inner aperture radius (5°) used by Felisberti and Derrington (2001). Furthermore, the contrast sensitivity and spatial grain of ECI are linked to these properties of the CRF (Figs. 6, 12), but the MC and PC populations (with the possible exception of MC cells near the fovea) are rather uniformly influenced by the shift effect (Felisberti and Derrington, 2001).
Effects of contrast
The excitatory summation field of LGN cells was smaller at high contrasts than at low contrasts. The excitatory summation field of macaque V1 neurons likewise decreases with increasing contrast (Sceniak et al., 1999). The mean ratio of excitatory field size at low contrast to that at high contrast in marmoset LGN was 1.31. In macaque V1, this value is 2.34 (Sceniak et al., 1999). The LGN thus makes a substantial contribution, either in a feedforward manner or as part of a recurrent circuit, to contrast-dependent spatial summation in V1.Kremers et al. (2001) demonstrated small decreases in the CRF center size of MC cells at high contrasts, where the response of MC cells had already saturated. We show here that, in the same way as for V1 (Sceniak et al., 1999), the ECI-induced decrease in the excitatory summation field in LGN occurs at contrasts below saturation levels in the LGN.
The contrast–response curves obtained in optimal apertures should be dominated by the properties of the CRF. Accordingly, responses measured in optimum apertures showed distinct characteristics for PC and MC cells (Figs. 11, 12). However, the contrast sensitivity of MC and PC cells, when tested with large stimuli, shows substantial overlap in the marmoset LGN (Solomon et al., 1999; Kremers et al., 2001; White et al., 2001). We show here (Figs. 11, 12) that one effect of the ECI field is to decrease the contrast sensitivity of MC cells more than PC cells, causing the sensitivity of the two populations to overlap more when the ECI is active.
Functional utility of extraclassical inhibition
The suppressive effect of ECI depends on the contrast presented to the CRF as well as the contrast presented to the ECRF. The ECI field in the LGN thus is a potential source for a contrast gain control in relay cells. Such a geniculate gain control has already been suggested to account for the contrast-dependent nature of retinogeniculate transmission rates in primate LGN cells (Kaplan et al., 1987, 1993), and may be further elaborated by cortical mechanisms (Heeger, 1992).
The functional role of contrast-dependent aperture tuning in LGN may be the same as suggested for V1 (Sceniak et al., 1999). As contrast increases, the excitatory summation field decreases, so image features are more spatially localized in the output of the LGN cell. If one accepts the arguments made elsewhere that PC cells are the major input to the “what” pathway of cortical visual processing, then relative freedom from extraclassical inhibition is functionally adaptive. The size and location of a pattern is less important for mechanisms fed by the PC pathway than the textural features of the pattern. Conversely, if MC cells dominate the “where” pathway, then the size and location of an object are critical variables, and greater extraclassical inhibition would be advantageous. In summary, our results are compatible with the hypothesized roles of the two major LGN subdivisions.
Extraclassical receptive fields in LGN and visual cortex
Our results reinforce previous evidence (Schiller et al., 1976;Cleland et al., 1983; Sillito et al., 1993; Jones et al., 2000) that at least some of the ECRF properties of cortical neurons are already present in the LGN afferents to cortex. Two clear distinctions must nevertheless be made between the ECRF properties of geniculate and cortical cells. First, in primary visual cortex of both cat and primate, ECRF effects are usually orientation-specific (Li and Li, 1994; Sillito et al., 1995; Levitt and Lund, 1997), but we found little evidence for orientation specificity of ECI in marmoset LGN. Second, the ECRF in primary visual cortex exerts both facilitatory and suppressive effects (Levitt and Lund, 1997; Polat et al., 1998), but the effects in LGN were exclusively suppressive. It is still unclear whether these effects are linked, that is, whether the ECRF of primary visual cortical neurons is simply a combination of orientation-tuned facilitation and orientation-insensitive suppression (Schiller et al., 1976; Nelson and Frost, 1978; Levitt and Lund, 1997; Somers et al., 1998; Buzas et al., 2001). Our results do not address this proposal directly, but would give the following prediction. If the suppressive ECRF effects in cortex can be attributed entirely to the properties of LGN cells, then the suppressive aspect of the ECRF in primary visual cortical neurons should be orientation-independent, and the suppressive ECRF contrast sensitivity should bear the signature of the pathway (PC, MC, or KC) that provides the dominant input to the cortical cell.
Footnotes
This work was supported by National Health and Medical Research Council Grant 000164, Australian Research Council Grant A00104053, the Lion's Clubs NSW-ACT Public Health Care Foundation, a University of Sydney Medical Faculty Postgraduate Research Scholarship to S.G.S., and the Australian National Health and Medical Research Council. Dora Lush Award to A.J.R.W. We thank Ana Lara for excellent technical assistance and Michele Cavazzini for help in data analysis.
Correspondence should be addressed to Dr. Paul Martin, Department Physiology F13, University of Sydney, New South Wales 2006, Australia. E-mail: paulm@physiol.usyd.edu.au.
REFERENCES
- 1.Allman J, Miezin F, McGuinness E. Stimulus specific responses from beyond the classical receptive field: neurophysiological mechanisms for local-global comparisons in visual neurons. Annu Rev Neurosci. 1985;8:407–430. doi: 10.1146/annurev.ne.08.030185.002203. [DOI] [PubMed] [Google Scholar]
- 2.Bishop PO, Burke W, Davis R. The interpretation of the extracellular response of lateral geniculate cells. J Physiol (Lond) 1962;162:451–472. doi: 10.1113/jphysiol.1962.sp006944. [DOI] [PMC free article] [PubMed] [Google Scholar]
- 3.Buzas P, Eysel UT, Adorjan P, Kisvarday ZF. Axonal topography of cortical basket cells in relation to orientation, direction, and ocular dominance maps. J Comp Neurol. 2001;437:259–285. doi: 10.1002/cne.1282. [DOI] [PubMed] [Google Scholar]
- 4.Cleland BG, Dubin MW, Levick WR. Sustained and transient neurones in the cat's retina and lateral geniculate nucleus. J Physiol (Lond) 1971;217:473–496. doi: 10.1113/jphysiol.1971.sp009581. [DOI] [PMC free article] [PubMed] [Google Scholar]
- 5.Cleland BG, Lee BB, Vidyasagar TR. Response of neurons in the cat's lateral geniculate nucleus to moving bars of different length. J Neurosci. 1983;3:108–116. doi: 10.1523/JNEUROSCI.03-01-00108.1983. [DOI] [PMC free article] [PubMed] [Google Scholar]
- 6.Croner LJ, Kaplan E. Receptive fields of P and M ganglion cells across the primate retina. Vision Res. 1995;35:7–24. doi: 10.1016/0042-6989(94)e0066-t. [DOI] [PubMed] [Google Scholar]
- 7.Cudeiro J, Sillito AM. Spatial frequency tuning of orientation-discontinuity-sensitive corticofugal feedback to the cat lateral geniculate nucleus. J Physiol (Lond) 1996;490:481–492. doi: 10.1113/jphysiol.1996.sp021159. [DOI] [PMC free article] [PubMed] [Google Scholar]
- 8.Dacey DM, Petersen MR. Dendritic field size and morphology of midget and parasol ganglion cells of the human retina. Proc Natl Acad Sci USA. 1992;89:9666–9670. doi: 10.1073/pnas.89.20.9666. [DOI] [PMC free article] [PubMed] [Google Scholar]
- 9.Derrington AM, Lennie P. Spatial and temporal contrast sensitivities of neurones in lateral geniculate nucleus of macaque. J Physiol (Lond) 1984;357:219–240. doi: 10.1113/jphysiol.1984.sp015498. [DOI] [PMC free article] [PubMed] [Google Scholar]
- 10.Dreher B, Fukada Y, Rodieck RW. Identification, classification and anatomical segregation of cells with X-like and Y-like properties in the lateral geniculate nucleus of Old World primates. J Physiol (Lond) 1976;258:433–452. doi: 10.1113/jphysiol.1976.sp011429. [DOI] [PMC free article] [PubMed] [Google Scholar]
- 11.Dubin MW, Cleland BG. Organisation of visual inputs to interneurons of the lateral geniculate nucleus of the cat. J Neurophysiol. 1977;40:410–428. doi: 10.1152/jn.1977.40.2.410. [DOI] [PubMed] [Google Scholar]
- 12.Enroth-Cugell C, Robson J. The contrast sensitivity of retinal ganglion cells of the cat. J Physiol (Lond) 1966;187:517–552. doi: 10.1113/jphysiol.1966.sp008107. [DOI] [PMC free article] [PubMed] [Google Scholar]
- 13.Felisberti F, Derrington A. Long-range interactions in the lateral geniculate nucleus of the New-World monkey, Callithrix jacchus. Vis Neurosci. 2001;18:209–218. doi: 10.1017/s0952523801182064. [DOI] [PubMed] [Google Scholar]
- 14.Felisiberti F, Derrington AM. Long-range interactions modulate the contrast gain in the lateral geniculate nucleus of cats. Vis Neurosci. 1999;16:943–956. doi: 10.1017/s0952523899165143. [DOI] [PubMed] [Google Scholar]
- 15.Fiorani M, Rosa MGP, Gattass R, Rocha-Miranda CE. Dynamic surrounds of receptive fields in primate striate cortex: a physiological basis for perceptual completion? Proc Natl Acad Sci USA. 1992;89:8547–8551. doi: 10.1073/pnas.89.18.8547. [DOI] [PMC free article] [PubMed] [Google Scholar]
- 16.Goodchild AK, Martin PR. The distribution of calcium-binding proteins in the lateral geniculate nucleus and visual cortex of a New World monkey, the marmoset, Callithrix jacchus. Vis Neurosci. 1998;15:1–19. doi: 10.1017/s0952523898154044. [DOI] [PubMed] [Google Scholar]
- 17.Goodchild AK, Ghosh KK, Martin PR. Comparison of photoreceptor spatial density and ganglion cell morphology in the retina of human, macaque monkey, cat, and the marmoset Callithrix jacchus. J Comp Neurol. 1996;366:55–75. doi: 10.1002/(SICI)1096-9861(19960226)366:1<55::AID-CNE5>3.0.CO;2-J. [DOI] [PubMed] [Google Scholar]
- 18.Hartline HK. The receptive fields of optic nerve fibers. Am J Physiol. 1940;130:700–711. [Google Scholar]
- 19.Heeger DJ. Normalization of cell responses in cat striate cortex. Vis Neurosci. 1992;9:181–198. doi: 10.1017/s0952523800009640. [DOI] [PubMed] [Google Scholar]
- 20.Hendry SHC, Reid RC. The koniocellular pathway in primate vision. Annu Rev Neurosci. 2000;23:127–153. doi: 10.1146/annurev.neuro.23.1.127. [DOI] [PubMed] [Google Scholar]
- 21.Hubel DH, Wiesel TN. Receptive fields of single neurons in the cat's striate cortex. J Physiol (Lond) 1959;148:574–591. doi: 10.1113/jphysiol.1959.sp006308. [DOI] [PMC free article] [PubMed] [Google Scholar]
- 22.Hubel DH, Wiesel TN. Integrative action in the cat's lateral geniculate body. J Physiol (Lond) 1961;155:385–398. doi: 10.1113/jphysiol.1961.sp006635. [DOI] [PMC free article] [PubMed] [Google Scholar]
- 23.Jones HE, Andolina IM, Oakely NM, Murphy PC, Sillito AM. Spatial summation in lateral geniculate nucleus and visual cortex. Exp Brain Res. 2000;135:279–284. doi: 10.1007/s002210000574. [DOI] [PubMed] [Google Scholar]
- 24.Kaas JH, Huerta MF, Weber JT, Harting JK. Patterns of retinal terminations and laminar organization of the lateral geniculate nucleus of primates. J Comp Neurol. 1978;182:517–554. doi: 10.1002/cne.901820308. [DOI] [PubMed] [Google Scholar]
- 25.Kapadia MK, Ito M, Gilbert CD, Westheimer G. Improvement in visual sensitivity by changes in local context: parallel studies in human observers and in V1 of alert monkeys. Neuron. 1995;15:843–856. doi: 10.1016/0896-6273(95)90175-2. [DOI] [PubMed] [Google Scholar]
- 26.Kaplan E, Shapley RM. The primate retina contains two types of ganglion cells, with high and low contrast sensitivity. Proc Natl Acad Sci USA. 1986;83:2755–2757. doi: 10.1073/pnas.83.8.2755. [DOI] [PMC free article] [PubMed] [Google Scholar]
- 27.Kaplan E, Purpura K, Shapley RM. Contrast affects the transmission of visual information through the mammalian lateral geniculate nucleus. J Physiol (Lond) 1987;391:267–288. doi: 10.1113/jphysiol.1987.sp016737. [DOI] [PMC free article] [PubMed] [Google Scholar]
- 28.Kaplan E, Mukherjee P, Shapley R. Information filtering in the lateral geniculate nucleus. In: Shapley R, Lam DM-K, editors. Contrast sensitivity. MIT; Cambridge: 1993. pp. 183–200. [Google Scholar]
- 29.Kremers J, Weiss S. Receptive field dimensions of lateral geniculate cells in the common marmoset (Callithrix jacchus). Vision Res. 1997;37:2171–2181. doi: 10.1016/s0042-6989(97)00041-2. [DOI] [PubMed] [Google Scholar]
- 30.Kremers J, Silveira LCL, Kilavik BE. Influence of contrast on the responses of marmoset lateral geniculate cells to drifting gratings. J Neurophysiol. 2001;85:235–246. doi: 10.1152/jn.2001.85.1.235. [DOI] [PubMed] [Google Scholar]
- 31.Kuffler SW. Discharge patterns and functional organization of mammalian retina. J Neurophysiol. 1953;16:37–68. doi: 10.1152/jn.1953.16.1.37. [DOI] [PubMed] [Google Scholar]
- 32.Levick WR, Cleland BG, Dubin MW. Lateral geniculate neurons of cat: retinal inputs and physiology. Invest Ophthalmol Vis Sci. 1972;11:302–311. [PubMed] [Google Scholar]
- 33.Levitt JB, Lund JS. Contrast dependence of contextual effects in primate visual cortex. Nature. 1997;387:73–76. doi: 10.1038/387073a0. [DOI] [PubMed] [Google Scholar]
- 34.Li CY, Li W. Extensive integration field beyond the classical receptive field of cat's striate cortical neurons-classification and tuning properties. Vision Res. 1994;34:2337–2355. doi: 10.1016/0042-6989(94)90280-1. [DOI] [PubMed] [Google Scholar]
- 35.Li W, Thier P, Wehrhahn C. Contextual influence on orientation discrimination of humans and responses of neurons in V1 of alert monkeys. J Neurophysiol. 2000;83:941–954. doi: 10.1152/jn.2000.83.2.941. [DOI] [PubMed] [Google Scholar]
- 36.Marrocco RT, McClurkin JW. Evidence for spatial structure in the cortical input to the monkey lateral geniculate nucleus. Exp Brain Res. 1985;59:50–56. doi: 10.1007/BF00237664. [DOI] [PubMed] [Google Scholar]
- 37.McClurkin JW, Marrocco RT. Visual cortical input alters spatial tuning in monkey lateral geniculate nucleus cells. J Physiol (Lond) 1984;348:135–152. doi: 10.1113/jphysiol.1984.sp015103. [DOI] [PMC free article] [PubMed] [Google Scholar]
- 38.McIlwain JT. Some evidence concerning the physiological basis of the periphery effect in the cat's retina. Exp Brain Res. 1966;1:265–271. doi: 10.1007/BF00234346. [DOI] [PubMed] [Google Scholar]
- 39.Murphy P, Sillito AM. Corticofugal feedback influences the generation of length tuning in the visual pathway. Nature. 1987;329:727–729. doi: 10.1038/329727a0. [DOI] [PubMed] [Google Scholar]
- 40.Nelson JI, Frost BJ. Orientation-selective inhibition from beyond the classic visual receptive field. Brain Res. 1978;139:359–365. doi: 10.1016/0006-8993(78)90937-x. [DOI] [PubMed] [Google Scholar]
- 41.Norton TT, Casagrande VA. Laminar organization of receptive-field properties in lateral geniculate nucleus of bush baby (Galago crassicaudatus). J Neurophysiol. 1982;47:715–741. doi: 10.1152/jn.1982.47.4.715. [DOI] [PubMed] [Google Scholar]
- 42.Norton TT, Casagrande VA, Irvin GE, Sesma MA, Petry HM. Contrast-sensitivity functions of W-, X-, and Y-like relay cells in the lateral geniculate nucleus of bush baby, Galago crassicaudatus. J Neurophysiol. 1988;59:1639–1656. doi: 10.1152/jn.1988.59.6.1639. [DOI] [PubMed] [Google Scholar]
- 43.Ordy JM, Samorajski T. Visual acuity and ERG-CFF in relation to the morphologic organization of the retina among diurnal and nocturnal primates. Vision Res. 1968;8:1205–1225. doi: 10.1016/0042-6989(68)90028-x. [DOI] [PubMed] [Google Scholar]
- 44.Polat U, Mizobe K, Pettet MW, Kasamatsu T, Norcia AM. Collinear stimuli regulate visual responses depending on cell's contrast threshold. Nature. 1998;391:580–584. doi: 10.1038/35372. [DOI] [PubMed] [Google Scholar]
- 45.Przybyszewski AW, Gaska JP, Foote W, Pollen DA. Striate cortex increases contrast gain of macaque LGN neurons. Vis Neurosci. 2000;17:485–494. doi: 10.1017/s0952523800174012. [DOI] [PubMed] [Google Scholar]
- 46.Rodieck RW. Quantitative analysis of cat retinal ganglion cell response to visual stimuli. Vision Res. 1965;5:583–601. doi: 10.1016/0042-6989(65)90033-7. [DOI] [PubMed] [Google Scholar]
- 47.Rosa MGP, Fritsches K, Elston GE. The second visual area in the marmoset monkey: visuotopic organisation, magnification factors, architectonical boundaries, and modularity. J Comp Neurol. 1997;387:547–567. doi: 10.1002/(sici)1096-9861(19971103)387:4<547::aid-cne6>3.0.co;2-2. [DOI] [PubMed] [Google Scholar]
- 48.Sceniak MP, Ringach DL, Hawken MJ, Shapley R. Contrast's effect on spatial summation by macaque V1 neurons. Nat Neurosci. 1999;2:733–739. doi: 10.1038/11197. [DOI] [PubMed] [Google Scholar]
- 49.Schiller PH, Finlay BL, Volman SF. Quantitative studies of single-cell properties in monkey striate cortex. I. Spatiotemporal organisation of receptive fields. J Neurophysiol. 1976;39:1288–1319. doi: 10.1152/jn.1976.39.6.1288. [DOI] [PubMed] [Google Scholar]
- 50.Sillito AM, Cudeiro J, Murphy PC. Orientation sensitive elements in the corticofugal influence on centre-surround interactions in the dorsal lateral geniculate nucleus. Exp Brain Res. 1993;93:6–16. doi: 10.1007/BF00227775. [DOI] [PubMed] [Google Scholar]
- 51.Sillito AM, Grieve KL, Jones HE, Cudeiro J, Davis J. Visual cortical mechanisms detecting focal orientation discontinuities. Nature. 1995;378:492–496. doi: 10.1038/378492a0. [DOI] [PubMed] [Google Scholar]
- 52.Singer W, Creutzfeldt OD. Reciprocal lateral inhibition of on- and off-centre neurones in the lateral geniculate body of the cat. Exp Brain Res. 1970;10:311–330. doi: 10.1007/BF00235054. [DOI] [PubMed] [Google Scholar]
- 53.Solomon SG, White AJR, Martin PR. Temporal contrast sensitivity in the lateral geniculate nucleus of a New World monkey, the marmoset Callithrix jacchus. J Physiol (Lond) 1999;517:907–917. doi: 10.1111/j.1469-7793.1999.0907s.x. [DOI] [PMC free article] [PubMed] [Google Scholar]
- 54.Somers DC, Todorov EV, Siapas AG, Toth LJ, Kim DS, Sur M. A local circuit approach to understanding integration of long-range inputs in primary visual cortex. Cereb Cortex. 1998;8:204–217. doi: 10.1093/cercor/8.3.204. [DOI] [PubMed] [Google Scholar]
- 55.Troilo D, Howland HC, Judge SJ. Visual optics and retinal cone topography in the common marmoset (Callithrix jacchus). Vision Res. 1993;33:1301–1310. doi: 10.1016/0042-6989(93)90038-x. [DOI] [PubMed] [Google Scholar]
- 56.Usrey WM, Reid RC. Visual physiology of the lateral geniculate nucleus in two species of New World monkey: Saimiri sciureus and Aotus trivirgatis. J Physiol (Lond) 2000;523:755–769. doi: 10.1111/j.1469-7793.2000.00755.x. [DOI] [PMC free article] [PubMed] [Google Scholar]
- 57.Vidyasagar TR. Contribution of inhibitory mechanisms to the orientation sensitivity of cat dLGN neurones. Exp Brain Res. 1984;55:192–195. doi: 10.1007/BF00240517. [DOI] [PubMed] [Google Scholar]
- 58.White AJR, Solomon SG, Martin PR. Spatial properties of receptive fields in the lateral geniculate nucleus of the marmoset Callithrix jacchus. J Physiol (Lond) 2001;533:519–535. doi: 10.1111/j.1469-7793.2001.0519a.x. [DOI] [PMC free article] [PubMed] [Google Scholar]
- 59.White AJR, Goodchild AK, Wilder HD, Sefton AE, Martin PR. Segregation of receptive field properties in the lateral geniculate nucleus of the common marmoset Callithrix jacchus. J Neurophysiol. 1998;80:2063–2076. doi: 10.1152/jn.1998.80.4.2063. [DOI] [PubMed] [Google Scholar]
- 60.Xu X-M, Ichada J, Allison JD, Bonds AB, Casagrande VA. A comparison of koniocellular, magnocellular and parvocellular receptive field properties in the lateral geniculate nucleus of the owl monkey (Aotus trivirgatus). J Physiol (Lond) 2001;531:203–218. doi: 10.1111/j.1469-7793.2001.0203j.x. [DOI] [PMC free article] [PubMed] [Google Scholar]
- 61.Yeh T, Lee BB, Kremers J, Cowing JA, Hunt DM, Martin PR, Troy JB. Visual responses in the lateral geniculate nucleus of dichromatic and trichromatic marmosets (Callithrix jacchus). J Neurosci. 1995;15:7892–7904. doi: 10.1523/JNEUROSCI.15-12-07892.1995. [DOI] [PMC free article] [PubMed] [Google Scholar]