

Abstract
Depolarization-induced suppression of inhibition (DSI) is a form of short-term plasticity of GABAergic synaptic transmission that is found in cerebellar Purkinje cells and hippocampal CA1 pyramidal cells. DSI involves the release of a calcium-dependent retrograde messenger by the somatodendritic compartment of the postsynaptic cell. Both glutamate and endogenous cannabinoids have been proposed as retrograde messenger.
Here we show that, in cerebellar parasagittal slices, type 1 cannabinoid receptors (CB1Rs) are expressed at high levels in axons of GABAergic interneurons and in presynaptic terminals onto Purkinje cells. Application of the cannabinoid antagonist AM-251 (500 nm) leads to the abolition of the DSI of evoked currents (eIPSCs) recorded in paired recordings and to a strong reduction of the DSI of TTX-insensitive miniature events (mIPSCs) recorded from Purkinje cells. Furthermore, the CB1R agonist WIN 55–212,2 (5 μm) induces a presynaptic inhibition of synaptic currents similar to that occurring during DSI, as well as an occlusion of DSI after stimulation of Purkinje cells. Moreover, WIN 55–212,2 reduces the calcium transients evoked in presumed presynaptic varicosities by short trains of action potentials.
Our results indicate that DSI is mediated by the activation of presynaptic CB1Rs and that an endogenous cannabinoid is a likely candidate retrograde messenger in this preparation. They further suggest that DSI involves distinct presynaptic modifications for eIPSCs and mIPSCs, including an inhibition of action potential-evoked calcium rises.
Keywords: depolarization-induced suppression of inhibition, endogenous cannabinoids, CB1 receptors, retrograde messengers, synaptic transmission, synaptic plasticity, cerebellum, interneurons
The classical concept of interneuronal communication holds that information flows from the axon terminals of a presynaptic neuron to the soma and/or dendrites of its postsynaptic partner. There are however exceptions to this rule: specialized somatodendritic structures are known to release neurotransmitters at dendrodendritic synapses, for example in the thalamus (Sherman and Guillery, 2001) or in the olfactory bulb (Shepherd, 1998). In an apparently less organized manner, many central neurons are capable of releasing neurotransmitter-like substances from the somatodendritic compartment. These substances, including dopamine (Cheramy et al., 1981; Jaffe et al., 1998), dynorphin (Drake et al., 1994), GABA (Zilberter et al., 1999), glutamate (Zilberter, 2000), oxytocin, and vasopressin (Kombian et al., 1997) can modulate neurotransmitter release from afferent presynaptic terminals, and are then called retrograde messengers.
Retrograde signaling has been well documented for depolarization-induced suppression of inhibition (DSI), a form of short-term plasticity of GABAergic synapses onto cerebellar Purkinje cells (Llano et al., 1991; Vincent et al., 1992) and hippocampal CA1 pyramidal cells (Pitler and Alger, 1992, 1994). DSI is induced by a postsynaptic rise in calcium concentration (Pitler and Alger, 1992;Glitsch et al., 2000; Wilson and Nicoll, 2001; Wang and Zucker, 2001) that follows a depolarization of the principal cells and consists in an inhibition of GABAergic transmission lasting a few tens of seconds. Because DSI involves presynaptic modifications of transmitter release, it must imply the release of one or several retrograde messengers (Llano et al., 1991; Pitler and Alger, 1994). Earlier reports suggested that postsynaptically released glutamate could play this role by activating presynaptic metabotropic glutamate receptors of group II (Glitsch et al., 1996) or of group I (Morishita et al., 1998). This hypothesis has been recently challenged by studies suggesting that an endogenous cannabinoid mediates DSI in the hippocampus (Ohno-Shosaku et al., 2001; Wilson and Nicoll, 2001; Wilson et al., 2001). Furthermore, in the cerebellum, two recent studies indicate that a retrograde form of depression of excitatory inputs after Purkinje cell depolarization (either directly or via mGluR1 activation: Kreitzer and Regehr, 2001a;Maejima et al., 2001) involves the release of cannabinoids.
These observations raise the possibility that endogenous cannabinoids could act as retrograde messengers in cerebellar DSI as well. In the mammalian brain, cannabinoids are produced in a calcium-dependent way (Di Marzo et al., 1994; Stella et al., 1997) and act on Gi/o-protein-coupled type 1 cannabinoid receptors (CB1Rs). CB1Rs are expressed at high levels in the brain (Herkenham et al., 1991; Matsuda et al., 1993) and, in particular, they have been localized on presumed GABAergic synaptic terminals near Purkinje cell somata (Tsou et al., 1998; Egertova and Elphick, 2000) and CA1 pyramidal cells (Katona et al., 1999). Their activation leads to a depression of synaptic transmission (Hajos et al., 2000; Hoffman and Lupica, 2000; Takahashi and Linden, 2000) and to a modulation of long-term synaptic plasticity (Stella et al., 1997; Levenes et al., 1998).
Here, we show that presynaptic activation of CB1Rs induces cerebellar DSI, resulting in a reduction of action potential-independent GABA release and of action potential-induced calcium entry.
MATERIALS AND METHODS
Immunohistochemistry. Immunohistochemistry was performed on 11- to 15-d-old rats following a modified procedure from that described in Llano et al. (2000). After anesthesia with Metofane (Janssen-Cilag, Neuss, Germany), rats were decapitated, the cerebellar vermis was extracted and fixed in 4% paraformaldehyde in PBS 0.15m for 1 hr. We then cut 80-μm-thick parasagittal slices in PBS and fixative, and they were left in the same solution for 3 hr. Sections were blocked with BSA (1%) in PBS (blocking buffer) for 1 hr and then incubated in the primary antibody in blocking buffer with Triton X-100 (0.4%) for 24 hr at 4–5°C; incubation solution was then changed, and slices were left in contact with the primary antibody in blocking buffer for 24 more hr at 4–5°C. An affinity-purified primary antibody against the CB1R C-terminal (Hajos et al., 2000), whose specificity has been thoroughly tested in the laboratory of origin, was used at 1:500.
Slices were incubated with the secondary antibody in blocking buffer at room temperature for 3 hr. A Cy3-conjugated goat anti-rabbit antibody (Jackson ImmunoResearch, West Grove, PA) was used at 1:100 dilution. Slices were then washed in blocking buffer and in PBS, and eventually mounted on glass slides in Dako (Carpinteria, CA) fluorescent mounting medium.
Controls consisted in incubations with only the secondary antibody. In controls no aspecific signal was detected. Images were acquired with aZeiss (Oberkochen, Germany) LSM 410 confocal microscope (excitation light, 543 nm).
Preparation for electrophysiology. All experiments were done on 11- to 15-d-old Wistar rats. The cerebellum was quickly removed after decapitation. We cut 180-μm-thick parasagittal slices with a Leica (Nussloch, Germany) VT1000S vibratome from the cerebellar vermis. They were left to recover for 1 hr in bicarbonate buffered saline (BBS) at 34°C and then at room temperature for the rest of the experimental day. For recording, slices were perfused with BBS at a rate of 1–1.5 ml/min at room temperature in the recording chamber. Purkinje cells and interneurons were identified using an upright microscope (Axioscop;Zeiss) with differential interference contrast optics, a 63×, 0.9 NA water immersion objective, and a 0.63 NA condenser.
BBS contained (in mm): NaCl 125, KCl 2.5, CaCl2 2, MgCl2 1, NaH2PO4 1.25, and NaHCO3 26, glucose 10, pH 7.4, equilibrated by continuously bubbling with 95% O2 and 5% CO2 (all of these chemicals were from Sigma-Aldrich, Taufkirchen, Germany).
NBQX and APV (10 and 50 μm, respectively; both from Tocris Cookson, Bristol, UK) were always present in the bath. AM-251 and WIN 55–212,2 (Tocris Cookson) were dissolved in DMSO (Sigma-Aldrich) at 5000 times their final concentration (respectively 500 nm and 5 μm) and then stored at 4–5°C. They were directly added to the perfusion BBS solution just before use. After each application, set-up solution lines were carefully rinsed with ethanol. Control periods either included the carrier DMSO in the bath BBS or did not, without any noticeable influence on the outcome. LY 341495 (Tocris Cookson) aliquots (10 μm) in NaOH were stored at −20°C and dissolved directly into the bath BBS at the final concentration (5 μm).
Electrophysiology. Recording pipettes were pulled from borosilicate glass capillaries (Purkinje cells: 2–2.8 MΩ in chloride-based internal solution, 3.5–4.5 MΩ in gluconate-based solution; interneurons: 8–11 MΩ for paired recordings; 4–6 MΩ for calcium imaging).
Experiments were performed with a Heka double EPC-9 amplifier (Heka Elektronik, Darmstadt, Germany).
For recording of miniature IPSCs (mIPSCs), TTX (500 nm) was present in the bath. A chloride-based internal solution was used to record in voltage-clamp from Purkinje cells, as follows (in mm): CsCl 150, MgCl2 4.6, CaCl2 0.1, HEPES 10, EGTA 1, Na-ATP 4, and Na-GTP 0.4. The holding potential was kept at −70 mV, giving rise to inward GABAergic currents.
In paired recordings, evoked IPSCs (eIPSCs) were obtained from Purkinje cells using standard whole-cell recording with an internal solution containing (in mm): CsGluconate 150, MgCl2 4.6, CaCl2 0.1, HEPES 10, EGTA 1, Na-ATP 4, and Na-GTP 0.4. We used the perforated-patch configuration for interneurons: amphotericin B aliquoted in DMSO was dissolved (300 μg/ml) into an internal solution containing in mm: KGluconate 135, MgCl2 4.6, CaCl2 0.1, HEPES 10, EGTA 1, Na-ATP 4, and Na-GTP 0.4. Pipette tips for interneurons were back-filled with the solution including amphotericin B: the access conductance was usually sufficient to induce presynaptic unclamped action potentials within 5 min from sealing. Access into interneurons continuously improved during the experiment until final values normally in the range between 20 and 40 MΩ (not compensated). Unclamped action potentials were induced by short (3–5 msec) depolarizations to 0 or +20 mV from a holding potential of −70 or −80 mV. Interneurons were stimulated at 0.2 Hz.
Analysis of DSI. DSI was induced by depolarizing Purkinje cells to 0 mV for 1 sec. For evoked currents, pre-DSI and post-DSI periods (total duration: 90 sec each) included 18 eIPSCs each. Usually 2–3 sec were interleaved between the end of Purkinje cell depolarization and the first post-DSI eIPSC. Control and test periods consisted of several DSI trials (four or five), respectively, before and during the application of the pharmacological agents used. For each trial, eIPSC amplitudes were normalized with respect to the average amplitude of pre-depolarization eIPSCs. Control and test time courses for an experiment were obtained by pooling together these single normalized control and test DSIs. The extent of this form of DSI (called DSIeIPSC) was calculated as the percentage reduction in peak amplitude for the average first three eIPSCs after the DSI pulse compared with the average pre-DSI amplitude.
DSI of mIPCSs (DSImIPSC) was similarly analyzed. mIPSCs were continuously recorded during pre- and post-DSI periods of 1 min each. Individual mIPSCs were detected by analyzing the first and second derivatives of previously smoothed current traces. Miniature peaks corresponded to points of null first derivative and of positive second derivative. The amplitude of each event was given by the difference between the peak amplitude and the amplitude of the point where the first derivative of the smoothed trace altered its sign, as found by running backwards on the trace starting at the peak. Because of the large difference between the mIPSC rise time (20–80% rise time; 1–2 msec) and decay time (on the order of 10–15 msec), our detecting methods leads to a reliable detection of overlapping events and to a negligible error in the measure of corresponding event amplitudes. Visual inspection of the entire traces was always performed to ensure that the parameters of the detection routine were optimally set for each experiment and to verify that the analysis program did not produce significant errors.
Time was then divided into bins (duration, 2–6 sec), and the event amplitudes falling into each bin were summed up to give the time course of cumulative amplitudes. After normalization with respect to the average pre-DSI cumulative amplitude, four or five control and test DSIs were separately pooled together. DSImIPSCwas calculated as the reduction in the average cumulative amplitude over a period from 2.5 to 12.5 sec after Purkinje cell depolarization with respect to the pre-DSI control cumulative amplitude.
Fluorometric calcium imaging. Action potential-dependent calcium transients were recorded in cerebellar interneuron axons as described previously (Forti et al., 2000). Briefly, interneurons were recorded under voltage clamp with an internal solution based on Kgluconate and including Oregon Green 488 BAPTA-1 (OG1; 250 μm). Images were taken using an excitation-acquisition system from T.I.L.L. Photonics (Planegg, Germany) including a scanning monochromator and a Peltier-cooled PCO SensiCam camera.
After allowing 8–12 min from break-in to let the dye diffuse into the cell, a few images were taken with a short exposure time (20–30 msec) to study the morphology of the recorded cell and find an axonal area showing recognizable varicosities. During recording, series of 24 images with an exposure time of 50 msec each were taken every 3–5 min to monitor calcium transients. In each series, four depolarizing steps to 0 mV (interstimulus intervals: 20 msec) were applied to the cell simultaneously with the sixth image to induce unclamped action potentials in the axon. Calcium transients decreased with time in whole-cell recording. In control experiments (n = 6), signals showed a biphasic run-down, with a faster component in the first 30 min followed by a much slower decrease. Qualitatively and quantitatively the run-down and the signs of cellular photodamage were as described earlier (Forti et al., 2000).
For analysis, four background regions and 6–10 regions of interest (ROIs) located on axonal structures were chosen. The mean background was subtracted from the fluorescence of each pixel i, and the percentage change in calcium at image n was computed as ΔFi(n)/Fi0= 100(Fi(n) −Fi0)/Fi0,where Fi0 andFi(n) are, respectively, the background-subtracted average resting fluorescence and the background-subtracted fluorescence at image n. ROI values were averaged to obtain an estimate of the increase in fluorescence in the axon for each image.
WIN 55,212–2 was applied after four control sequences of images, at times ranging from 25 to 43 min after break-in. To pool together the experiments, time was divided into 5 min bins with the moment of WIN application marked as t = 0. Values from each experiment falling in a corresponding bin were then averaged, and bin values were normalized with respect to the preapplication period. The points in WIN55,212–2 were corrected for rundown by using a linear extrapolation of the control (t < 0).
Results are given as means ± SEM. Statistical comparisons were made with the Wilcoxon ranked paired test and the Mann–WhitneyU test. Statistical significance was set at 0.05.
RESULTS
Staining of excitatory and inhibitory synapses with an antibody against CB1Rs
Previous reports have shown a high level of expression of CB1Rs in the cerebellum (Tsou et al., 1998; Egertova and Elpick, 2000). Nonetheless, two main considerations have prompted us to reinvestigate the presence and precise localization of CB1Rs in our system. First, we worked with younger animals (11- to 15-d-old rats) than in the previous studies (adult rats); synaptic structures and protein expression are known to differ between these two age groups. Second, although a strong CB1R expression level was detected in basket cell pinceaux and, more moderately, on basket cell terminal-like areas around Purkinje cell bodies, no clear demonstration was previously given of the presence of receptors in basket–stellate cell axons and synaptic terminals in the molecular layer.
The pattern of expression that has been obtained is illustrated in Figure 1. There is a strong, widespread punctate staining in the molecular layer (Fig.1A–D). This probably corresponds to parallel fibers running perpendicularly to the slice plane and is fully consistent with previous morphological (Tsou et al., 1998; Egertova and Elphick, 2000) and physiological (Levenes et al., 1998; Takahashi and Linden, 2000) data. No signal could be detected from Purkinje cell somata or dendrites (Fig. 1A–D) or in the smaller linear fibers belonging to Bergmann glial cells, which run centrifugally to the slice outer limit from the Purkinje cell layer (Fig.1A,B). The signal abruptly ends at the border between molecular layer and external germinal layer. Sometimes a faint mesh of fibers surrounding granule cell bodies could be detected in the granule cell layer.
Fig. 1.
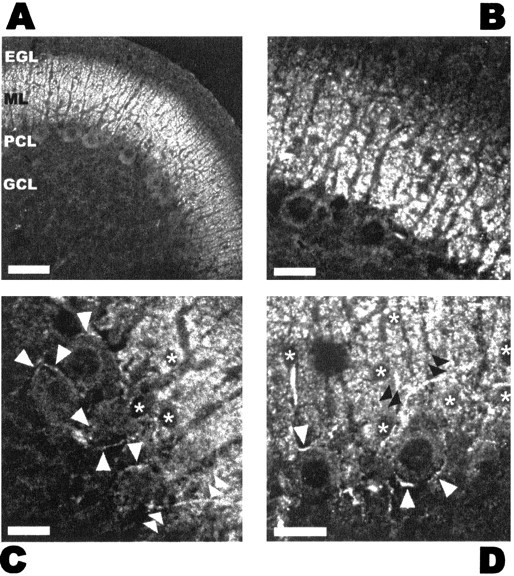
CB1R localization in the cerebellum of young rats.A–D, Immunohistochemical detection of CB1Rs in the cerebellum of a 12-d-old rat, using an antibody raised against the C-terminal portion of the protein. Maximal expression can be seen in the ML. A, B, Purkinje cell somata (large cell bodies with big dark nucleus in the PCL), dendrites, and Bergmann glia fibers appear unstained. The strong punctate signal likely comes from parallel fibers, which run perpendicular to the plane of the slice. The EGL, which is still present at this developmental stage, is devoid of protein, probably because of absence of parallel fibers and GABAergic fibers. A series of small, unstained somata can be seen in the bottom part of the ML, presumably basket cell bodies.C, D, At high magnification near the PCL, punctate staining of the ML is clearly visible together with unstained cell somata (asterisks) corresponding to basket–stellate cells and/or migrating granule cells. White arrowheads indicate the fluorescence surrounding Purkinje cell soma, which is presumably attributable to basket cell synaptic terminals. Intensely stained basket–stellate cell axons contacting Purkinje cell somata are indicated by white(C) and black(D) double arrowheads. Scale bars:A, 50 μm; B–D, 20 μm.EGL, External germinal layer; ML,molecular layer; PCL, Purkinje cell layer;GCL, granule cell layer.
In Figure 1B and at higher magnification inC and D (asterisks), cell bodies are not stained; more generally, no cell soma was ever revealed by the antibody in the molecular layer, suggesting that migrating granule cells, glial cells, and, most importantly, GABAergic interneuron somata do not express CB1Rs. On the other hand, a strong signal was detected around Purkinje cell somata in structures resembling basket cell synaptic terminals (Fig. 1C,D, white arrowheads). Furthermore, and most importantly for our goals, fibers running longitudinally (Fig. 1D, black double arrowheads) and giving out branches surrounding Purkinje cell somata were stained (Fig.1C, white double arrowheads): these structures have all the morphological properties of GABAergic axons synapsing onto Purkinje cells. Sometimes, fibers running along Purkinje cell primary dendrites and extending in the granular layer were visible, likely corresponding to climbing fibers (data not shown).
These data indicate that, in young animals, CB1Rs are present in axons and synaptic terminals of cerebellar basket and stellate cells, as well as in parallel and climbing fibers.
Implication of CB1Rs in DSI: paired recording experiments
DSI at cerebellar synapses has been reported as a transient inhibition of both evoked (action potential-dependent) and miniature (action potential-independent) IPSCs (Llano et al., 1991). Although the basic features of these two branches of DSI are similar, there are differences in detail suggesting distinct mechanisms (Vincent and Marty, 1993). Studying the first component of DSI in isolation requires simultaneous recordings of a presynaptic interneuron and of a functionally connected Purkinje cell (“paired recording”). This has been difficult in the cerebellum because of the rundown that occurs at interneuron–Purkinje cell synapses because of presynaptic dialysis (Vincent and Marty, 1996). However, we found recently that this rundown can be prevented by using presynaptic perforated-patch recording, thus allowing a quantitative description of DSI of action potential-dependent IPSCs (M. Diana and A. Marty, unpublished observations). DSI is manifest in paired recordings as a strong reduction in the mean size of evoked IPSCs (eIPSCs), without any significant change in kinetics or in the presynaptic trace (Fig.2Aa, top panel). Such an effect can be obtained repeatedly without any decrement (see time plots in Fig. 2Ab,Bb).
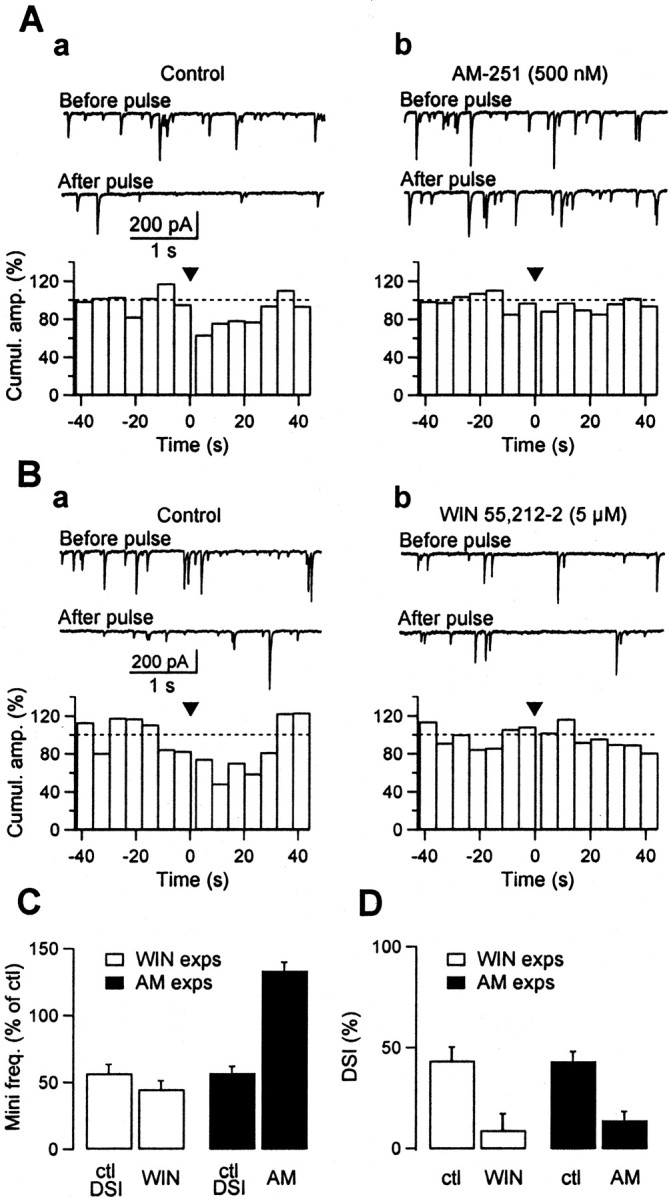
Fig. 2.

In paired recordings DSI is occluded by the CB1R agonist WIN 55,212–2 and completely prevented by the CB1R antagonist AM-251. Paired recordings were performed between presynaptic stellate–basket cells and postsynaptic Purkinje cells. The presynaptic cell was recorded using perforated patch. DSI was assayed by depolarizing Purkinje cells to 0 mV for 1 sec at 3–4 min intervals. eIPSCs were elicited every 5 sec. A, Effect of WIN 55,212–2. Aa, Presynaptic and postsynaptic current sweeps averaged from one DSI trial, before (from 18 eIPSCs;black trace), and after (first three post-depolarization IPSCs; gray trace) the depolarizing pulse.Top, In control saline, the presynaptic current is not altered by the DSI-inducing protocol, whereas the postsynaptic current is strongly decreased (average control DSI: 86.9 ± 2.6%;n = 6 DSI trials). Bottom, In the presence of 5 μm WIN 55,212–2, the postsynaptic current is markedly reduced (note 10-fold change in vertical scale). In addition, the gray and black postsynaptic traces are now superimposed, indicating an abolition of DSI (average DSI in WIN 55,212–2: 15.1 ± 8.5%; n = 4 trials). Ab, Peak amplitude of individual eIPSCs plotted over time, same experiment as in Aa.t = 0 min corresponds to Purkinje cell break-in.Open circles correspond to control eIPSCs, andclosed circles to eIPSCs measured 0–90 sec after the DSI protocol. Inset, Averaged paired pulse currents elicited by 50 msec interpulse interval stimulations. Currents in control saline (average of 77 traces; black trace) and in WIN 55–212,2 (average of 55 traces; gray trace) have been normalized with respect to the first paired evoked current in the control trace. In this experiment the paired pulse ratio increases from 113% in the control to 182% in WIN 55–212,2, calculated as the ratio between the amplitude of the averaged second eIPSC and the amplitude of the averaged first eIPSC. B, Effect of AM-251.Ba, In another experiment, the initial amount of DSI observed in the control was 89.9 ± 2.6% (n = 9 DSI trials). Perfusion of 500 nm AM-251 slightly increased the amplitude of eIPSCs and markedly reduced DSI (to 15.2 ± 5.0%; n = 10 trials,bottom). In this experiment no leak subtraction was applied to the presynaptic traces, in contrast to A.Bb, Time plot of the effects of AM-251 for the same experiment. C, Histograms summarizing five experiments where the pharmacological test was with WIN 55–212,2 (white bars) and six experiments with AM-251 (black bars); values are normalized relatively to the amplitude of eIPSC observed in control saline. “ctl DSI” bars are the mean eIPSC amplitudes during DSI in control saline. WIN andAM bars are the mean eIPSC amplitudes, respectively in the presence of WIN55,212–2 and AM-251. Note that WIN 55–212,2 and the DSI protocol reduce the eIPSCs to about the same level, whereas AM-251 does not modify the amplitude of eIPSC. D, Same experiments as in C. Comparison of the amount of DSI observed in control conditions (control), and in the presence of either WIN 55–212,2 (WIN) or AM-251 (AM). Notice the complete abolition of DSI in AM-251.
Having set these recording conditions, we tested agents interfering with CB1R activity to investigate their effects on the DSI of evoked transmission.
Within minutes of perfusion with the cannabinoid agonist WIN 55,212–2, the mean eIPSC amplitude was strongly reduced (to 10.3 ± 2.1% of the control; n = 5) (Fig. 2Ab). In the presence of WIN 55–212,2, the paired-pulse ratio at 50 msec interpulse interval was significantly increased (from 101.9 ± 7.1% in the control to 143.4 ± 10.8%; p < 0.05; n = 5) (Fig. 2Ab, inset, traces), and the inverse of the square of the coefficient of variation (CV−2) was very markedly decreased (from 21.5 ± 9.3 in the control to 0.96 ± 0.25;p < 0.05); both results suggest a presynaptic locus for the inhibition. In WIN 55–212,2, the DSI protocol became ineffective (Fig. 2Aa, bottom panel). On average, the mean DSI value fell from 88.8 ± 3.7% in the control to 19.9 ± 7.8% (Fig. 2D, open bars). As shown in the summary plot of Figure 2C (open bars), the amplitudes of eIPSCs observed after a DSI protocol in control saline and before the DSI protocol in the presence of WIN 55–212,2 were not significantly different. This suggests that the abolition of DSI seen in WIN 55–212,2 is because of an occlusion effect and that WIN 55–212,2 and DSI share a common pathway, although not necessarily implying that DSI involves CB1R activation.
Figure 2B presents the results of the converse experiment, which consisted of exposing the slice to the CB1R antagonist AM-251. In control runs without DSI protocols, AM-251 had variable consequences on the amplitude of eIPSCs, but no net effect was apparent when averaging across experiments (mean ratio in AM-251 to control values, 99.5 ± 33.0%; n = 5). AM-251 also failed to alter significantly the value of CV−2 (mean ratio in AM-251 to control values, 115.1 ± 24.6%; n = 5). Thus, contrary to WIN 55–212,2, AM-251 does not modify the basal synaptic transmission. However, AM-251 dramatically reduced DSI (control: 81.6 ± 3.5%; in AM-251: 1.1 ± 3.6%; n = 5; p< 0.05) (Fig. 2C,D, filled bars), strongly suggesting that CB1Rs are involved in the establishment of DSI.
Effect of CB1R activation and inhibition on mIPSCs
We next asked whether CB1R agonists and antagonists would also act on mIPSCs. As reported earlier (Takahashi and Linden, 2000), WIN 55–212,2 strongly inhibited the frequency of mIPSCs. This effect developed over a period of 10–15 min after addition of WIN 55–212,2, at which point in time the reduction amounted to 55.6 ± 6.7% of the control (Fig. 3C) (p < 0.05; n = 10), and it remained stable thereafter. At the same time period, WIN 55–212,2 failed to affect the mIPSC mean amplitude (mean ratio to control: 90.0 ± 10.7%, n = 10; data not shown). These results suggest that activation of CB1Rs results in a decrease of the release probability of presynaptic vesicles.
Fig. 3.
Effects of WIN 55,212–2 and of AM-251 on DSI of mIPSCs. Here DSI of mIPSCs was measured in TTX after a 1-sec-long Purkinje cell depolarization. Sweeps are examples of currents recorded in Purkinje cells. A, Effects of AM-251.Aa, In control saline, the depolarizing pulse resulted in an inhibition of mIPSC frequency. Histogram: Averaged response to four DSI trials. DSI was measured as the percentage decrease in cumulative amplitude over a period of 2.5–12.5 sec after the depolarizing pulse. Ab, In the presence of 500 nm AM-251, DSI is markedly reduced (average histogram for three trials). B, Effects of WIN 55,212–2.Ba, DSI in control saline. Bb, After perfusion with 5 μm WIN 55,212–2, mIPSC frequency was markedly reduced, and DSI was abolished. C, Summary results from four experiments with WIN 55–212,2 (white bars) and five experiments with AM-251 (black bars). Ordinates indicate frequencies of mIPSCs (calculated over 5 min recordings) normalized with respect to the frequency of mIPSC observed in control saline before DSI. “ctl DSI” bars are the mean mIPSCs frequency during DSI in control saline. WIN andAM bars are the mean mIPSCs frequency, respectively in the presence of WIN55,212–2 and AM-251. D, Same experiments as in C. Comparison of the amount of DSI observed in control conditions (ctl) and in the presence of either WIN 55–212,2 (WIN) or AM-251 (AM).
The effects of the CB1R antagonist AM-251 on mIPSCs were next investigated. On average, no significant effect on mean amplitude was observed. After 10–15 min in AM-251, an increase in the mean frequency was observed (Fig. 3C) (mean ratio to control values before AM-251 application: 1.33 ± 0.06; p < 0.05;n = 11). However the significance of this effect was doubtful, because in many “sham experiments” without changing to AM-251, a spontaneous increase in frequency was observed, so that there was no statistical difference between AM-251 experiments and sham experiments. Thus, the increase observed after AM-251 application could reflect a spontaneous upward trend of mIPSC frequency with time, rather than a genuine effect of AM-251.
Effect of CB1R activation and inhibition on DSI as measured in miniature recording experiments
Because DSI of mIPSCs (DSImIPSC) and DSI of evoked IPSCs (DSIeIPSC) have different properties (for review, see Marty and Llano, 1995), their sensitivity to cannabinoids may be different. Therefore, the effects of WIN 55–212,2 and AM-251 were reexamined in the presence of TTX (500 nm), as illustrated in Figure 3. For these experiments, we used the same depolarizing pulse protocol as before (1-sec-long depolarizations to 0 mV, applied every 3–4 min). Figure 3A illustrates an experiment where AM-251 reduced DSI from 40.1 down to 9.8%, and Figure3B shows another experiment with a DSI value of 31.8% in the control, which decreased in the presence of WIN 55–212,2 to −9.8%. Average results indicate that both compounds significantly reduce DSImIPSC to approximately the same level (Fig. 3D) (AM-251 reduces DSI values from 43.1 ± 4.8 to 14.0 ± 4.4%, n = 5; WIN 55–212,2 reduces DSI values from 43.4 ± 6.8 to 9.1 ± 8.2%, n = 4; p < 0.05 in both cases).
These results show that the activation of CB1Rs is a necessary and sufficient condition for the DSI of both evoked and miniature transmission in the cerebellum. Nevertheless, in contrast to DSIeIPSC, DSImIPSCis still significant in AM-251 (p < 0.05). This residual DSI could be because of some glutamate released from depolarized Purkinje cell, as previously proposed (Glitsch et al., 1996). However, blockade of group II mGluRs did not further decrease the amount of DSI persisting in AM-251. Indeed, a residual DSImIPSC of 20.1 ± 4.7% (n= 4) was still obtained in the presence of a combination of the specific group II mGluR antagonist LY 341495 (5 μm) and of AM-251.
Effect of WIN 55–212,2 on presynaptic calcium transients
In an attempt to elucidate the mechanism of action of cannabinoids, we performed measurements of calcium transients in the axons and presynaptic terminals of interneurons, following procedures developed earlier in our laboratory (Forti et al., 2000). Interneurons were loaded from the soma with OG1. Axons were then imaged during stimulation of the cells with short trains of action potentials applied in the soma (4 spikes at 50 Hz). This resulted in highly localized calcium transients in axonal “hotspots” that include en passant synapses and terminals contacting Purkinje cell somata (Forti et al., 2000). Rundown of the calcium transients was corrected for by linear extrapolation. After application of WIN 55–212,2, the kinetics of the transients remained unchanged, but their amplitude was decreased. Figure 4 illustrates one of these experiments, where the reduction was 34.2 ± 4.6% after 15 min of application of the CB1R agonist. On average, the effects of WIN 55–212,2 appeared as a reduction by 25.2 ± 8.0% (n = 7 experiments; p < 0.05), which was complete 10–15 min after addition of the agonist. These experiments indicate that activation of CB1Rs leads to a reduction of action potential-dependent presynaptic calcium transients.
Fig. 4.

WIN 55,212–2 inhibits presynaptic calcium transients. A, Ca2+ transients observed in the axonal tree of an interneuron loaded with OG-1 (250 μm). Left panel, Image in basal conditions. Right panel, Peak response to a train of four action potentials in control saline. White dotted lines show the position in the slice of two Purkinje cell somata contacted by axonal lateral branches of the recorded cell. The interneuron soma is ∼20 μm above, out of the imaged area.B, Analysis of Ca2+ transients for the same experiment as in A. Traces obtained in control and in the presence of 5 μm WIN55,212–2 are labeled inblack and red, respectively.Top, Somatic action currents recorded during a train of four depolarizations. Bottom, Average ΔF/F0 signals for two different stimulations calculated from the 10 hotspots indicated bywhite arrowheads in A. Thevertical black arrow indicates the time when the four spike stimulus was applied. C, Time course of the effects of WIN 55–212,2 for the same experiment. The points correspond to mean ± SEM of maximal ΔF/F0 changes after stimulation from the 10 hot spots. a andb labels correspond to the data illustrated inB in black and red, respectively. Values were normalized with respect to the four average control ΔF/F0.
In these experiments, we found no evidence of propagation failures in control conditions or after CB1R activation, confirming previous studies (Forti et al., 2000). However this does not rule out the possibility that DSI could involve enhanced propagation failures, as proposed in the hippocampus (Alger et al., 1996). Because we used four action potential stimuli, only massive failures would have been detected with our protocol. Furthermore, the experimental procedure for axon imaging involved dialysis of the intracellular milieu by the recording pipette, and this could have strongly influenced spike initiation and propagation properties.
DISCUSSION
An endocannabinoid as retrograde messenger for cerebellar DSI
The present results indicate that endogenous cannabinoids (endocannabinoids) are likely retrograde messenger candidates at inhibitory synapses onto Purkinje cells. This hypothesis is supported by several arguments, as follows.
First, endocannabinoids and DSI both act on presynaptic targets. We find that CB1R activation increases the paired-pulse ratio in paired recordings and decreases mIPSC frequency without modifying the quantal size, strongly indicating a presynaptic action of endocannabinoids. This conclusion is further supported by our morphological data showing the absence of the receptor from Purkinje cells or Bergmann glia. Likewise, it is clear that the site of expression of cerebellar DSI is presynaptic. This is established both by previous (Llano et al., 1991;Vincent et al., 1992) and by recent evidence: the analysis in paired-recordings of paired-pulse ratio, failure occurrence, and coefficient of variation during DSI points toward a pure presynaptic explanation for DSI (Diana and Marty, unpublished data).
Second, the maximum effects of DSI and of CB1R activation are quantitatively very close. The induction protocol used for this work was chosen to produce maximum DSI (Glitsch et al., 2000); likewise, the WIN 55,212–2 concentration tested (5 μm) is far beyond the saturating dose for CB1Rs. Nevertheless, in both cases, GABAergic transmission is not completely inhibited. The percentage maximum effect is clearly different between TTX-sensitive and insensitive release but in both cases, the amount of residual synaptic transmission is similar for DSI and WIN 55,212–2 inhibition (for eIPSCs: 13.0 ± 2.6% of control in DSI experiments, n = 10 vs 10.7 ± 2.1% of control in the presence of WIN 55,212–2, n = 5; p > 0.05; for mIPSCs: 57.1 ± 3.6% of control in DSI experiments, n = 9 vs 44.4 ± 6.7% of control in the presence of WIN 55,212–2, n = 10,p > 0.05).
The third line of evidence is that blocking CB1Rs with the antagonist AM-251, as well as full activation with a saturating dose of WIN55,212–2, leads to a strong reduction of DSI. This applies both for the modulation of eIPSCs and of mIPSCs. These results confirm that DSI and CB1Rs share the same molecular pathway and indicate that CB1R activation is a necessary and sufficient condition for the expression of DSI.
The new conclusion that endocannabinoids account for DSI in our system is in agreement with their involvement in a similar form of transient inhibition of excitatory synaptic currents onto Purkinje cells called depolarization-induced suppression of excitation (Kreitzer and Regehr, 2001a). After depolarization of Purkinje cells, endocannabinoids apparently inhibit both IPSCs coming from basket and stellate cells and EPSCs originating in parallel fibers and climbing fibers. All of these actions occur with a similar time course and tend to isolate the cell from its synaptic inputs. It remains to be found whether in physiological conditions this cannabinoid-mediated retrograde inhibition can be synapse-specific or whether it is just a mean to scale down the synaptic input of Purkinje cells indiscriminately. In this regard, it must be underlined that the Ca2+ sensitivity of cerebellar DSI has been reported to be extremely high (Glitsch et al., 2000): Ca2+ concentration increases in the order of a few hundreds nanomolar are enough to elicit DSI. Thus, DSI could be used by Purkinje cells to tune synaptic incoming inhibition in an extremely fine way, according to the spatial and temporal profile of the intracellular calcium concentration.
The conclusions drawn from our experiments are also in agreement with recent reports indicating a similar role for cannabinoids in hippocampal DSI (Ohno-Shosaku et al., 2001; Wilson and Nicoll, 2001;Wilson et al., 2001). The question arises, however, of their compatibility with the previous data, which led to the suggestion of a role for glutamate or a related substance in cerebellar DSI (Glitsch et al., 1996). These data included the report of an imitation and occlusion of DSI with 2-(2,3-dicarboxycyclopropyl)-glycine (DCGIV), an agonist of group II mGluRs, and of an inhibition of DSI in the presence of l-AP-3, an antagonist of mGluRs. The former effect could be compatible with the proposal of cannabinoids as messenger if the mGluR and CB1R pathways were converging downstream of the receptor level to produce a DSI-like phenomenon. Occlusion could then be explained on the basis of competition for common steps of the transduction pathway leading to DSI. Concerning the latter effect (inhibition by l-AP-3), we first note that the inhibition was less pronounced than with AM-251: the residual DSImIPSCs observed in l-AP-3 was 59% of its original value compared with 33% in the presence of AM-251 (this paper). Second, it should be stressed that l-AP-3 is a poorly specific drug. In our earlier work, l-AP-3 had to be used at a high concentration (1 mm), and several side effects were found, including a partial agonist action on type II mGluRs (Glitsch et al., 1996). Because the broad action antagonist MCPG failed to inhibit DSI (Glitsch et al., 1996), the relatively weak inhibition exerted by l-AP-3 could in retrospect be explained by the partial agonist effect on mGluRs, which would then lead to an inhibition of DSI through an occlusion effect similar to that observed with DCGIV.
Mechanisms of expression of DSI
CB1R activation has been shown to inhibit GABA release in many different areas of the CNS (for example, rostral ventromedial medulla and periaqueductal gray: Vaughan et al., 1999, 2000; hippocampus:Katona et al., 1999; Hajos et al., 2000; Hoffmann and Lupica, 2000; cerebellum: Takahashi and Linden, 2000; and nucleus accumbens: Manzoni and Bockaert, 2001). TTX-sensitive and TTX-insensitive release are both affected in each case, with the exception of the hippocampus, where only eIPSCs are inhibited. In this preparation, CB1Rs are present only in one subset of interneurons expressing the peptide cholecystokinin (Katona et al., 1999; Tsou et al., 1999); presumably only this subpopulation is affected by DSI (Wilson et al., 2001). If only minis coming from these synapses were modulated by CB1R activation, the effect could be statistically lost in recording miniature events originating from the whole population of interneurons, thus explaining why DSI is not apparent for TTX-insensitive transmission in CA1 pyramidal cells (Pitler and Alger, 1994). In our paired-recording experiments, all of the presynaptic interneurons that were tested responded to CB1R modulators, be it with a reduction in evoked transmission by WIN 55,212–2 application (n = 5), or with a significant block of DSI in response to AM-251 (n = 6); so, cerebellar stellate and basket cells appear to express CB1Rs uniformly.
The present experiments confirm that DSI and CB1Rs inhibit both TTX-insensitive and TTX-sensitive IPSCs, yet they reinforce the view that the underlying mechanisms are distinct, as suggested earlier (Vincent and Marty, 1993). Namely, we have found that CB1R activation depresses evoked currents at least partially through the inhibition of action-potential induced calcium transients (Fig. 4), whereas mIPSCs are independent from calcium influx (Llano et al., 2000). Therefore, evoked transmission is modulated by a mechanism that does not operate on mIPSCs. However, the possibility remains that the release probability change apparent in DSImIPSC could also operate, in parallel with another process, to inhibit IPSCs during DSIeIPSC. In agreement with this hypothesis, our results show that both maximum DSI and maximum WIN 55,212–2 effects are significantly stronger for eIPSCs (80.2 ± 2.9 and 85.8 ± 2.4% inhibition, respectively) than for mIPSCs (43.9 ± 3.6 and 55.6 ± 6.7%, respectively; p < 0.05). In this context, we cannot exclude the presence of GABAergic synapses onto Purkinje cells originating from other cell types than interneurons, in particular from other Purkinje cells (Altman and Bayer, 1997), which could have distinct pharmacological properties and susceptibility to DSI.
Action potential-induced calcium transients (Forti et al., 2000) and synaptic transmission between basket–stellate cells and Purkinje cells (Llano et al., 2000; Stephens et al., 2001) are mainly mediated by P/Q-type calcium channels. Because cannabinoids inhibit these conductances (as well as N-type ones) both in cultured hippocampal neurons and in expression systems (Mackie et al., 1995; Twitchell et al., 1997; Sullivan, 1999), a direct modulation of presynaptic P/Q-type channels could explain part of the depression of evoked synaptic transmission during cerebellar DSI. Consistently with an involvement of voltage-dependent calcium conductances in this phenomenon, selective N-type calcium channel inhibition has been proposed as a mechanism of expression for DSI in the hippocampus (Wilson et al., 2001).
On the other hand, axonal potassium channels cannot be excluded as possible mediators of DSI. Indeed, CB1R-induced regulation of voltage-dependent (as in Hampson et al., 1995) and/or of inwardly rectifying potassium conductances (Mackie et al., 1995; Henry and Chavkin, 1995) could regulate the firing threshold, the reliability of action-potential propagation along the axon, and the shape of action potentials invading synaptic terminals.
In conclusion, the concomitant activation of several pathways is most likely responsible for the powerful inhibition of GABAergic transmission by CB1Rs and by DSI. Many points about how endocannabinoids are synthesized, are released, and act are still unresolved. The ubiquity of CB1Rs in the CNS and the new light shed on their function nonetheless point out the cannabinoid pathway as a key player in the regulation of synaptic communication.
Note added in proof. While this paper was under review, another group reported results that also indicate that endocannabinoids are responsible for cerebellar DSI (Kreitzer and Regehr, 2001b).
Footnotes
M.A.D. was supported by the European Community (Grant ERBFMRXCT980236) and by the Boehringer Ingelsheim Foundation. We acknowledge the support of the Max Planck Society: this project started in the Department of Cellular Neurobiology of the Max Planck Institute for Biophysical Chemistry (Goettingen, Germany). We thank Dr. Isabel Llano for her help with the calcium imaging experiments, Dr. Christophe Pouzat and Dr. Yusuf Tan for sharing part of the analysis software, and Sigrid Schmidt for help with the immunohistochemistry.
Correspondence should be addressed to Dr. Alain Marty, Laboratoire de Physiologie Cérébrale, Université Paris-5, 45 rue des Saints Pères, 75006 Paris, France. E-mail:alain.marty@biomedicale.univ-paris5.fr.
REFERENCES
- 1.Alger BE, Pitler TA, Wagner JJ, Martin LA, Morishita W, Kirov SA, Lenz RA. Retrograde signalling in depolarization-induced suppression of inhibition in rat hippocampal CA1 cells. J Physiol (Lond) 1996;496:197–209. doi: 10.1113/jphysiol.1996.sp021677. [DOI] [PMC free article] [PubMed] [Google Scholar]
- 2.Altman J, Bayer SA. Development of the cerebellar system: in relation to its evolution, structure, and functions. CRC; Boca Raton, FL: 1997. [Google Scholar]
- 3.Cheramy A, Leviel V, Glowinski J. Dendritic release of dopamine in the substantia nigra. Nature. 1981;289:537–542. doi: 10.1038/289537a0. [DOI] [PubMed] [Google Scholar]
- 4.Di Marzo V, Fontana A, Cadas H, Schinelli S, Cimino G, Schwartz JC, Piomelli D. Formation and inactivation of endogenous cannabinoid anandamide in central neurons. Nature. 1994;372:686–691. doi: 10.1038/372686a0. [DOI] [PubMed] [Google Scholar]
- 5.Drake CT, Terman GW, Simmons ML, Milner TA, Kunkel DD, Schwartzkroin PA, Chavkin C. Dynorphin opioids present in dentate granule cells may function as retrograde inhibitory neurotransmitters. J Neurosci. 1994;14:3736–3750. doi: 10.1523/JNEUROSCI.14-06-03736.1994. [DOI] [PMC free article] [PubMed] [Google Scholar]
- 6.Egertova M, Elphick MR. Localization of cannabinoid receptors in the rat brain using antibodies to the intracellular C-terminal tail of CB1. J Comp Neurol. 2000;422:159–171. doi: 10.1002/(sici)1096-9861(20000626)422:2<159::aid-cne1>3.0.co;2-1. [DOI] [PubMed] [Google Scholar]
- 7.Forti L, Pouzat C, Llano I. Action potential-evoked Ca2+ signals and calcium channels in axons of developing rat cerebellar interneurones. J Physiol (Lond) 2000;527:33–48. doi: 10.1111/j.1469-7793.2000.00033.x. [DOI] [PMC free article] [PubMed] [Google Scholar]
- 8.Glitsch M, Llano I, Marty A. Glutamate as a candidate retrograde messenger at interneurone-Purkinje cell synapses of rat cerebellum. J Physiol (Lond) 1996;497:531–537. doi: 10.1113/jphysiol.1996.sp021786. [DOI] [PMC free article] [PubMed] [Google Scholar]
- 9.Glitsch M, Parra P, Llano I. The retrograde inhibition of IPSCs in rat cerebellar Purkinje cells is highly sensitive to intracellular Ca2+. Eur J Neurosci. 2000;12:987–993. doi: 10.1046/j.1460-9568.2000.00994.x. [DOI] [PubMed] [Google Scholar]
- 10.Hajos N, Katona I, Naiem SS, MacKie K, Ledent C, Mody I, Freund TF. Cannabinoids inhibit hippocampal GABAergic transmission and network oscillations. Eur J Neurosci. 2000;12:3239–3249. doi: 10.1046/j.1460-9568.2000.00217.x. [DOI] [PubMed] [Google Scholar]
- 11.Hampson RE, Evans GJ, Mu J, Zhuang SY, King VC, Childers SR, Deadwyler SA. Role of cyclic AMP dependent protein kinase in cannabinoid receptor modulation of potassium “A-current” in cultured rat hippocampal neurons. Life Sci. 1995;56:2081–2088. doi: 10.1016/0024-3205(95)00192-9. [DOI] [PubMed] [Google Scholar]
- 12.Henry DJ, Chavkin C. Activation of inwardly rectifying potassium channels (GIRK1) by co-expressed rat brain cannabinoid receptors in Xenopus oocytes. Neurosci Lett. 1995;186:91–94. doi: 10.1016/0304-3940(95)11289-9. [DOI] [PubMed] [Google Scholar]
- 13.Herkenham M, Lynn AB, Johnson MR, Melvin LS, de Costa BR, Rice KC. Characterization and localization of cannabinoid receptors in rat brain: a quantitative in vitro autoradiographic study. J Neurosci. 1991;11:563–583. doi: 10.1523/JNEUROSCI.11-02-00563.1991. [DOI] [PMC free article] [PubMed] [Google Scholar]
- 14.Hoffman AF, Lupica CR. Mechanisms of cannabinoid inhibition of GABAa synaptic transmission in the hippocampus. J Neurosci. 2000;20:2470–2479. doi: 10.1523/JNEUROSCI.20-07-02470.2000. [DOI] [PMC free article] [PubMed] [Google Scholar]
- 15.Jaffe EH, Marty A, Schulte A, Chow RH. Extrasynaptic vesicular transmitter release from the somata of substantia nigra neurons in rat midbrain slices. J Neurosci. 1998;18:3548–3553. doi: 10.1523/JNEUROSCI.18-10-03548.1998. [DOI] [PMC free article] [PubMed] [Google Scholar]
- 16.Katona I, Sperlagh B, Sik A, Kafalvi A, Vizi ES, Mackie K, Freund TF. Presynaptically located CB1 cannabinoid receptors regulate GABA release from axon terminals of specific hippocampal interneurons. J Neurosci. 1999;19:4544–4558. doi: 10.1523/JNEUROSCI.19-11-04544.1999. [DOI] [PMC free article] [PubMed] [Google Scholar]
- 17.Kombian SB, Mouginot D, Pittman QJ. Dendritically released peptides act as retrograde modulators of afferent excitation in the supraoptic nucleus in vitro. Neuron. 1997;19:903–912. doi: 10.1016/s0896-6273(00)80971-x. [DOI] [PubMed] [Google Scholar]
- 18.Kreitzer AC, Regehr WG. Retrograde inhibition of presynaptic calcium influx by endogenous cannabinoids at excitatory synapses onto Purkinje cells. Neuron. 2001a;29:717–727. doi: 10.1016/s0896-6273(01)00246-x. [DOI] [PubMed] [Google Scholar]
- 19. Kreitzer AC, Regehr WG. Cerebellar depolarization-induced suppression of inhibition if mediated by endogenous cannabinoids. J Neurosci 21 2001b. RC174(1–5). [DOI] [PMC free article] [PubMed] [Google Scholar]
- 20.Levenes C, Daniel H, Soubrie P, Crepel F. Cannabinoids decrease excitatory synaptic transmission and impair long-term depression in rat cerebellar Purkinje cells. J Physiol (Lond) 1998;510:867–879. doi: 10.1111/j.1469-7793.1998.867bj.x. [DOI] [PMC free article] [PubMed] [Google Scholar]
- 21.Llano I, Leresche N, Marty A. Calcium entry increases the sensitivity of cerebellar Purkinje cells to applied GABA and decreases inhibitory synaptic currents. Neuron. 1991;6:565–574. doi: 10.1016/0896-6273(91)90059-9. [DOI] [PubMed] [Google Scholar]
- 22.Llano I, Gonzalez J, Caputo C, Lai FA, Blayney LM, Tan YP, Marty A. Presynaptic calcium stores underlie large-amplitude miniature IPSCs and spontaneous calcium transients. Nat Neurosci. 2000;3:1256–1265. doi: 10.1038/81781. [DOI] [PubMed] [Google Scholar]
- 23.Mackie K, Lai Y, Westenbroek R, Mitchell R. Cannabinoids activate an inwardly rectifying potassium conductance and inhibit Q-type calcium currents in AtT20 cells transfected with rat brain cannabinoid receptor. J Neurosci. 1995;15:6552–6561. doi: 10.1523/JNEUROSCI.15-10-06552.1995. [DOI] [PMC free article] [PubMed] [Google Scholar]
- 24.Maejima T, Hashimoto K, Yoshida T, Aiba A, Kano M. Presynaptic inhibition caused by retrograde signal from metabotropic glutamate to cannabinoid receptors. Neuron. 2001;31:463–475. doi: 10.1016/s0896-6273(01)00375-0. [DOI] [PubMed] [Google Scholar]
- 25.Manzoni OJ, Bockaert J. Cannabinoids inhibit GABAergic synaptic transmission in mice nucleus accumbens. Eur J Pharmacol. 2001;412:R3–R5. doi: 10.1016/s0014-2999(01)00723-3. [DOI] [PubMed] [Google Scholar]
- 26.Marty A, Llano I. Modulation of inhibitory synapses in the mammalian brain. Curr Opin Neurobiol. 1995;5:335–341. doi: 10.1016/0959-4388(95)80046-8. [DOI] [PubMed] [Google Scholar]
- 27.Matsuda LA, Bonner TI, Lolait SJ. Localization of cannabinoid receptor mRNA in rat brain. J Comp Neurol. 1993;327:535–550. doi: 10.1002/cne.903270406. [DOI] [PubMed] [Google Scholar]
- 28.Morishita W, Kirov SA, Alger BE. Evidence for metabotropic glutamate receptor activation in the induction of depolarization-induced suppression of inhibition in hippocampal CA1. J Neurosci. 1998;18:4870–4882. doi: 10.1523/JNEUROSCI.18-13-04870.1998. [DOI] [PMC free article] [PubMed] [Google Scholar]
- 29.Ohno-Shosaku T, Maejima T, Kano M. Endogenous cannabinoids mediate retrograde signals from depolarized postsynaptic neurons to presynaptic terminals. Neuron. 2001;29:729–738. doi: 10.1016/s0896-6273(01)00247-1. [DOI] [PubMed] [Google Scholar]
- 30.Pitler TA, Alger BE. Postsynaptic spike firing reduces synaptic GABAa responses in hippocampal pyramidal cells. J Neurosci. 1992;12:4122–4132. doi: 10.1523/JNEUROSCI.12-10-04122.1992. [DOI] [PMC free article] [PubMed] [Google Scholar]
- 31.Pitler TA, Alger BE. Depolarization-induced suppression of GABAergic inhibition in rat hippocampal pyramidal cells: G protein involvement in a presynaptic mechanism. Neuron. 1994;13:1447–1455. doi: 10.1016/0896-6273(94)90430-8. [DOI] [PubMed] [Google Scholar]
- 32.Shepherd GM. The synaptic organization of the brain. Oxford; New York: 1998. [Google Scholar]
- 33.Sherman SM, Guillery RW. Exploring the thalamus. Academic; San Diego: 2001. [Google Scholar]
- 34.Stella N, Schweitzer P, Piomelli D. A second endogenous cannabinoid that modulates long-term potentiation. Nature. 1997;388:773–778. doi: 10.1038/42015. [DOI] [PubMed] [Google Scholar]
- 35.Stephens GJ, Morris NP, Fyffe RE, Robertson B. The Cav2.1/alpha1A (P/Q-type) voltage-dependent calcium channel mediates inhibitory neurotransmission onto mouse cerebellar Purkinje cells. Eur J Neurosci. 2001;13:1902–1912. doi: 10.1046/j.0953-816x.2001.01566.x. [DOI] [PubMed] [Google Scholar]
- 36.Sullivan JM. Mechanisms of cannabinoid-receptor-mediated inhibition of synaptic transmission in cultured hippocampal pyramidal neurons. J Neurophysiol. 1999;82:1286–1294. doi: 10.1152/jn.1999.82.3.1286. [DOI] [PubMed] [Google Scholar]
- 37.Takahashi KA, Linden DJ. Cannabinoid receptor modulation of synapses received by cerebellar Purkinje cells. J Neurophysiol. 2000;83:1167–1180. doi: 10.1152/jn.2000.83.3.1167. [DOI] [PubMed] [Google Scholar]
- 38.Tsou K, Brown S, Sanudo-Pena MC, Mackie K, Walker JM. Immunohistochemical distribution of cannabinoid CB1 receptors in the rat central nervous system. Neuroscience. 1998;83:393–411. doi: 10.1016/s0306-4522(97)00436-3. [DOI] [PubMed] [Google Scholar]
- 39.Tsou K, Mackie K, Sanudo-Pena MC, Walker JM. Cannabinoid CB1 receptors are localized primarily on cholecystokinin-containing GABAergic interneurons in the rat hippocampal formation. Neuroscience. 1999;93:969–975. doi: 10.1016/s0306-4522(99)00086-x. [DOI] [PubMed] [Google Scholar]
- 40.Twitchell W, Brown S, Mackie K. Cannabinoids inhibit N- and P/Q-type calcium channels in cultured rat hippocampal neurons. J Neurophysiol. 1997;78:43–50. doi: 10.1152/jn.1997.78.1.43. [DOI] [PubMed] [Google Scholar]
- 41.Vaughan CW, McGregor IS, Christie MJ. Cannabinoid receptor activation inhibits GABAergic neurotransmission in rostral ventromedial medulla neurons in vitro. Br J Pharmacol. 1999;127:935–940. doi: 10.1038/sj.bjp.0702636. [DOI] [PMC free article] [PubMed] [Google Scholar]
- 42.Vaughan CW, Connor M, Bagley EE, Christie MJ. Actions of cannabinoids on membrane properties and synaptic transmission in rat periaqueductal gray neurons in vitro. Mol Pharmacol. 2000;57:288–295. [PubMed] [Google Scholar]
- 43.Vincent P, Marty A. Neighboring cerebellar Purkinje cells communicate via retrograde inhibition of common presynaptic interneurons. Neuron. 1993;11:885–893. doi: 10.1016/0896-6273(93)90118-b. [DOI] [PubMed] [Google Scholar]
- 44.Vincent P, Marty A. Fluctuations of inhibitory postsynaptic currents in Purkinje cells from rat cerebellar slices. J Physiol (Lond) 1996;494:183–199. doi: 10.1113/jphysiol.1996.sp021484. [DOI] [PMC free article] [PubMed] [Google Scholar]
- 45.Vincent P, Armstrong CM, Marty A. Inhibitory synaptic currents on rat cerebellar Purkinje cells: modulation by postsynaptic depolarization. J Physiol (Lond) 1992;456:453–471. doi: 10.1113/jphysiol.1992.sp019346. [DOI] [PMC free article] [PubMed] [Google Scholar]
- 46.Wang J, Zucker RS. Photolysis-induced suppression of inhibition in rat hippocampal CA1 pyramidal neurons. J Physiol (Lond) 2001;533:757–763. doi: 10.1111/j.1469-7793.2001.t01-1-00757.x. [DOI] [PMC free article] [PubMed] [Google Scholar]
- 47.Wilson RI, Nicoll RA. Endogenous cannabinoids mediate retrograde signalling at hippocampal synapses. Nature. 2001;410:588–592. doi: 10.1038/35069076. [DOI] [PubMed] [Google Scholar]
- 48.Wilson RI, Kunos G, Nicoll RA. Presynaptic specificity of endocannabinoid signaling in the hippocampus. Neuron. 2001;31:453–462. doi: 10.1016/s0896-6273(01)00372-5. [DOI] [PubMed] [Google Scholar]
- 49.Zilberter Y. Dendritic release of glutamate suppresses synaptic inhibition of pyramidal neurons in rat neocortex. J Physiol (Lond) 2000;528:489–496. doi: 10.1111/j.1469-7793.2000.00489.x. [DOI] [PMC free article] [PubMed] [Google Scholar]
- 50.Zilberter Y, Kaiser KM, Sakmann B. Dendritic GABA release depresses excitatory transmission between layer 2/3 pyramidal and bitufted neurons in rat neocortex. Neuron. 1999;24:979–988. doi: 10.1016/s0896-6273(00)81044-2. [DOI] [PubMed] [Google Scholar]