

Abstract
Activity of the immediate early gene c-fos was compared in rats with neurotoxic lesions of the anterior thalamic nuclei and in surgical controls. Fos levels were measured after rats had been placed in a novel room and allowed to run up and down preselected arms of a radial maze. An additional control group showed that in normal rats, this exposure to a novel room leads to a Fos increase in a number of structures, including the anterior thalamic nuclei and hippocampus. In contrast, rats with anterior thalamic lesions were found to have significantly less Fos-positive cells in an array of sites, including the hippocampus (dorsal and ventral), retrosplenial cortex, anterior cingulate cortex, and prelimbic cortex. These results show that anterior thalamic lesions disrupt multiple limbic brain regions, producing hypoactivity in sites associated in rats with spatial memory. Because many of the same sites are implicated in memory processes in humans (e.g., the hippocampus and retrosplenial cortex), this hypoactivity might contribute to diencephalic amnesia.
Keywords: amnesia, hippocampus, immediate early genes, limbic cortices, rat, spatial memory, thalamus
Research into the neural basis of spatial memory has shown that the interplay of a large number of brain regions is necessary for normal learning. Much of the relevant evidence has come from lesion studies (Olton et al., 1982; Sutherland and Rodriguez, 1989; Sutherland and Hoesing, 1993). This evidence raises the central question of how these regions interact with one another, and to answer this it is necessary to measure how a change in one region affects other areas. In this study, the activity levels of multiple brain areas were assessed after selective lesions of the anterior thalamic nuclei. The anterior thalamic nuclei were targeted because these diencephalic nuclei are thought to play a key role in spatial processing (Blair and Sharp, 1995; Taube, 1995; Taube et al., 1996) and, hence, might prove necessary for normal functioning in a wide array of other sites.
It has been shown repeatedly that selective anterior thalamic lesions (ATx) in rats impair a range of spatial memory tests (Sutherland and Rodriguez, 1989; Aggleton and Sahgal, 1993; Byatt and Dalrymple-Alford, 1996; Sziklas and Petrides, 1999). Not only are these same tests sensitive to hippocampal lesions, but disconnection studies strongly suggest that the hippocampus and the anterior thalamic nuclei can function in an interdependent manner (Warburton et al., 2000, 2001). Likewise, there is lesion evidence that the anterior thalamic nuclei also interact with the retrosplenial cortex in supporting spatial memory (Sutherland and Hoesing, 1993). These findings suggest that anterior thalamic pathology might disrupt processing in multiple brain sites involved in spatial processes. This possibility was examined by mapping changes in the activity of the immediate early gene, c-fos, after bilateral anterior thalamic lesions. This gene was selected not only because it provides a general marker of neuronal activity (Dragunow and Faull, 1989) but also because it has been more specifically linked to mnemonic processes, including spatial memory (Herdegen and Leah, 1998; Tischmeyer and Grimm, 1999; He et al., 2002).
Previous studies have shown that a variety of sites, including the anterior thalamic nuclei and the hippocampus, increase c-fosactivity when normal rats are exposed to a novel environment (Hess et al., 1995; Zhu et al., 1997; Vann et al., 2000a,b). Therefore, we used this manipulation to determine the extent to which anterior thalamic lesions disrupt processing in other regions. After surgery, a lesion group (ATx-novel) and two surgical control groups (Sham-novel and Sham-familiar) were trained in a modified radial-arm maze (RAM) for which the experimenter controlled the choice of every arm so that the lesion and control rats followed exactly the same route. For the final session, the Sham-novel and ATx-novel groups were switched to a new room for the radial-maze task, and Fos levels were subsequently measured. An additional set of animals (“home-cage controls”) helped to determine whether the effects of anterior thalamic lesions on c-fos activity were specific to the behavioral condition used in the main experiment. To confirm the effectiveness of the anterior thalamic lesions, all rats were first screened on a T-maze alternation task.
MATERIALS AND METHODS
Subjects
The main study involved 21 male, pigmented rats (Dark Agouti strain; Harlan Olac, Bicester, UK) divided evenly into three groups (Sham-novel, Sham-familiar, and ATx-novel). All rats were ∼14 weeks of age at the time of surgery. After a recovery period of at least 10 d, animals were food-deprived to 85% of their free-feeding body weight and maintained at this level throughout the experiment. Water was available ad libitum. Sets of single animals from each of the three groups (“triads”) were selected so that they could be trained and then processed for Fos levels concurrently. Another six rats, three with anterior thalamic lesions, were used to examine baseline levels of Fos (home-cage controls). All animals were housed in pairs under diurnal conditions (14/10 hr light/dark cycle), and testing occurred at a regular time during the light period. Animals were thoroughly habituated to handling before the study began. All experiments were performed in accordance with the UK Animals (Scientific Procedures) Act (1986) and associated guidelines.
Apparatus
T-maze. The floors of the T-maze were wooden, painted white, and 10 cm wide. Walls were constructed of clear Perspex, 17 cm high. The stem of the T-maze was 70 cm long, with a guillotine door located 25 cm from the beginning, creating a start area. The cross piece was 140 cm long, and at each end there was a food well 2 cm in diameter and 0.75 cm deep. The maze was supported on two stands 94 cm high and lit by a fluorescent light suspended 164 cm from the ceiling.
Radial-arm maze. Eight equally spaced arms (87 cm long, 10 cm wide), which had a food well at the end (2 cm diameter, 0.5 cm deep), radiated from a wooden octagonal base (34 cm diameter). The walls of the arms were made of Perspex (24 cm high). A Perspex guillotine door (12 cm high) was located at the start of each arm that controlled access in and out of the central platform. Each of these guillotine doors had strings attached to a pulley system, giving the experimenter control of access to each of the arms.
For the main study, one-half of the sham animals (Sham-familiar group) were tested in a rectangular room (room A: 295 × 295 × 260 high) lit by one fluorescent strip light (1.6 m long) over the center of the maze. The room contained salient visual cues such as geometric shapes on three of the four walls, with the door and pulley system acting as visual cues on the fourth wall. The experimenter sat on a stool next to the pulley system in one corner of the room. The remaining sham animals (Sham-novel group) and all of the ATx-novel animals were trained in a second room that differed in its overall shape, size (room B: 255 × 330 × 260 cm high), and lighting [two banks of three fluorescent strip lights (0.5 m long) over the center of the maze]. The position of the experimenter was next to the pulley system in the center of one wall, with salient visual cues that differed in size, shape, and color from those in room A present on the other three walls. On the final day, the Sham-novel and ATx-novel animals were moved to the same room as the Sham-familiar group (room A).
Surgery
Each animal was deeply anesthetized by intraperitoneal injection of pentobarbitone sodium (Sagatal) at a dose of 60 mg/kg. Animals were then placed in a stereotaxic frame (David Kopf Instruments, Tujunga, CA), and the scalp was cut and retracted to expose the skull. A craniotomy was made above the sagittal sinus, and the dura was cut to expose the cortex above the target region.
Anterior thalamic lesions were produced by injections of 0.2 μl of 0.12 m NMDA (Sigma Chemicals, Poole, UK) dissolved in phosphate buffer, pH 7.2, made via a 1 μl syringe (Hamilton, Bonaduz, Switzerland), and placed in two sites in each hemisphere. The stereotaxic coordinates relative to the intra-aural line with the incisor bar set at +0.5 to the horizontal plane were as follows: anteroposterior (AP), +5.2; lateral (LAT), ±0.8; and AP, +5.2; LAT, ±1.7. The medial and lateral lesions were placed 6.2 and 5.6 mm below the top of the dura, respectively. Each injection was made gradually over a 4 min period, after which the needle was left in situ for an additional 4 min before being withdrawn. Sham animals received a control surgery in which the Hamilton syringe was lowered to each target site (i.e., two per hemisphere) but no injections were made. Skin was sutured at the completion of all surgeries, and an antibiotic powder (Acramide; Dales Pharmaceuticals, Skipton, UK) was applied. All rats also received a 5 ml subcutaneous injection of glucose saline.
Behavioral training
T-maze. All rats (21 from the main experiment and 6 home-cage controls) were first run in a T-maze. Testing began at least 3 weeks after surgery. All animals were given several days of habituation to the maze so that they would reliably run down the stem of the maze to find sucrose pellets (45 mg; Noyes Purified Rodent Diet; Noyes, Lancaster, NH) in the food wells in both arms. This was immediately followed by a series of 3 acquisition days, each of 10 trials. Each trial was divided into two phases: a sample run followed by a choice run.
At the start of each trial, a sucrose pellet was placed in each food well and a metal barrier was placed at the neck of the T-maze, blocking access to one arm. On the sample run, the rat was placed in the start area and the guillotine door was raised. Because of the metal barrier, the rat could only enter the open arm, where it was confined for ∼10 sec while it ate the food. It was then picked up and confined to the start area for a delay of 10 sec while the metal barrier was removed. The door to the start area was then raised, and the animal was allowed a free choice of arms. The criteria for selecting an arm consisted of the rat placing a back foot in one of the arms. No retracing was permitted. If the rat had alternated, it was allowed to eat the food reward before being returned to its cage. If the other arm was chosen, the rat was confined to that arm for ∼10 sec and then returned to the cage. The maze was then baited for the next trial, and the rat was placed in the start area. The interval between a test run and the next sample run was ∼3 min.
Radial-arm maze. All 21 animals for the main experiment were trained to run in a modified RAM for which the experimenter controlled the choice of every arm. At the start of a run, all eight arms were baited with a single sucrose pellet, and the door to each arm was opened individually until all eight arms were visited (a completed run). The rat was then contained in the central compartment of the maze for ∼2 min while all arms were rebaited. Each session consisted of multiple runs in the RAM, one after the other, so that each session lasted for 30 min (six runs). Different, randomized arm sequences were used on successive runs. Throughout this training period, the ATx-novel and the Sham-novel groups were trained in one room, while the Sham-familiar group were trained in a distinct, different room. The same RAM was used for all animals.
The final session was essentially identical to those in training (i.e., 30 min of RAM testing), but now, for the first time, the Sham-novel and ATx-novel groups were tested in the same room as the Sham-familiar group room A). Throughout training, all rats were run in triad groups (one Sham-familiar, one Sham-novel, and one ATx-novel). Each triad was then immunohistochemically processed together, to minimize variation across groups. Before every session, including the final session, each animal was placed in a soundproof box in a dark, quiet room for 30 min. At the completion of every session, including the final session, each animal was returned to this box for 90 min. This manipulation was to reduce exposure to other stimuli that might evoke Fos production. On the final day, rats were perfused immediately after this 90 min quiet period.
Home-cage controls
The remaining six animals (three sham, three lesion) were killed 4–6 weeks after performing the T-maze alternation task. After the completion of T-maze testing, these animals remained in their home cage, where they were housed in pairs (one sham, one lesion), with food and water available ad libitum. These control animals, which were removed directly for perfusion, helped to assess whether anterior thalamic lesions only alter Fos levels when there is normally an increase in anterior thalamic c-fos activity.
Immunohistochemistry
Ninety minutes after completing the final radial-arm maze session (or at the same time of day for the home-cage controls), each triad of animals was deeply anesthetized with pentobarbitone sodium (1 mg/kg) and perfused transcardially with 0.1 m PBS followed by 4% paraformaldehyde in 0.1 m PBS. The brains were removed and postfixed in 4% paraformaldehyde for 4 hr and then transferred to 30% sucrose overnight at room temperature with rotation. The tissue from each triad was processed at the same time to reduce variation between groups.
Coronal sections were cut at 30 μm on a freezing microtome and a one-in-two series was collected in 0.1 m PBS containing 0.2% Triton X-100 (PBST). A peroxidase block was then performed for which the sections were transferred to 0.3% hydrogen peroxide in PBST for 10 min to inhibit endogenous peroxidase and then washed several times with PBST. Sections were incubated in PBST containing Fos rabbit polyclonal antibody (1:5000; Ab-5; Oncogene Science, Cambridge, MA) for 48 hr at 4°C with periodic rotation. Sections were then washed with PBST and incubated in biotinylated goat anti-rabbit secondary antibody (diluted 1:200 in PBST; Vectastain; Vector Laboratories, Burlingame, CA) and 1.5% normal goat serum for 2 hr at room temperature on a rotator. Sections were then washed and processed with avidin-biotinylated horseradish peroxidase complex in PBST (Elite Kit; Vector Laboratories) for 1 hr at room temperature, again with constant rotation. Sections were washed again in PBST and then in 0.05m Tris buffer. The reaction was then visualized using diaminobenzidine (DAB Substrate Kit; Vector Laboratories). The reaction was stopped by washing in cold PBS, and then sections were mounted on gelatin-coated slides, dehydrated through a graded series of alcohols, and coverslipped. A separate one-in-four series of sections was mounted directly onto slides and stained using cresyl violet, a Nissl stain.
Image analysis
Sections were scanned using a Leitz (Wetzlar, Germany) Dialux 20 microscope equipped with a Dage-MTI (Michigan City, IN) CCD72S camera interfaced to a PC computer. After image processing, counts of the stained nuclei were performed using the public domain Scion (Frederick, MD) Image 4.0 program. Wherever possible, counting procedures were done without knowledge of the group assignments. Counts were made in a standard frame sample area (0.84 × 0.63 mm) using a 10× objective, and the camera was positioned so that the counts were taken across all cortical layers. For dorsal and ventral hippocampal counts, hippocampal subfields [dentate gyrus (DG), CA3, and CA1], and some of the smaller thalamic nuclei, the entire extent of the target region within the selected coronal sections was assessed. Cell counts were performed using the public domain NIH Image program on a Macintosh computer.
For each brain area analyzed, counts were taken from at least four alternate sections from each hemisphere, and these counts then averaged to produce a mean. The cytoarchitectonic divisions and nomenclature are taken from Swanson (1992). For a given area, the mean count of Fos-positive cells for each rat in a triad (ATx-novel, Sham-novel, and Sham-familiar) was normalized by summing the three mean counts and then dividing the count from one animal by the sum from all three animals. The result was expressed as a percentage. Thus, all sets of normalized scores sum to 100. This procedure reduces variation across triads. These normalized data were then used for the statistical analyses, unless otherwise stated. To reduce type 1 errors, related areas were first grouped in a single ANOVA with two factors: experimental condition and brain region. The groups were as follows: hippocampus, subicular complex, cingulate and parahippocampal cortices, control cortical regions, and the anterior thalamic nuclei. When appropriate, the simple effects for each brain region were analyzed as recommended by Winer (1971).
Regions of interest
A total of 24 regions were analyzed (Table 1), and their locations are depicted in Figure 1. Sites were selected either because they had been implicated previously in memory processes or because they served as control cortical regions. The latter helped to determine the specificity of any findings. All of the sites from which it was decided a priori to count Fos-positive cells are presented.
Table 1.
Abbreviations of brain regions used in figures and tables
| Abbreviation | Brain region |
|---|---|
| Control regions | |
| MOp | Primary motor area |
| SSp | Primary somatosensory area |
| VISp | Primary visual area |
| AUDp | Primary auditory area |
| Hippocampus | |
| dHPC | Dorsal hippocampus |
| vHPC | Ventral hippocampus |
| DG | Dentate gyrus |
| CA3 | CA3 |
| CA1 | CA3 |
| Subicular cortices | |
| Subd | Dorsal subiculum |
| Subv | Ventral subiculum |
| Post | Postsubiculum |
| Pre | Presubiculum |
| Para | Parasubiculum |
| Limbic cortices | |
| PL | Prelimbic cortex |
| cACA | Caudal anterior cingulate cortex |
| rRSP | Rostral retrosplenial cortex |
| cRSP | Caudal retrosplenial cortex |
| ENTm | Medial entorhinal cortex |
| Porh | Postrhinal cortex |
| Peri | Perirhinal cortex |
| Thalamic nuclei | |
| AD | Anterodorsal thalamic nuclei |
| AV | Anteroventral thalamic nuclei |
| AM | Anteromedial thalamic nuclei |
Fig. 1.
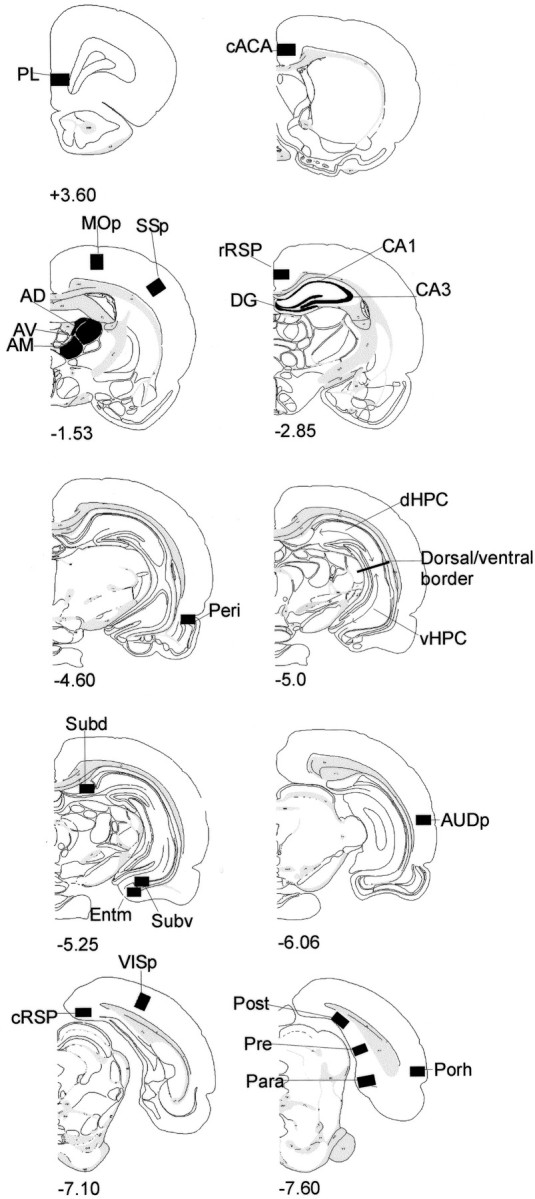
Diagrams of coronal sections indicating areas sampled. The numbers indicate the distance (in millimeters) of the section from bregma (Swanson, 1992). See Table1 for a list of abbreviations.
The cortical control areas comprised the visual cortex [primary visual area (VISp)], the somatosensory cortex [primary somatosensory area (SSp)], the auditory cortex [primary auditory area (AUDp)], and the motor cortex [primary motor area (MOp)]. Counts were taken across all layers of all cortical regions. Cytoarchitectonic subfields within the hippocampal formation consisted of the DG, CA3, and CA1, all in the rostral third of the hippocampus. The dorsal and ventral hippocampal counts were taken from the mid-AP level of the hippocampus and corresponded to AP level −5.0 mm from bregma in Swanson (1992). The border between these two regions corresponded to the dorsoventral level −5.0 mm from bregma (Moser et al., 1995). The dorsal and ventral hippocampal counts involved just the DG and fields CA1 and CA3 (i.e., not the subiculum complex). At this level, the dentate gyrus is present in both the dorsal and ventral hippocampus. Separate counts were also taken from the dorsal and ventral subiculum and from the presubicular, postsubicular, and parasubicular regions (Fig. 1).
Fos-reactive cells were counted in a number of related cortical sites that included the prelimbic area, anterior cingulate cortex (at the genu), rostral and caudal levels of the retrosplenial cortex, and the medial entorhinal cortex. The perirhinal counts involved both areas 35 and 36 (Burwell et al., 1995), whereas the postrhinal cortex only involved cortex posterior to the perirhinal cortex and dorsal to the rhinal sulcus [corresponding to the ectorhinal area in Swanson (1992)and Burwell and Amaral (1998)]. Finally, three anterior thalamic nuclei, the anterodorsal (AD), anteroventral (AV), and anteromedial (AM) nuclei, were counted in the Sham-familiar and Sham-novel groups.
RESULTS
Histological analysis
All animals with cytotoxic lesions showed considerable neuronal loss in the AM, AV, and AD nuclei (Figs. 2 and 3). This sometimes resulted in vacuoles forming in the anterior thalamic nuclei (Fig. 2). In the seven ATx-novel animals, the only sparing was found unilaterally in parts of the AV in two cases. In three animals, bilateral cell loss extended into the rostral portion of the medial dorsal nucleus, while unilateral damage in the most rostral part of the medial dorsal nucleus was observed in an additional case. In five rats, there was damage to rostral midline nuclei adjacent to the anterior thalamic nuclei. Finally, in two cases there was very restricted cell loss at the most rostral limit (0.2 mm) of the dentate gyrus (Fig. 2). The pattern of results in these two cases was indistinguishable from the remaining five.
Fig. 2.

A series of coronal sections showing the area of cell loss in those anterior thalamic animals (ATx-novel) with the smallest (black) and largest (gray) thalamic lesions. Numbersrefer to the distance from bregma.
Fig. 3.
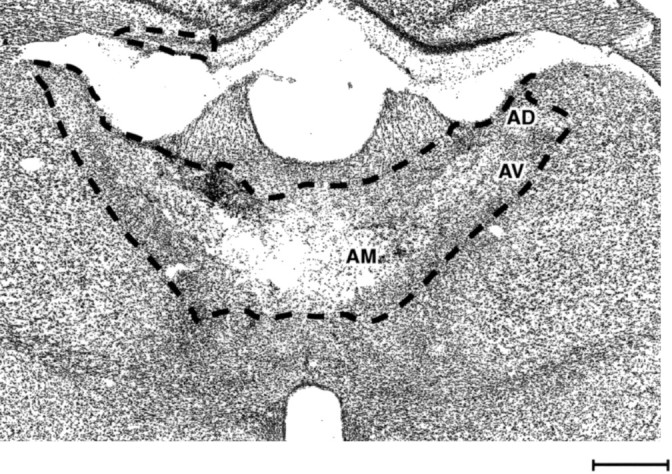
Photomicrograph of a Nissl-stained coronal section showing a bilateral thalamic lesion. The dashed line shows the extent of the lesion. The three principal anterior thalamic nuclei were the sole common lesion site in all cases. Scale bar, 500 μm.
The lesions in the ATx home-cage controls were similar to those in the ATx-novel group, but slightly more restricted within the thalamus (Fig.4). In all three cases, AD was almost completely absent, and two cases showed substantial, bilateral cell loss in AV. There was, however, some bilateral sparing in AM in two cases. As a consequence, the midline thalamic nuclei were consistently spared. There was no apparent cell loss in the medial dorsal thalamic damage, although in two cases there was restricted cell loss in the rostral dentate gyrus (Fig. 4). Additional cell loss was found in the rostral portions of the lateral dorsal nucleus in all three animals.
Fig. 4.

Series of coronal sections showing the lesions in the cases with the largest (gray) and smallest (black) area of thalamic cell loss in the home-cage control animals. Numbers refer to the distance from bregma.
Behavioral results: T-maze
All rats were first run for 30 trials in a T-maze alternation task to confirm the effectiveness of the ATx lesions. The mean overall scores of the three groups were: Sham-familiar, 90.0%; Sham-novel, 87.6%; and ATx-novel, 58.1% (F(2,18)= 65.0; p < 0.0001). For the home-cage controls, the mean overall scores of the two groups were: Sham, 76.7%; ATx, 52.3% (F(1,4) = 7.6; p = 0.052).
Fos counts
The results for the two studies (novel room and home-cage) are given by groups of regions. The home-cage results (Table2) are presented second, because the purpose of this condition was to determine the specificity of any anterior thalamic lesion effects found in the main study. Because the group sizes were smaller in the home-cage condition, some of the null results might reflect the reduced power.
Table 2.
Normalized Fos counts from the home-cage control condition
| Region | Home-cage lesion (n = 3) | Home-cage intact (n = 3) |
|---|---|---|
| Control regions | ||
| MOp | 56.6 ± 5.9 | 43.4 ± 5.9 |
| SSp | 58.5 ± 2.0 | 41.5 ± 2.0 |
| VISp | 51.3 ± 1.6 | 48.7 ± 1.6 |
| AUDp | 56.7 ± 3.5 | 43.3 ± 3.5 |
| Hippocampus | ||
| dHPC | 50.0 ± 2.7 | 50.0 ± 2.7 |
| vHPC | 48.9 ± 3.6 | 51.1 ± 3.6 |
| DG | 51.8 ± 10.2 | 48.2 ± 10.2 |
| CA3 | 54.0 ± 12.5 | 46.0 ± 12.5 |
| CA1 | 52.0 ± 4.9 | 48.0 ± 4.9 |
| Subicular cortices | ||
| Subd | 48.1 ± 2.2 | 51.9 ± 2.2 |
| Subv | 52.2 ± 4.1 | 47.8 ± 4.1 |
| Post | 42.3 ± 4.2 | 57.7 ± 4.2 |
| Pre | 46.0 ± 3.6 | 54.0 ± 3.6 |
| Para | 43.0 ± 3.2 | 57.0 ± 3.2 |
| Limbic cortices | ||
| PL | 57.0 ± 3.0 | 43.0 ± 3.0 |
| cACA | 42.1 ± 4.6 | 57.9 ± 4.6 |
| rRSP | 43.2 ± 4.0 | 56.8 ± 4.0 |
| cRSP | 48.9 ± 9.1 | 51.1 ± 9.1 |
| ENTm | 55.1 ± 9.5 | 44.9 ± 9.5 |
| Porh | 48.6 ± 3.4 | 51.4 ± 3.4 |
| Peri | 45.7 ± 2.9 | 54.3 ± 2.9 |
The initial comparison examined whether the test manipulation (move to a novel room) was itself sufficient to increase c-fos in the anterior thalamic nuclei. Comparisons using the normalized counts from all three principal nuclei (AD, AV, and AM) in the two Sham groups confirmed that there were more Fos-positive cells in the novel-room group (F(1,12) = 7.6;p < 0.05). However, this Fos increase was not found for all three nuclei (group by nucleus interaction;F(2,24) = 5.3; p < 0.05), and although the anteroventral (F(1,36) = 6.7; p < 0.05) and anteromedial (F(1,36) = 12.7; p < 0.01) nuclei had significantly higher counts in the novel-room condition, there was no group difference in the anterodorsal nucleus (F < 1) (Fig.5).
Fig. 5.

Normalized counts of Fos-positive nuclei in the anterior thalamus. Data are shown as means ± SE. All normalized data sum to 100 (see Materials and Methods). See Table 1 for abbreviations. Significance of group differences in normalized counts: *p < 0.05 (Sham-familiar vs Sham-novel).
Hippocampus
Analyses using counts taken across all subfields of the hippocampus proper (dorsal hippocampus, ventral hippocampus, CA1, CA3, and dentate gyrus) revealed a significant group effect (F(2,18) = 7.0; p < 0.01) for the novel-room study. These group differences, which were found for both the dorsal hippocampus (F(2,90) = 8.2; p < 0.01) and ventral hippocampus (F(2,90)= 12.3; p < 0.001), reflected the higher Fos counts in the Sham-novel group compared with both the Sham-familiar and ATx-novel groups. Thus moving rooms increased Fos counts in normal animals (Sham-novel vs Sham-familiar) in both the dorsal (Tukey's test;q = 4.4; p < 0.05) and ventral (q = 5.4; p < 0.05) hippocampus. In contrast, this increase was not seen after ATx lesions, because the Fos counts in the ATx-novel group did not differ from the Sham-familiar group, but were significantly lower than those in the Sham-novel group in both the dorsal (q = 5.7; p < 0.05) and ventral (q = 6.6; p < 0.05) hippocampus. No group differences were found, however, when counts were made in more rostral levels of CA1 (F(2,90) = 2.3; p > 0.1), CA3 (F < 1), or the dentate gyrus (F < 1) (Fig. 6). In contrast, no apparent effect of lesion on Fos counts was found for the home-cage condition, even when the hippocampal regions were considered together (F < 1).
Fig. 6.

Normalized counts of Fos-positive nuclei in the hippocampus. Data are shown as means ± SE. All normalized data sum to 100 (see Materials and Methods). See Table 1 for abbreviations. Significance of group differences in normalized counts: *p < 0.05 (Sham-familiar vs Sham-novel);●p < 0.05 (Sham-novel vs ATx-novel).
Subicular complex
A comparison involving the various subicular cortices revealed a significant group difference for the subicular complex (F(2,18) = 3.79; p < 0.05) in the novel-room study. Within the various subregions, the only significant group difference was found for the parasubiculum (F(2,90) = 4.1; p < 0.05), with the Sham-novel animals expressing higher Fos levels than the Sham-familiar animals (q = 3.8; p< 0.05). The ATx-novel group did not differ from either of the sham groups. No clear group differences were found in the remaining regions, such as the dorsal subiculum (F < 1), ventral subiculum (F(2,90) = 1.5;p > 0.1), postsubiculum (F(2,90) = 2.6; p = 0.08), and presubiculum (F(2,90) = 1.8; p > 0.1) (Fig.7).
Fig. 7.

Normalized counts of Fos-positive nuclei in the subicular complex. Data are shown as means ± SE. All normalized data sum to 100 (see Materials and Methods). See Table 1 for abbreviations. Significance of group differences in normalized counts: *p < 0.05 (Sham-familiar vs Sham-novel).
A slightly different pattern of results was found for the home-cage condition. Comparisons using counts from the various subicular regions revealed a borderline lesion effect (F(1,4) = 7.0; p = 0.058) as well as evidence of a group-by-area interaction (F(4,16) = 2.9; p = 0.055). In view of these suggestive main effects, the simple effects were examined, and these revealed a significant decrease in Fos labeling not only in the parasubiculum (p = 0.012) but also in the postsubiculum (p = 0.006) in the animals with ATx lesions. No other subicular region differed between the two groups.
Cingulate and parahippocampal cortices
The ATx lesions produced a very striking hypoactivity in parts of these cortical areas. These changes were reflected in the overall group effect for this region in the novel-room study (F(2,18) = 32.1; p < 0.001). The most marked group differences were found in the rostral and caudal retrosplenial cortices (rostral,F(2,126) = 22.5, p < 0.001; caudal, F(2,126) = 41.0,p < 0.001). In both sites, the manipulation of moving to a novel room increased Fos counts in the sham animals (Sham-novel vs Sham-familiar; rostral, q = 4.6, p < 0.05; caudal, q = 5.9, p < 0.05), whereas the ATx lesions produced a significant decrease. This decrease in Fos counts was found not only when ATx-novel animals were compared with the Sham-novel animals (rostral, q = 9.5,p < 0.05; caudal, q = 12.8,p < 0.05), but also when the ATx-novel animals were compared with the Sham-familiar animals (rostral, q = 4.9, p < 0.05; caudal, q = 6.9,p < 0.05). In the anterior cingulate area (F(2,126) = 11.0; p < 0.001), the ATx-novel animals again had fewer cell counts than both the Sham-novel (q = 6.5; p < 0.05) and the Sham-familiar (q = 4.2; p < 0.05) groups, but here the two sham groups did not differ (q= 2.3; p > 0.05). Finally, a significant group difference was present in the prelimbic cortex (F(2,126) = 8.7; p < 0.001), with the Sham-novel condition expressing higher Fos counts than both the Sham-familiar (q = 4.5;p < 0.05) and ATx-novel (q = 5.5;p < 0.05) conditions. Unlike the cingulate and retrosplenial cortices, the latter two groups did not differ (Fig.8).
Fig. 8.

Normalized counts of Fos-positive nuclei in the limbic cortices. Data are shown as means ± SE. All normalized data sum to 100 (see Materials and Methods). See Table 1 for abbreviations. Significance of group differences in normalized counts: *p < 0.05 (Sham-familiar vs Sham-novel);●p < 0.05 (Sham-novel vs ATx-novel).
The only significant change in the perirhinal cortex (F(2,126) = 4.4; p < 0.05) arose from the Fos increase associated with being placed in a novel room. Thus the Sham-novel group differed from the Sham-familiar group (q = 4.1; p < 0.05), but there were no other group differences. Similarly, in the postrhinal cortex the counts for the ATx-novel group were midway between the two sham groups but differed from neither, so that the significant group effect (F(2,126) = 3.7; p < 0.05) reflected the higher Fos counts in the sham-novel compared with the sham-familiar group (q = 3.8; p < 0.05). There was no overall group difference for the medial entorhinal cortex (F(2,126) = 2.3;p > 0.1) (Fig. 8).
The home-cage condition also revealed lesion effects on cortical Fos levels, but these were restricted to the caudal retrosplenial cortex. Counts made across the various cortical regions revealed a main effect of lesion group (F(1,4) = 7.8;p < 0.05). Subsequent analyses showed a significant reduction in caudal retrosplenial Fos counts after ATx lesions (F(1,28) = 5.5; p < 0.05), but not in any of the other regions examined (prelimbic cortex,F(1,28) = 2.4, p > 0.1; rostral retrosplenial cortex,F(1,28) = 2.2, p > 0.1; anterior cingulate cortex,F(1,28) = 3.0, p = 0.09; medial entorhinal cortex,F(1,28) = 1.2, p > 0.1; perirhinal cortex, F < 1; and postrhinal cortex,F < 1).
Cortical control areas
Across the four cortical control areas (MOp, SSp, VISp, and AUDp), there was a significant group effect in the main study (F(2,18) = 13.1; p < 0.001). Although the two sham groups did not differ for any of these areas, the ATx lesions had the effect of raising Fos levels in the primary motor and somatosensory cortices (Fig. 9). In the motor area, there was a significant group difference (F(2,72) = 12.1; p < 0.001), with the ATx-novel group demonstrating significantly higher counts than both the Sham-familiar (q = 6.1;p < 0.05) and Sham-novel (q = 6.0;p < 0.05) groups. This pattern of effects was repeated within the primary somatosensory area (F(2,72) = 12.4; p < 0.001): ATx-novel versus Sham-familiar (q = 6.8;p < 0.05), ATx-novel versus Sham-novel (q = 5.1; p < 0.05). In addition, Fos counts were significantly higher in the ATx-novel group in the primary visual area (F(2,72) = 3.7;p < 0.05), but the only group difference was between the ATx-novel and Sham-familiar groups (q = 3.8;p < 0.05). Finally, no group differences were found in the primary auditory cortex (F < 1) (Fig. 8).
Fig. 9.

Normalized counts of Fos-positive nuclei in the control cortical areas. Data are shown as means ± SE. All normalized data sum to 100 (see Materials and Methods). See Table 1 for abbreviations. Significance of group differences in normalized counts:●p < 0.05 (Sham-familiar and Sham-novel vs ATx-novel).
Similar anterior thalamic lesion effects were found in the home-cage condition. Although there was no overall group effect for the four cortical areas (F(1,4) = 5.2;p > 0.05) a group-by-area interaction was observed (F(3,12) = 3.4; p = 0.05). Additional analyses indicated significant differences for MOp (F(1,16) = 6.3; p < 0.05) and SSp (F(1,16) = 10.5;p < 0.01), with higher levels of Fos observed in the ATx home-cage control group in both areas. The remaining cortical control areas did not show a significant effect of lesion (F < 1).
DISCUSSION
Using Fos as a marker, this study mapped how anterior thalamic lesions alter the activation that normally accompanies exposure to a novel environment. These thalamic nuclei were targeted because of their importance for spatial memory and because they show a Fos increase when normal rats are placed in a novel room, an effect replicated in the present study. Furthermore, many brain sites connected with the anterior thalamic nuclei also show increased c-fos activity when exposed to a novel environment (Zhu et al., 1997; Vann et al., 2000a,b), suggesting that these links may be recruited when learning about new locations. Among these links, there is specific evidence that interconnections between the anterior thalamic nuclei and the hippocampus are of especial importance in both rats (Warburton et al., 2000) and monkeys (Parker and Gaffan, 1997). The present study made it possible to study this relationship in a novel way that also placed it within the broader context of other brain sites.
Perhaps the most striking finding was the complementary manner in which a subgroup of interlinked sites showed an increase in Fos levels when exposed to a novel environment but showed a decrease after anterior thalamic lesions. Thus, in normal rats (Sham-novel vs Sham-familiar) Fos increases were found in the hippocampus (dorsal and ventral), retrosplenial cortices (rostral and caudal), and prelimbic cortex. These same sites, which all receive anterior thalamic inputs (Shibata, 1993a,b; van Groen et al., 1999), showed a significant decrease in Fos counts after anterior thalamic lesions (Sham-novel vs ATx-novel). The disruption to a cluster of sites that would normally be engaged by the behavioral manipulation highlights the multiple means by which anterior thalamic lesions could alter normal patterns of behavior.
For the hippocampus (dorsal and ventral) and prelimbic cortex, the Fos levels in the anterior thalamic lesion animals did not differ from those in normal animals that had remained in a familiar room (Sham-familiar vs ATx-novel). This finding, combined with the lack of any evidence for a hippocampal or prelimbic cortex change in the home-cage controls, suggests that the anterior thalamic lesions blocked the rise in c-fos expression that normally follows exposure to a novel environment (Vann et al., 2000a,b). In contrast, Fos counts in the retrosplenial cortex were reduced in the ATx home-cage controls as well as in the ATx-novel group when compared with both the Sham-familiar and Sham-novel groups. These retrosplenial data reveal a far more profound hypoactivity than that found in other limbic areas.
The retrosplenial cortex has dense, reciprocal connections with the anterior thalamic nuclei (van Groen et al., 1993), reflecting the fact that these two regions often function in an integrated manner (Sutherland and Hoesing, 1993). Evidence that retrosplenial activity may depend on the integrity of the anterior thalamic nuclei was first revealed in electrophysiological recordings made during the acquisition of an avoidance response by rabbits (Gabriel et al., 1989; Gabriel, 1993). Anterior thalamic lesions were found to block the normal development of training-induced discriminative neuronal activity in the retrosplenial cortex. The present findings show that the importance of the anterior thalamic nuclei extends beyond avoidance learning, and suggest that almost any retrosplenial function (Maguire, 2001) will be disrupted by anterior thalamic pathology.
Four additional cortical sites were examined to test whether the behavioral manipulation produced nonselective changes in activity. Comparisons between the two sham groups found no Fos differences in the primary motor, somatosensory, visual, or auditory cortices, suggesting that the limbic increase in c-fos activation was a selective response to the novel room. Although the effects of increased stress or arousal cannot be precluded, these effects are presumed to be minor, because behavioral indicators such as food consumption or fecal boli were not differentially affected by the room switch.
The anterior thalamic lesions did, however, increase c-fosactivity in motor and somatosensory cortices (ATx-novel vs Sham-novel). Furthermore, similar changes were found in the ATx home-cage controls. Although these results might indicate a hyperactive motor state, this seems unlikely. Previous studies have found no evidence that anterior thalamic lesions induce hyperactivity (Warburton et al., 1997;Warburton and Aggleton, 1999), and the present task design should have constrained any activity differences. Furthermore, the most likely consequence of motor hyperactivity would have been an upregulation of c-fos across brain sites, as is clearly seen when Fos counts are compared between active and home-cage groups (Vann et al., 2000c). Contrary to this, all significant Fos changes were in the opposite direction (i.e., the ATx-novel group had abnormally low Fos levels). Last, a recent study of unilateral anterior thalamic lesions also found Fos increases in the primary motor cortex on the lesioned hemisphere relative to the unlesioned side, an increase that presumably cannot be a result of motor hyperactivity (T. A. Jenkins, unpublished observations). These factors all suggest that the upregulation in the motor and somatosensory cortices was a secondary response to the hypoactivity found elsewhere, most obviously in the cingulate/retrosplenial cortices.
All rats were initially tested on T-maze alternation. This task not only confirmed the effectiveness of the lesions (Aggleton et al., 1995) but also highlighted constraints on how the effects of bilateral anterior thalamic lesions on Fos production could be examined. In previous studies (Vann et al., 2000a,b) Fos production has been compared in normal rats performing working memory tests in the standard RAM task (Olton et al., 1978). This was not possible in the present study, because bilateral anterior thalamic lesions severely impair this behavioral test (Aggleton et al., 1996; Byatt and Dalrymple-Alford, 1996), resulting in abnormal running and reward patterns. This would, in turn, invalidate comparisons with sham controls. However, the difference in methodology does make it possible to compare exposure to a novel room in the RAM but with no specific memory demand (“passive” exposure; Sham-novel vs Sham-familiar) with exposure to a novel room when both groups are also performing a test of working memory (“active” exposure; Vann et al., 2000a,b).
The active memory condition resulted in increased Fos in more sites, most notably within the hippocampal formation. Thus performing the working memory RAM task in a novel room led to additional Fos increases in the dentate gyrus, CA1, CA3, dorsal subiculum, presubiculum, postsubiculum, medial entorhinal, and lateral entorhinal cortex, as well as in the dorsal hippocampus, ventral hippocampus, and parasubiculum (Vann et al., 2000a,b). It therefore appears that using the map of the novel room recruits an additional array of hippocampal regions, contrasting with the present, more passive condition. At the same time, the Fos increases in the present passive condition presumably reflect spatial processing that occurs in an automatic, on-line manner, although it is not subsequently needed for task performance (Pearce et al., 2001).
Much of the previous evidence on the functional relationships between the anterior thalamic nuclei and hippocampal formation has concerned “head-direction” cells. Evidence has emerged of a critical pathway for head-direction information from the lateral mammillary nucleus (Blair et al., 1999) to AD (Taube, 1995; Blair et al., 1997) and, from there, to the postsubiculum (Taube, 1995; Taube et al., 1996; Blair et al., 1997; Goodridge and Taube, 1997). For this reason, the lack of a more clear-cut change in postsubicular Fos levels in the main study may appear surprising. It was, however, the case that AD was the one anterior thalamic nucleus not to show Fos increases in the novel room (Sham-novel vs Sham-familiar), potentially attenuating any lesion effect. More consistent with the anatomical links between these regions (Shibata 1993b; Van Groen and Wyss, 1995), postsubicular changes were found in the home-cage condition. In summary, it can be assumed that although some of the hippocampal Fos changes found in the ATx-novel group reflect a loss of head-direction information, pathology in AD is unlikely to be the sole cause. Consistent with this, lesion studies have found that the spatial deficit associated with anterior thalamic damage depends on the involvement of all three nuclei, and not just AD (Aggleton et al., 1996; Byatt and Dalrymple-Alford, 1996; van Groen et al., 2002). Furthermore, recent electrophysiological studies have shown that a large proportion of cells in AV fire rhythmically in synchrony with hippocampal theta (Vertes et al., 2001). These data all indicate that the anterior thalamic input to the hippocampal formation comprises more than just head-direction information.
The growing evidence for the importance of anterior thalamic–hippocampal interactions (Warburton et al., 2001) is potentially informative, because it may help to explain why pathology in the anterior thalamic region can lead to amnesia in humans (Aggleton and Brown, 1999; Harding et al., 2000; Van der Werf et al., 2000). A possibility is that anterior thalamic pathology renders dysfunctional a number of key limbic sites, including the hippocampus and cingulate cortices. In view of the importance of the hippocampus for temporal lobe amnesia, it would then be predicted that anterior thalamic pathology could, indirectly, lead to similar memory impairments via its impact on the medial temporal lobe. The present study provides support for this proposal.
Footnotes
This research was supported by Programme Grant 35 42994 from the Medical Research Council. We thank Angela Morgan and Seralynne Vann for their assistance.
Correspondence should be addressed to J. P. Aggleton, School of Psychology, Cardiff University, Tower Building, Park Place, Cardiff CF10 3YG, UK. E-mail: Aggleton@cardiff.ac.uk.
R. Dias' present address: Merck, Sharpe, and Dohm, Neuroscience Research Centre, Terlings Park, Harlow, Essex CM20 2QR, UK.
REFERENCES
- 1.Aggleton JP, Brown MW. Episodic memory, amnesia, and the hippocampal-anterior thalamic axis. Behav Brain Sci. 1999;22:425–489. [PubMed] [Google Scholar]
- 2.Aggleton JP, Sahgal AA. The contribution of the anterior thalamic nuclei to anterograde amnesia. Neuropsychologia. 1993;31:1001–1019. doi: 10.1016/0028-3932(93)90029-y. [DOI] [PubMed] [Google Scholar]
- 3.Aggleton JP, Neave N, Nagle S, Hunt PR. A comparison of the effects of anterior thalamic, mamillary body, and fornix lesions on reinforced spatial alternation. Behav Brain Res. 1995;68:91–101. doi: 10.1016/0166-4328(94)00163-a. [DOI] [PubMed] [Google Scholar]
- 4.Aggleton JP, Hunt PR, Nagle S, Neave N. The effects of selective lesions within the anterior thalamic nuclei on spatial memory in the rat. Behav Brain Res. 1996;81:189–198. doi: 10.1016/s0166-4328(96)89080-2. [DOI] [PubMed] [Google Scholar]
- 5.Blair HT, Sharp PE. Anticipatory head direction signals in anterior thalamus: evidence for a thalamocortical circuit that integrates angular head motion to compute head direction. J Neurosci. 1995;15:6260–6270. doi: 10.1523/JNEUROSCI.15-09-06260.1995. [DOI] [PMC free article] [PubMed] [Google Scholar]
- 6.Blair HT, Lipscomb BW, Sharp PE. Anticipatory time intervals of head-direction cells in the anterior thalamus of the rat: implications for path integration in the head direction circuit. J Neurophysiol. 1997;78:145–159. doi: 10.1152/jn.1997.78.1.145. [DOI] [PubMed] [Google Scholar]
- 7.Blair HT, Cho J, Sharp PE. The anterior thalamic head-direction signal is abolished by bilateral but not unilateral lesions of the lateral mammillary nucleus. J Neurosci. 1999;19:6673–6683. doi: 10.1523/JNEUROSCI.19-15-06673.1999. [DOI] [PMC free article] [PubMed] [Google Scholar]
- 8.Burwell RD, Amaral DG. Cortical afferents of the perirhinal, postrhinal, and entorhinal cortices of the rat. J Comp Neurol. 1998;398:179–205. doi: 10.1002/(sici)1096-9861(19980824)398:2<179::aid-cne3>3.0.co;2-y. [DOI] [PubMed] [Google Scholar]
- 9.Burwell RD, Witter MP, Amaral DG. Perirhinal and postrhinal cortices of the rat: a review of the neuroanatomical literature and comparison with findings from the monkey brain. Hippocampus. 1995;5:390–408. doi: 10.1002/hipo.450050503. [DOI] [PubMed] [Google Scholar]
- 10.Byatt G, Dalrymple-Alford JC. Both anteromedial and anteroventral thalamic lesions impair radial-maze learning in rats. Behav Neurosci. 1996;110:1335–1348. doi: 10.1037//0735-7044.110.6.1335. [DOI] [PubMed] [Google Scholar]
- 11.Dragunow M, Faull R. The use of c-fos as a metabolic marker in neuronal pathway tracing. J Neurosci Methods. 1989;29:261–265. doi: 10.1016/0165-0270(89)90150-7. [DOI] [PubMed] [Google Scholar]
- 12.Gabriel M. A discriminative avoidance learning system. In: Vogt BA, Gabriel M, editors. Neurobiology of cingulate cortex and limbic thalamus: a comprehensive handbook. Birkhauser; Boston: 1993. pp. 478–523. [Google Scholar]
- 13.Gabriel M, Sparenborg S, Kubota Y. Anterior and medial thalamic lesions, discriminative avoidance learning, and cingulate cortical activity in rabbits. Exp Brain Res. 1989;76:441–457. doi: 10.1007/BF00247901. [DOI] [PubMed] [Google Scholar]
- 14.Goodridge JP, Taube JS. Interaction between the postsubiculum and anterior thalamus in the generation of head direction cell activity. J Neurosci. 1997;17:9315–9330. doi: 10.1523/JNEUROSCI.17-23-09315.1997. [DOI] [PMC free article] [PubMed] [Google Scholar]
- 15.Harding A, Halliday G, Caine D, Kril J. Degeneration of anterior thalamic nuclei differentiates alcoholics with amnesia. Brain. 2000;123:141–154. doi: 10.1093/brain/123.1.141. [DOI] [PubMed] [Google Scholar]
- 16.He J, Yamada K, Nabeshima T. A role of Fos expression in the CA3 region of the hippocampus in spatial memory formation in rats. Neuropsychopharmacology. 2002;26:259–268. doi: 10.1016/S0893-133X(01)00332-3. [DOI] [PubMed] [Google Scholar]
- 17.Herdegen T, Leah JD. Inducible and constitutive transcription factors in the mammalian nervous system: control of gene expression by Jun, Fos and Krox, and CREB/ATF proteins. Brain Res Brain Res Rev. 1998;28:379–490. doi: 10.1016/s0165-0173(98)00018-6. [DOI] [PubMed] [Google Scholar]
- 18.Hess US, Lynch G, Gall CM. Regional patterns of c-fos mRNA expression in rat hippocampus following exploration of a novel environment versus performance of a well-learned discrimination. J Neurosci. 1995;15:7796–7809. doi: 10.1523/JNEUROSCI.15-12-07796.1995. [DOI] [PMC free article] [PubMed] [Google Scholar]
- 19.Maguire EA. The retrosplenial contribution to human navigation: a review of lesion and neuroimaging findings. Scand J Psychol. 2001;43:225–238. doi: 10.1111/1467-9450.00233. [DOI] [PubMed] [Google Scholar]
- 20.Moser M-B, Moser EI, Forrest E, Andersen P, Morris RGM. Spatial learning with a minislab in the dorsal hippocampus. Proc Natl Acad Sci USA. 1995;92:9697–9701. doi: 10.1073/pnas.92.21.9697. [DOI] [PMC free article] [PubMed] [Google Scholar]
- 21.Olton DS, Walker JA, Gage FH. Hippocampal connections and spatial discrimination. Brain Res. 1978;139:295–308. doi: 10.1016/0006-8993(78)90930-7. [DOI] [PubMed] [Google Scholar]
- 22.Olton DS, Walker JA, Woolf WA. A disconnection analysis of hippocampal function. Brain Res. 1982;233:241–253. doi: 10.1016/0006-8993(82)91200-8. [DOI] [PubMed] [Google Scholar]
- 23.Parker A, Gaffan D. The effect of anterior thalamic and cingulate cortex lesions on object-in-place memory in monkeys. Neuropsychologia. 1997;35:1093–1102. doi: 10.1016/s0028-3932(97)00042-0. [DOI] [PubMed] [Google Scholar]
- 24.Pearce JM, Ward-Robinson J, Good M, Fussell C, Aydin A. Influence of a beacon on spatial learning based on the shape of the test environment. J Exp Psychol. 2001;27:329–344. doi: 10.1037//0097-7403.27.4.329. [DOI] [PubMed] [Google Scholar]
- 25.Shibata H. Efferent projections from the anterior thalamic nuclei to the cingulate cortex in the rat. J Comp Neurol. 1993a;330:533–542. doi: 10.1002/cne.903300409. [DOI] [PubMed] [Google Scholar]
- 26.Shibata H. Direct projections from the anterior thalamic nuclei to the retrohippocampal region in the rat. J Comp Neurol. 1993b;337:431–445. doi: 10.1002/cne.903370307. [DOI] [PubMed] [Google Scholar]
- 27.Sutherland RJ, Hoesing JM. Posterior cingulate cortex and spatial memory: a microlimnology analysis. In: Vogt BA, Gabriel M, editors. Neurobiology of cingulate cortex and limbic thalamus: a comprehensive handbook. Birkhauser; Boston: 1993. pp. 461–477. [Google Scholar]
- 28.Sutherland RJ, Rodriguez AJ. The role of the fornix/fimbria and some related subcortical structures in place learning and memory. Behav Brain Res. 1989;32:265–277. doi: 10.1016/s0166-4328(89)80059-2. [DOI] [PubMed] [Google Scholar]
- 29.Swanson LW. Brain maps: structure of the rat brain. Elsevier; Amsterdam: 1992. [Google Scholar]
- 30.Sziklas V, Petrides M. The effects of lesions to the anterior thalamic nuclei on object-place associations in rats. Eur J Neurosci. 1999;11:559–566. doi: 10.1046/j.1460-9568.1999.00448.x. [DOI] [PubMed] [Google Scholar]
- 31.Taube JS. Head direction cells recorded in the anterior thalamic nuclei of freely moving rats. J Neurosci. 1995;15:70–86. doi: 10.1523/JNEUROSCI.15-01-00070.1995. [DOI] [PMC free article] [PubMed] [Google Scholar]
- 32.Taube JS, Goodridge JP, Golob EJ, Dudchenko PA, Stackman RW. Processing the head direction cell signal: a review and commentary. Brain Res Bull. 1996;40:477–486. doi: 10.1016/0361-9230(96)00145-1. [DOI] [PubMed] [Google Scholar]
- 33.Tischmeyer W, Grimm R. Activation of immediate early genes and memory formation. Cell Mol Life Sci. 1999;55:564–574. doi: 10.1007/s000180050315. [DOI] [PMC free article] [PubMed] [Google Scholar]
- 34.Van der Werf YD, Witter MP, Uylings HBM, Jolles J. Neuropsychology of infarctions in the thalamus: a review. Neuropsychologia. 2000;38:613–627. doi: 10.1016/s0028-3932(99)00104-9. [DOI] [PubMed] [Google Scholar]
- 35.Van Groen T, Wyss JM. Projections from the anterodorsal and anteroventral nucleus of the thalamus to the limbic cortex in the rat. J Comp Neurol. 1995;358:584–604. doi: 10.1002/cne.903580411. [DOI] [PubMed] [Google Scholar]
- 36.van Groen T, Vogt BA, Wyss J. Interconnections between the thalamus and retrosplenial cortex in the rodent brain. In: Vogt BA, Gabriel M, editors. Neurobiology of cingulate cortex and limbic thalamus: a comprehensive handbook. Birkhauser; Boston: 1993. pp. 123–150. [Google Scholar]
- 37.van Groen T, Kadish I, Wyss JM. Efferent connections of the anteromedial nucleus of the thalamus of the rat. Brain Res Brain Res Rev. 1999;30:1–26. doi: 10.1016/s0165-0173(99)00006-5. [DOI] [PubMed] [Google Scholar]
- 38.van Groen T, Kadish I, Wyss JM. Role of the anterodorsal and anteroventral nuclei of the thalamus in spatial memory in the rat. Behav Brain Res. 2002;132:19–28. doi: 10.1016/s0166-4328(01)00390-4. [DOI] [PubMed] [Google Scholar]
- 39.Vann SD, Brown MW, Aggleton JP. Fos expression in the rostral thalamic nuclei and associated cortical regions in response to different spatial memory tests. Neuroscience. 2000a;101:983–991. doi: 10.1016/s0306-4522(00)00288-8. [DOI] [PubMed] [Google Scholar]
- 40.Vann SD, Brown MW, Erichsen JT, Aggleton JP. Fos imaging reveals differential patterns of hippocampal and parahippocampal subfield activation in rats in response to different spatial memory tasks. J Neurosci. 2000b;20:2711–2718. doi: 10.1523/JNEUROSCI.20-07-02711.2000. [DOI] [PMC free article] [PubMed] [Google Scholar]
- 41.Vann SD, Brown MW, Erichsen JT, Aggleton JP. Using Fos imaging in the rat to reveal the anatomical extent of the disruptive effects of fornix lesions. J Neurosci. 2000c;20:8144–8152. doi: 10.1523/JNEUROSCI.20-21-08144.2000. [DOI] [PMC free article] [PubMed] [Google Scholar]
- 42.Vertes RP, Albo Z, Viana di Prisco G. Theta-rhythmically firing neurons in the anterior thalamus: implications for mnemonic functions of Papez's circuit. Neuroscience. 2001;140:619–625. doi: 10.1016/s0306-4522(01)00131-2. [DOI] [PubMed] [Google Scholar]
- 43.Warburton EC, Aggleton JP. Differential deficits in the Morris water maze following cytotoxic lesions of the anterior thalamus and fornix transection. Behav Brain Res. 1999;98:27–38. doi: 10.1016/s0166-4328(98)00047-3. [DOI] [PubMed] [Google Scholar]
- 44.Warburton EC, Baird AL, Aggleton JP. Assessing the magnitude of the allocentric spatial deficit associated with complete loss of the anterior thalamic nuclei in rats. Behav Brain Res. 1997;87:223–232. doi: 10.1016/s0166-4328(97)02285-7. [DOI] [PubMed] [Google Scholar]
- 45.Warburton EC, Baird AL, Morgan A, Muir J, Aggleton JP. Disconnecting hippocampal projections to the anterior thalamus produces deficits on tests of spatial memory in rats. Eur J Neurosci. 2000;12:1714–1726. doi: 10.1046/j.1460-9568.2000.00039.x. [DOI] [PubMed] [Google Scholar]
- 46.Warburton EC, Baird AL, Morgan A, Muir J, Aggleton JP. The conjoint importance of the hippocampus and anterior thalamic nuclei for allocentric spatial learning: evidence from a disconnection study in the rat. J Neurosci. 2001;21:7323–7330. doi: 10.1523/JNEUROSCI.21-18-07323.2001. [DOI] [PMC free article] [PubMed] [Google Scholar]
- 47.Winer BJ. Statistical principles in experimental design. McGraw-Hill; New York: 1971. [Google Scholar]
- 48.Zhu XO, McCabe BJ, Aggleton JP, Brown MW. Differential activation of the hippocampus and perirhinal cortex by novel visual stimuli and a novel environment. Neurosci Lett. 1997;229:141–143. doi: 10.1016/s0304-3940(97)00437-0. [DOI] [PubMed] [Google Scholar]