

Abstract
We performed a series of functional magnetic resonance imaging experiments to divide the human MT+ complex into subregions that may be identified as homologs to a pair of macaque motion-responsive visual areas: the middle temporal area (MT) and the medial superior temporal area (MST). Using stimuli designed to tease apart differences in retinotopic organization and receptive field size, we established a double dissociation between two distinct MT+ subregions in 8 of the 10 hemispheres studied. The first subregion exhibited retinotopic organization but did not respond to peripheral ipsilateral stimulation, indicative of smaller receptive fields. Conversely, the second subregion within MT+ did not demonstrate retinotopic organization but did respond to peripheral stimuli in both the ipsilateral and contralateral visual hemifields, indicative of larger receptive fields. We tentatively identify these subregions as the human homologues of macaque MT and MST, respectively. Putative human MT and MST were typically located on the posterior/ventral and anterior/dorsal banks of a dorsal/posterior limb of the inferior temporal sulcus, similar to their relative positions in the macaque superior temporal sulcus.
Keywords: area MT, area MST, area MT+, visual motion, direction-selectivity, retinotopy, homology
Functional imaging studies in humans have identified a cortical region with particularly strong responses to moving stimuli. This region, referred to variously as human MT+ or V5, is typically found on the lateral surface of the occipital lobe, often within a dorsal/posterior limb of the inferior temporal sulcus (ITS) (Zeki et al., 1991; Watson et al., 1993; Tootell et al., 1995; Dumoulin et al., 2000). On the basis of its sensitivity to moving stimuli, MT+ has been hypothesized to be homologous to motion-sensitive visual areas in the macaque dorsal superior temporal sulcus (STS). The case for this homology rests on the general location of MT+ with respect to other identified visual areas in both species, on its anatomical structure (Tootell and Taylor, 1995), on its heightened sensitivity to low-contrast moving stimuli relative to other visual areas (Tootell et al., 1995), and on evidence that direction-selective signals underlie MT+ activity (Heeger et al., 1999; Huk et al., 2001; Huk and Heeger, 2002). The present study assesses the retinotopic organization and receptive field sizes within human MT+, with the goal of subdividing it into distinct functional regions that may be identified as homologs of the macaque middle temporal (MT) and medial superior temporal (MST) visual areas.
The STS of the macaque monkey brain contains several areas that are selectively sensitive to visual motion. These include MT, the lateral and dorsal subdivisions of MST (MSTl and MSTd), and the floor or fundus of the STS (FST) (Allman and Kaas, 1971; Dubner and Zeki, 1971;Maunsell and Van Essen, 1983; Albright et al., 1984; Desimone and Ungerleider, 1986; Saito et al., 1986; Komatsu and Wurtz, 1988a). Most neurons in areas MT and MST are strongly direction-selective, and several lines of evidence suggest that these areas are important in processing neuronal signals related to visual motion (Zeki, 1974; Van Essen et al., 1981; Newsome et al., 1983; Albright et al., 1984;Movshon et al., 1986; Saito et al., 1986; Tanaka and Saito, 1989; Duffy and Wurtz, 1991b), and that activity in these areas is linked to the perception of motion (Dursteler and Wurtz, 1988; Newsome and Pare, 1988; Salzman et al., 1992; Celebrini and Newsome, 1995; Orban et al., 1995; Britten and van Wezel, 1998). Although contiguous, these areas are distinguishable based on anatomical location, functional properties, architecture, and connectivity (Van Essen et al., 1981;Saito et al., 1986; Ungerleider and Desimone, 1986; Komatsu and Wurtz, 1988a,b; Boussaoud et al., 1992).
The experiments described here aim to divide the human MT+ complex into regions that are homologous to the macaque STS motion areas MT and MST by exploiting two functional differences between these areas. First, MT has a distinguishable retinotopic map, whereas MST exhibits a much coarser retinotopic organization (Gattass and Gross, 1981; Albright and Desimone, 1987; Maunsell and Van Essen, 1987). Second, at a given visual eccentricity, MST neurons have much larger receptive fields than MT neurons. In particular, the receptive fields of MST neurons, but not MT neurons, often extend >10° into the ipsilateral hemifield (Desimone and Ungerleider, 1986; Albright and Desimone, 1987; Komatsu and Wurtz, 1988a; Tanaka and Saito, 1989; Duffy and Wurtz, 1991a).
Using stimuli designed to assess retinotopic organization and receptive field size, we were able to “double-dissociate” two distinct regions within human MT+. The first region exhibited strong response modulations to a rotating-wedge stimulus designed to measure retinotopic organization. This region often exhibited a systematic map of the angular component of the visual field but did not respond to peripheral ipsilateral stimulation. Conversely, the second region within MT+ did not demonstrate a strong response modulation to the rotating-wedge (retinotopy) stimulus but did respond to peripheral stimuli in both the ipsilateral and contralateral visual hemifields. We tentatively identify these two regions as the human homologs of macaque MT and MST, respectively. Some of these results have been presented previously in abstract form (Dougherty et al., 1999; Khan et al., 1999).
Although previous experiments have assessed ipsilateral responses within human MT+ (Tootell et al., 1998; Dukelow et al., 2001), and hence offer some evidence for large receptive fields within a region of MT+, our experiments are distinct in that they provide conclusive evidence for a double-dissociation of human MT and MST. A previous study of MT+ subdivision defined putative area MT as the part of MT+ that did not exhibit ipsilateral responses (Dukelow et al., 2001). Our experiments use two complementary measurements, one indicating relatively large receptive fields and the other indicating relatively small receptive fields. In addition to providing positive evidence for the existence of human MT as well as MST, our measurements revealed retinotopic organization in human MT that was similar to that previously documented in macaque MT (Gattass and Gross, 1981; Albright and Desimone, 1987; Maunsell and Van Essen, 1987), further strengthening the case for the homology between these cortical motion-processing structures in humans and macaques.
MATERIALS AND METHODS
Subjects
Five right-handed volunteers (four males, one female, aged 26–39) participated in the study. All subjects were experienced psychophysical observers, well practiced at maintaining fixation, and had participated previously in other functional magnetic resonance imaging (fMRI) studies. Consent was obtained and all procedures were in compliance with safety procedures for MR research. Each subject participated in five scanning sessions: one session to obtain high-resolution anatomical images of the brain, one to identify MT+ and to measure the angular component of the retinotopic map, two to measure contralateral versus ipsilateral responses (one for each visual hemifield), and one to measure the central versus peripheral representations of the retinotopic map. In all sessions, subjects were instructed to attend to the motion of the dots while maintaining fixation on a 0.5°, full-contrast fixation point.
Visual stimuli
Stimuli were presented on a flat-panel display (multisynch LCD 2000; NEC, Itasca, IL) placed in a Faraday box with an electrically conductive glass front, positioned near the subjects' feet. Subjects lay on their backs in the bore of the MR scanner and viewed the display through binoculars with a pair of angled mirrors attached just beyond the two objective lenses.
MT+ localizer stimulus
Area MT+ was functionally identified based on responses to stimuli that alternated in time between moving and stationary dot patterns (Fig. 1A), as per conventional methods (Zeki et al., 1991; Watson et al., 1993;Tootell et al., 1995). Moving dots traveled toward and away from fixation (8°/sec) within a 21° diameter circular aperture, alternating direction once per second (white dots on a black background; dot diameter of 0.25°). After 9 sec, the moving-dot field was replaced by 27 sec of a stationary-dot field. This moving/stationary cycle was repeated seven times in each fMRI scan. We used this uneven duty cycle (9 sec moving, 27 sec stationary = 25% duty cycle) to match the duty cycle of the retinotopy stimulus (described below). This MT+ localizer scan was repeated four to six times for each subject.
Fig. 1.

Stimuli. A, Moving versus stationary, localizing MT+. Area MT+ was identified based on responses to stimuli that alternated in time between moving (radially inward and outward from fixation, alternating direction every second, for 9 sec) and stationary (27 sec) dot patterns, while subjects fixated a small, high-contrast square in the center of the dot field. B, Retinotopy rotating wedge, identifying MT. The angular component of retinotopic organization was measured by having subjects fixate the center of a dot field with one-quarter of the field (a 90° wedge) containing moving dots. Every 2 sec, the wedge containing the moving dots rotated 20°, completing a full rotation every 36 sec.C, Ipsilateral stimulation, identifying MST. Responses to ipsilateral stimulation were assessed by presenting a peripheral dot patch in either the left or right visual field. The 15° diameter field of dots alternated between moving (18 sec) and stationary (18 sec), while subjects maintained fixation on a small, high-contrast square 10° from the nearest edge of the dot patch. D, Central versus peripheral visual field. The radial component of retinotopic organization was assessed by alternating moving dots within the central (4° outer radius) and peripheral (4° inner radius; 16.5° outer radius) parts of the visual field while subjects maintained central fixation.
Retinotopy stimulus
We measured the polar angle component of the retinotopic map within MT+ using a motion-defined wedge that rotated slowly through the visual field, about a central fixation point (Fig.1B). Similar to the MT+ localizer stimulus, the retinotopy stimulus was a 21° diameter circular aperture filled with white dots on a black background. At any given time, the dots within a 90° wedge of the aperture moved toward and away from fixation as in the MT+ localizer stimulus, but unlike the MT+ localizer, the rest of the dots were stationary. This motion-defined wedge rotated 20° every 2 sec, completing a full rotation every 36 sec. Thus, the 21° diameter circular aperture was always filled with dots: dots falling within the current position of the wedge moved inward/outward from fixation, dots falling outside the wedge were stationary. Each part of the visual field contained moving dots for 25% of the time, matching the duty cycle of the MT+ localizer described above. During each scan, the moving-dot wedge completed seven cycles of rotation while the subject held fixation in the center of the screen. This retinotopy scan was repeated the same number of times as the MT+ localizer scans (four to six times) for each subject, in the same scanning session as the MT+ localizer.
The rotating-wedge stimulus evokes a traveling wave of activity in retinotopically organized visual areas; similar contrast- and flicker-defined wedges are used routinely to identify the earlier retinotopic areas including V1, V2, V3, V3A, V3B, V7, and V4v (Engel et al., 1994; Sereno et al., 1995; DeYoe et al., 1996; Engel et al., 1997;Press et al., 2001). Because the wedge rotates through the angular component of the visual field, the temporal phase of the fMRI signal corresponds to the cortical representation of angular position. One can also interpret the amplitude of the fMRI response to this rotating-wedge stimulus as an indirect measurement of receptive field size. A neuron with a relatively small receptive field would be stimulated by the wedge only during a part of each rotation. A neuron with a larger receptive field, in contrast, would be stimulated through most of the cycle of the wedge. Thus, the rotating wedge would elicit a strong modulation of neuronal activity in visual area MT, which contains neurons with relatively small receptive fields, but a weak modulation of activity in visual area MST, which contains neurons with relatively large receptive fields.
Ipsilateral stimulus
Ipsilateral stimulation is a complementary test to distinguish MST from MT. We tested for ipsilateral responses using stimuli restricted to either the left or right hemifield. The stimuli alternated every 18 sec between a field of moving dots and a similar field of static dots for seven cycles (Fig. 1C). The dots were restricted to a peripheral circular aperture (15° diameter) with its closest edge 10° from fixation. These peripheral moving stimuli would be expected to evoke neuronal activity in the contralateral hemisphere in both macaque MT and MST, but they would be expected to evoke activity in the ipsilateral hemisphere only in MST, where the receptive fields are large enough to extend into the ipsilateral hemifield. The ipsilateral scans were repeated 6–12 times in each hemifield for each subject.
Central versus peripheral stimulus
We also assessed the cortical representations of the central and peripheral visual field by presenting moving dots alternately in the center and periphery (Fig. 1D). The stimulus was a 33° diameter circular field of white dots on a black background. Dots were stationary except for a region of moving dots that alternated every 18 sec between a central disc (4° radius) and a peripheral annulus (4° inner radius; 16.5° outer radius). This central/peripheral cycle was repeated seven times in each fMRI scan. This center–periphery scan was repeated 8–12 times for each subject.
fMRI methods
fMRI data acquisition. MR imaging was performed using a 3 tesla MRI scanner (General Electric, Fairfield, CT) with a custom-designed dual surface coil (Nova Medical, Inc., Wakefield, MA). Subjects viewed the stimuli while 14 fMRI slices were acquired at 2 sec intervals using a T2*-sensitive, spiral-trajectory, gradient-echo pulse sequence (Glover and Lai, 1998; Glover, 1999). For our particular scanner hardware, spiral fMRI pulse sequences compare favorably with echo-planar imaging in terms of sensitivity and spatial and temporal sampling resolution (Sawyer-Glover and Glover, 1998). Pulse sequence parameters were: 1000 msec repetition time (TR), 40 msec echo time (TE), 55° flip angle, two interleaves, inplane voxel size of 2 × 2 mm, slice thickness of 3 mm, and 14 slices oriented parallel to the calcarine sulcus with the lowest slice near the ventral surface of the occipital lobe.
To minimize head movements, the subject's head was stabilized with a bite bar. The time series of images from each scan were visually inspected for head movements. No post hoc motion correction was applied, because there was no indication of head movements in any of the scans.
Each MR scanning session began by acquiring a set of T1-weighted anatomical images using the same slice prescription as the functional images (spoiled gradient-recalled acquisition in the steady state; field of view, 220 mm; TR, 68 msec; TE, 15 msec; echo-train length, 2). The inplane anatomical images were aligned to a high-resolution anatomical volume of each subject's brain so that all MR images (across multiple scanning sessions) from a given subject were coregistered with an accuracy of ∼1 mm (Nestares and Heeger, 2000). The high-resolution anatomical images were also used to restrict the functional data analyses to gray-matter voxels and to create flattened visualizations of cortex (see below).
fMRI data analysis. Data from the first cycle (36 sec) of each fMRI scan were discarded to avoid transient effects of magnetic saturation and to allow the hemodynamics to reach steady state (noting that the full duration of the hemodynamic impulse response is well over 20 sec). During the remaining six cycles of each scan, 108 functional images (one every 2 sec) were recorded for each slice. For each voxel, the image intensity changed over time and comprised a time series of data. The fMRI time series were preprocessed by: (1) high-pass filtering the time series at each voxel to compensate for the slow signal drift typical in fMRI signals (Smith et al., 1999), (2) dividing the time series of each voxel by its mean intensity to convert the data from arbitrary image intensity units to units of percentage signal modulation and to compensate for the decrease in mean image intensity with distance from the surface coil, and (3) averaging the time series of each voxel across repeated scans of the same stimulus condition.
The resulting mean time series were analyzed to locate gray-matter regions that responded strongly to the periodic changes in the stimuli. We fit a (36 sec period) sinusoid to the time series at each voxel and computed: (1) the correlation between the time series at each voxel and the corresponding best-fitting sinusoid and (2) the phase of the best-fitting sinusoid at each voxel. The correlation measures signal to noise (Engel et al., 1997), taking a value near 1 when the fMRI signal modulation at the stimulus-alternation period (36 sec) is large relative to the noise (at the other frequency components) and a value near 0 when there is no signal modulation or when the signal is small compared with the noise. The phase measures the temporal delay of the fMRI signal relative to the beginning of the stimulus cycle. For the rotating-wedge retinotopy stimulus, the phase corresponds to angular position in the visual field. For the central versus peripheral stimulus, the phase corresponds to eccentricity in the visual field.
To better visualize the results, we rendered the fMRI data on a computationally flattened representation (“flat map”) of relevant regions of each subject's brain (Fig.2A). We segmented the gray- and white-matter voxels in the high-resolution anatomical images using a Bayesian classification algorithm (Teo et al., 1997) and then performed manual refinements of the segmentation in the anatomical area of interest to preserve the topography of the fMRI responses as accurately as possible. Specifically, we inspected the lateral occipital lobe and ensured that: (1) the tissue identified as gray matter extended completely into the fundus of each sulcus (to be sure that responses from voxels in the deepest part of the sulcus were not missed) and (2) gray matter on opposite banks of each sulcus did not touch (to avoid mixing the responses from opposite sides of the sulcus). The gray matter in the vicinity of MT+ was computationally flattened using an algorithm designed to preserve distances within the folded gray-matter surface (Wandell et al., 2000). Because the data from all fMRI scans of a given subject were coregistered with the high-resolution anatomical images of that subject's brain, all of that subject's data could be superimposed on a common flat map.
Fig. 2.
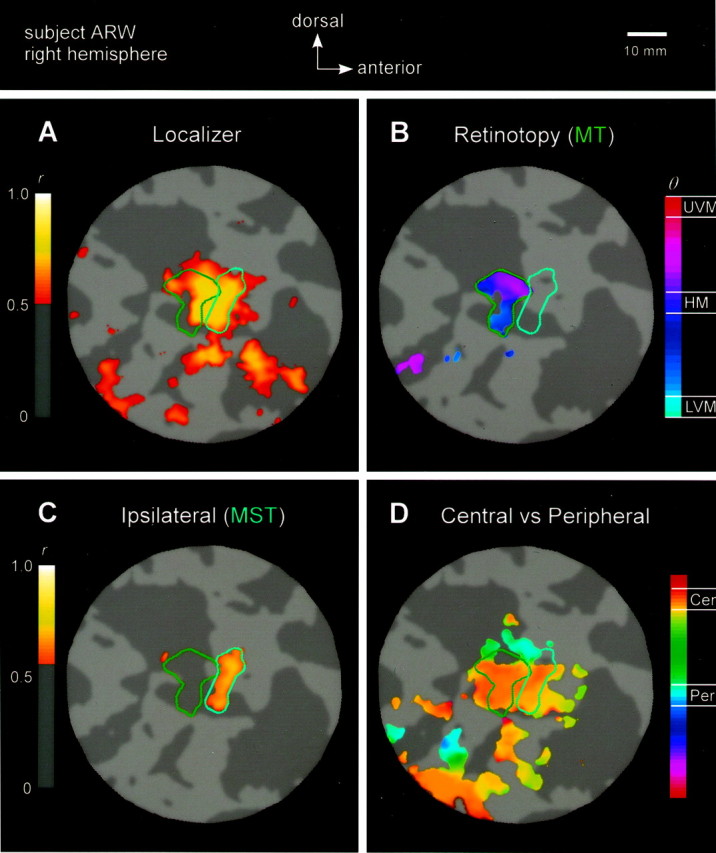
MT+ subdivision and retinotopy for subject A.R.W. (right hemisphere). A–D show fMRI responses on a 35-mm-radius flat map, centered within the fundus of the occipital continuation of the ITS. Green and cyanoutlines indicate areas MT and MST. A, Response to MT+ localizer. A strong response is evident throughout MT+.Colors correspond to correlation values above threshold (r > 0.50). B, Response to retinotopy stimulus. The posterior subregion (MT) responded strongly to the rotating-wedge stimulus (green outline).Colors correspond to angular position in the visual field, given that responses are above the correlation threshold (r > 0.50). Note the smooth progression of phases from posterior–ventral to anterior–dorsal (cyan/blue, lower-left quadrant of visual field;magenta/red, upper-left quadrant). Responses corresponding to the ipsilateral visual field (which would be coloredgreen-yellow-orange) were not observed at this correlation threshold, and thus are not evident on the flat map and have not been depicted in the color bar.C, Response to ipsilateral stimulus. The distinct, anterior subregion (MST) responded to ipsilateral stimulation (cyan outline). Colors correspond to correlation values above threshold (r > 0.60). D, Response to central versus peripheral stimulus. The ventral base of MT+ responded strongly to central stimulation, whereas the periphery was represented more dorsally. Colors correspond to the timing of response (phase), which corresponds to eccentric position (i.e., orange, central; blue, peripheral) in the visual field, given that responses are above the correlation threshold (r > 0.35). Representation of visual field eccentricity is indicated as central (Cen) or peripheral (Per). Scale bar, 10 mm.
RESULTS
The subdivision of MT+ for one subject is shown on the flat maps in Figure 2. The subdivisions for all subjects are shown in Figures 3 and4. Area MT is indicated by the green boundaries drawn on the flat maps. The adjacent cyan boundaries indicate area MST. The colored pixels in Figures 2-4 correspond to gray-matter locations where the responses were particularly strong (i.e., exceeding a correlation threshold) (see Materials and Methods, fMRI data analysis). By varying the correlation thresholds and visually inspecting the data on the flat maps, we confirmed that our identifications of MT and MST did not depend strongly on the particular values of the correlation threshold used to generate Figures 2-4.
Fig. 3.
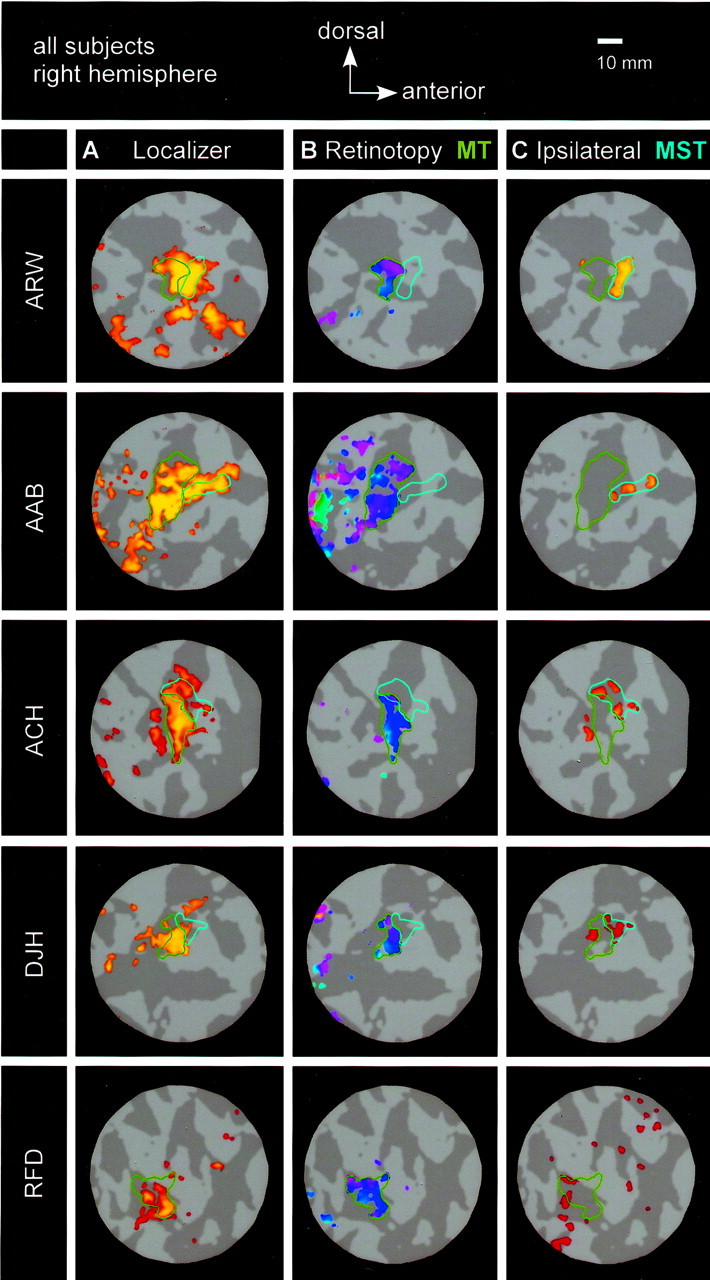
MT+ subdivision and retinotopy for all five subjects (right hemisphere). A–C, Responses to MT+ localizer, retinotopy, and ipsilateral stimuli, respectively (in the same format as Fig. 2A–C). MT is evident in all subjects, and MST is evident in all subjects except R.F.D. Correlation thresholds for localizer and retinotopy scans were as follows: A.R.W., 0.50; A.A.B., 0.52; A.C.H., 0.43; D.J.H., 0.55; and R.F.D., 0.42. Correlation thresholds for ipsilateral scans were as follows: A.R.W., 0.60; A.A.B., 0.65; A.C.H., 0.47; D.J.H., 0.36; and R.F.D., 0.29. Exact values of correlation thresholds were chosen for display; other correlation thresholds yielded similar results.
Fig. 4.

MT+ subdivision and retinotopy for all five subjects (left hemisphere). Format is the same as in Figure 3. MT is evident in all subjects, and MST is evident in all subjects except R.F.D. Correlation thresholds for localizer and retinotopy scans were as follows: A.R.W., 0.62; A.A.B., 0.51; A.C.H., 0.46; D.J.H., 0.62; and R.F.D., 0.23. Correlation thresholds for ipsilateral scans were as follows: A.R.W., 0.61; A.A.B., 0.54; A.C.H., 0.56; D.J.H., 0.64; and R.F.D., 0.40.
Identifying MT+
MT+ was identified, separately for each subject, based on a combination of anatomical and functional criteria. Specifically, a contiguous region was marked by hand to include voxels on the lateral surface of the occipital lobe, where the fMRI time series correlated strongly with the moving/stationary stimulus alternations (r > ∼0.5, chosen separately for each subject). Figure 2A shows a flat-map representation of MT+ localizer responses in one hemisphere.
MT+ was similarly localized bilaterally in all hemispheres of all subjects (Figs. 3A, 4A). Its location was anterior to and distinct from the retinotopically defined areas V1, V2, V3, V3A, and V4v, whose locations had been identified previously in all subjects. It fell mostly or entirely within a single sulcus. We occasionally noticed (three hemispheres) a swath of activity slightly posterior and/or ventral to MT+ on the flat maps. Despite its close proximity to MT+, we excluded this patch of activity from MT+ for two reasons. First, this activity was often found in a different sulcus (or sulci), with MT+ clearly on the other side of an intervening gyrus [a fact somewhat obscured on the flat-map representation but more evident when the data are viewed in sagittal slices of the three-dimensional (3D) brain volume]. Second, the application of a high correlation threshold (higher than that used in the figures) to the MT+ localizer responses revealed a clear distinction between MT+ and this posterior–ventral activity. In fact, the MT+ localizer stimulus elicited activity throughout much of the occipital lobe; the responses were simply stronger (i.e., withstanding a higher correlation threshold) in MT+.
Identifying MT: angular component of retinotopy
Area MT was defined, separately for each subject, to include a contiguous subregion of MT+ that exhibited strong response modulations during the retinotopy scans. The same correlation threshold was applied to the MT+ localizer (Fig. 2A) and the retinotopy data (Fig. 2B). Because we collected equal numbers of repeats of both of these conditions, and because the duty cycles of both of these stimuli were the same (see Materials and Methods, visual stimuli), applying the same correlation threshold allowed for a fair comparison of the spatial extent of the responses to these two stimulus conditions.
A retinotopic subregion of MT+ is clearly visible in Figure2B and is marked by the green curve drawn on the flat map. The fact that this subregion of MT+ responded strongly to the rotating-wedge stimulus suggests that neurons within this area have relatively small receptive fields. In addition, the phase map varies smoothly from magenta/red (upper-left quadrant of visual field) through purple [horizontal meridian (HM)] through blue/cyan (lower-left quadrant), suggesting orderly retinotopic organization.
Area MT was discernable based on strong responses to the rotating-wedge stimulus in both hemispheres of all subjects (Figs.3B, 4B). We were also able to discern a qualitatively clear and orderly retinotopic phase map in 5 of the 10 hemispheres. In all hemispheres for which the angular retinotopic map was easily discernable, the representation of the upper vertical meridian (UVM) was anterior to the representation of the lower vertical meridian (LVM). Even when the retinotopic map within the area did not include a smooth progression of phases, we chose to define the area whenever there was a contiguous subregion of MT+ that responded strongly to the rotating-wedge stimulus. A strong response to the rotating-wedge stimulus implies that neurons within each fMRI voxel had relatively small receptive fields at the same or nearby locations in the visual field. Thus, even when visual inspection did not reveal an orderly retinotopic phase map, the presence of a strong response modulation provided evidence of relatively small receptive fields and local retinotopic organization.
Identifying MST: ipsilateral stimulation
Area MST was defined, separately for each subject, to include a contiguous subregion of MT+, distinct from retinotopically defined MT, that responded strongly to peripheral, ipsilateral stimulation. Figure 2C shows the ipsilateral responses in the right hemisphere of one subject. Although ipsilateral responses were relatively weak compared with contralateral responses, a subregion of ipsilateral activity was clearly identifiable, marked by the cyan curve drawn on the flat map. This same subregion did not respond strongly to the retinotopy stimulus; this double dissociation is evident by contrasting Figure 2B,C.
Area MST, as defined by the dual criteria of a response to ipsilateral stimulation and lack of a strong response modulation to the retinotopy stimulus, was evident in both hemispheres of four of the five subjects (Figs. 3C, 4C). In defining MST, we first noted the subregion of MT+ that did not exhibit a strong modulation of response to the retinotopy stimulus and then defined area MST as a nonretinotopic region that did respond strongly to the ipsilateral stimulus. Furthermore, we chose to identify MST only if a strong ipsilateral response was not also present in the retinotopic region. We note that these conservative criteria sometimes left some parts of MT+ unclassified (neither MT nor MST). MST, in the eight hemispheres in which it was identified, was always anterior and often dorsal to MT, although there was some degree of variability across subjects. In these eight hemispheres, MST typically abutted MT; when some degree of separation was apparent, the areas were still within ∼5 mm of one another along the gray-matter surface.
However, in the remaining subject (R.F.D., left and right hemispheres) we did not observe a clear double dissociation between two subregions of MT+. Although we were able to identify a retinotopic MT subregion in both hemispheres of this subject, responses to ipsilateral stimulation were either too weak or too diffuse to confidently identify a distinct MST region. Ipsilateral responses in both hemispheres of this subject were notably weaker than those observed in the other subjects. Also, in both hemispheres of this subject, the anatomical location of MT+ was less distinct and did not fall primarily within a single sulcus, as it did in most subjects. Because the local cortical anatomy of this region is quite variable across individuals (Watson et al., 1993; Tootell et al., 1995; Dumoulin et al., 2000), our sample is too small to determine where subject R.F.D.'s organization lies with respect to the normal range. Critically, the failure to identify MST in this subject demonstrates that our procedure (first identifying a retinotopic subregion and then looking for a distinct subregion that responded to ipsilateral stimuli) did not logically guarantee that we would observe the desired double dissociation.
Central and peripheral retinotopic representations
We also measured the cortical representations of the central and peripheral portions of the visual field by alternating moving dots within central (4° outer radius) and peripheral (4° inner radius; 16.5° outer radius) parts of the visual field. The response to the central versus peripheral stimulus for one subject is shown in Figure2D. A large central representation is evident in the ventral portions of both MT and MST, and a smaller peripheral representation is evident in the more dorsal portions, particularly within area MT.
The subregion of MT corresponding to the central representation of the visual field typically (in 8 of 10 hemispheres) covered the ventral (and sometimes posterior) extreme of MT. Responses to peripheral stimulation were typically found at the dorsal and/or anterior borders of MT, although responses to the peripheral stimulus covered much less cortical area than responses to the central stimulus. Responses in this experiment were rather noisy, particularly in MST, consistent with larger receptive fields that might be expected to cover both the central and peripheral stimuli. Despite the noise, we did observe a clear response to the central stimulus in MST in five of the eight hemispheres in which we were able to identify MST. The representation of the central part of the visual field in both regions provides additional evidence that MST reflects a distinct cortical area and not simply the peripheral retinotopic representation of a single, larger area.
Position and size of MT+ subregions
To better evaluate the relative positions of these areas in the 3D cortical volume, we transformed the regions corresponding to MT and MST from the flat map to the corresponding gray matter in the high-resolution anatomy images of each subject's brain. In all of the eight hemispheres in which we were able to define both MT and MST, we observed that MT fell primarily on the posterior (-ventral) bank of a sulcus, whereas MST fell on an anterior (-dorsal) bank. This sulcus could usually be identified as a dorsal/posterior limb of the ITS (Dumoulin et al., 2000). Although this dorsal/posterior continuation of the ITS was the clearest anatomical landmark, we also observed that MT+ sometimes continued posteriorly into the lateral occipital sulcus and/or onto the lateral occipital gyrus.
Viewing the fMRI responses in the high-resolution volume anatomy also reveals the relative positions of MT and MST and confirms that the geometrical distortion inherent in transforming the functional data to the flat maps did not introduce any systematic artifacts. Figure5A shows the responses to the MT+ localizer, the retinotopy stimulus, and the ipsilateral stimulus on an axial slice in one subject. In the left panel, a strong response to the MT+ localizer is evident on both sides of the sulcus (the center of the sulcus is indicated by the arrow). In the center panel, a strong response to the retinotopy stimulus is evident only on the posterior bank of the sulcus. Conversely, in the right panel, the region responding to ipsilateral stimulation lies on the anterior bank of the sulcus. Similar organization is evident in Figure 5B,C, which shows coronal and sagittal slices, respectively, in two additional subjects.
Fig. 5.

Spatial separation of retinotopy and ipsilateral responses in the cortical volume. A, fMRI responses shown in axial slices through the cortical volume (subject A.R.W., right hemisphere). The arrow indicates the center of the sulcus. Note that localizer responses (MT+) fall on both sides of the sulcus (left panel), retinotopy responses (MT) fall primarily on the posterior bank (middle panel), and ipsilateral responses (MST) are primarily restricted to the anterior bank (right panel).B, Coronal slices (subject A.A.B., left hemisphere, same format as in A). C, Sagittal slices (subject D.J.H., left hemisphere, same format as in A).A, Anterior; L, lateral;D, dorsal; M, medial; P, posterior.
Table 1 reports the gray-matter surface area for MT, MST, and MT+. On average, MT subsumed ∼243 mm2 and MST subsumed ∼83 mm2. Sizes for MST are likely to be underestimates, because of the conservative criteria used in defining this area (see Results, Identifying MST: ipsilateral stimulation). Size can also be estimated by visual inspection of the figures, because all flat maps had a 35 mm radius. Postmortem anatomical studies in a similar part of human cortex have identified a region of dense myelination, believed to correspond to MT, covering ∼200 mm2 (Tootell and Taylor, 1995).
Table 1.
Visual area sizes
| Subject | Right hemisphere | Left hemisphere | ||||
|---|---|---|---|---|---|---|
| MT | MST | MT+ | MT | MST | MT+ | |
| A.A.B. | 320 | 82 | 595 | 185 | 108 | 426 |
| A.C.H. | 169 | 130 | 642 | 396 | 90 | 775 |
| A.R.W. | 112 | 76 | 392 | 196 | 25 | 263 |
| D.J.H. | 93 | 57 | 289 | 236 | 95 | 493 |
| R.F.D. | 167 | n/a | 893 | 555 | n/a | 781 |
| Mean | 172 | 86 | 562 | 314 | 80 | 548 |
| SD | 89 | 31 | 235 | 159 | 37 | 226 |
Surface area (mm2) of areas MT, MST, and MT+ in both hemispheres for all subjects.
DISCUSSION
Human area MT+ can be functionally subdivided into two distinct areas that we tentatively identify as MT and MST. The retinotopic organization of area MT can be measured using a rotating-wedge stimulus, and this area responds primarily to stimuli in the contralateral visual hemifield. Area MST does not exhibit clear retinotopic organization but does respond to peripheral (>10° from the vertical meridian) ipsilateral stimulation. Figure6 shows representative locations of areas MT and MST in the cortical volume and schematizes our proposed organization of MT+ on a flat map. Table2 summarizes our results in each of the 10 hemispheres studied.
Fig. 6.
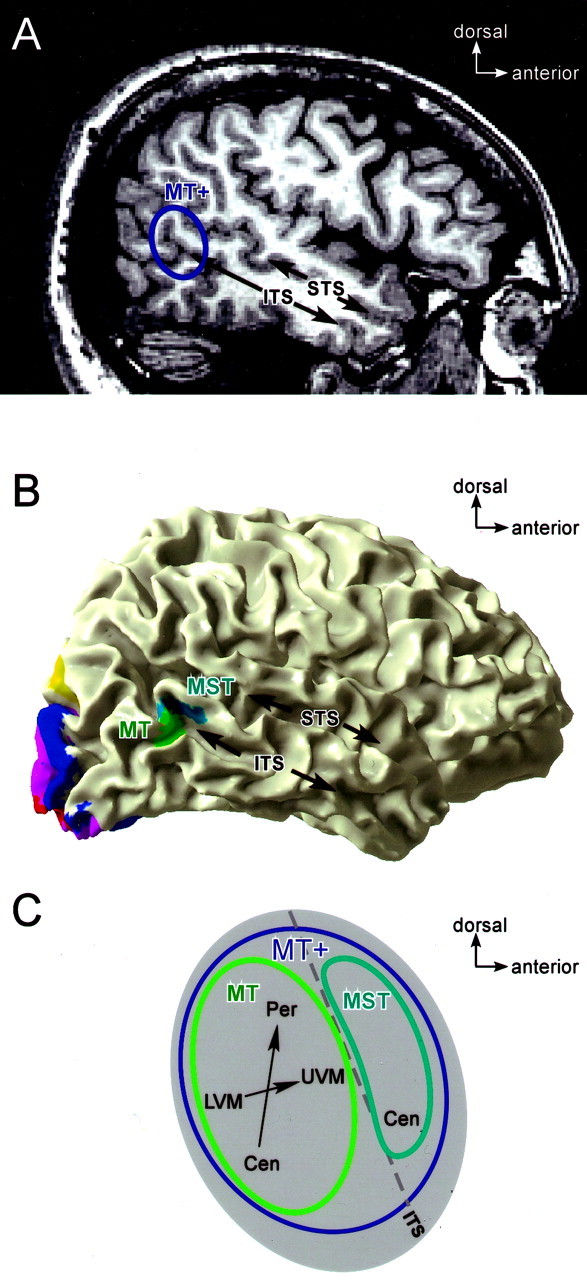
Proposed location of MT and MST in sagittal, 3D, and flattened views. A, Position of MT+ shown on a sagittal slice through the cortical volume. MT+ is indicated by ablue outline in the ascending occipital continuation of the ITS. The STS is indicated for reference. B, Position of MT and MST, viewed on a 3D cortical reconstruction, for subject A.A.B. (left hemisphere). MT (green) falls on the posterior bank of the occipital continuation of the ITS, whereas MST (cyan) falls on the anterior bank. The STS is indicated for reference. Other visual areas are shown for reference: V1,red; V2, magenta; V3,blue; V3a/b, yellow. The image is reversed left to right to parallel A andC. C, Flat-map schematic of MT and MST. MT+ is outlined in blue, MT is outlined ingreen, and MST is outlined in cyan. Axes drawn within MT schematize the retinotopic organization observed, with more posterior/ventral portions representing the lower visual field (LVM) and more anterior/dorsal transition representing the upper visual field (UVM). Representation of visual field eccentricity is indicated as central (Cen) or peripheral (Per). Thedashed line indicates the fundus of a dorsal/posterior limb of the ITS.
Table 2.
Summary of MT+ subdivision results
| Subject | Hem | Ret | Ipsi | Angle | CvP | ITS | PvA |
|---|---|---|---|---|---|---|---|
| A.A.B. | R | + | + | − | + | + | + |
| L | + | + | − | +? | + | + | |
| A.C.H. | R | + | + | + | + | +? | + |
| L | + | + | − | + | + | + | |
| A.R.W. | R | + | + | + | + | + | + |
| L | + | + | + | + | + | + | |
| D.J.H. | R | + | + | + | + | + | + |
| L | + | + | + | + | + | + | |
| R.F.D. | R | + | − | − | +? | +? | |
| L | + | − | − | + | +? | ||
| Total | 10/10 | 8/10 | 5/10 | 8/10 | 7/10 | 8/8 | |
Assessment of MT+ subdivision for all subjects. Hem, Hemisphere (R, right; L, left); Ret, distinct retinotopic subregion (putative human MT); Ipsi, distinct ipsilaterally responsive subregion (putative human MST); Angle, clear phase map evident, indicating an orderly retinotopic map of the angular component of the visual field; CvP, central visual field represented ventral and/or posterior to peripheral representation; ITS, MT+ fell primarily within a dorsal/posterior limb of inferior temporal sulcus; PvA, MT was located posterior and/or ventral to MST. + indicates clear presence; +? indicates equivocal evidence; − indicates no clear evidence; blank fields in the PvA column could not be evaluated for two hemispheres because of failure to identify MST in subject R.F.D.
Inferences about neuronal receptive field sizes
We interpret the retinotopy and the ipsilateral measurements as evidence that receptive fields are larger in MST than MT. MT responses modulated strongly to the rotating-wedge stimulus but were weak or absent to stimuli presented at least 10° into the ipsilateral visual field, implying relatively small receptive fields. MST responded to the ipsilateral stimulus but exhibited weak or absent response modulations to the retinotopy stimulus, implying larger receptive fields.
Our measurements of ipsilateral responses are in general agreement with those of Tootell et al. (1998), who measured activity in human visual cortex to ipsilateral stimulation and reported ipsilateral responses in a broad region of extrastriate visual cortex including MT+. However, Tootell et al. (1998) excluded only the central 0.5° of the visual field, in contrast to our exclusion of the central 10° of the visual field. Given that monkey MT neurons representing the fovea have receptive fields several degrees in diameter and that many of them cross into the ipsilateral visual field, it is likely that their stimuli, unlike ours, would have evoked activity in both monkey MT and MST. Thus, our results are consistent with those of Tootell et al. (1998), but our use of farther-peripheral stimuli permit more reliable inferences concerning the relative receptive field sizes within MT+.
Our results are also in agreement with those of Dukelow et al. (2001), who reported ipsilateral responses in the anterior portion of MT+. Our results extend their observations by demonstrating that the more posterior region in MT+ (which did not exhibit ipsilateral responses) often exhibits clear retinotopic maps. In addition, Dukelow et al. (2001) only presented data from the right hemispheres of subjects (because of their use of a specialized head coil). We acquired fMRI responses from both hemispheres and confirmed that the organization of human MT and MST is similar in the two hemispheres.
Inferences about retinotopic organization
Our results suggest that a subregion of MT+ exhibits retinotopic organization that can be assessed using fMRI. We observed a strong response to the rotating-wedge retinotopy stimulus in all hemispheres. Furthermore, in five hemispheres we observed a smooth map of the visual field, with the LVM represented more ventral and/or posterior and the UVM represented more dorsal and/or anterior.
We believe that the lack of a clear retinotopic map in some hemispheres may reflect methodological failures. The cortical surface in the vicinity of MT+ is one of the most highly gyrified areas of the human cortex (Zilles et al., 1989; Dumoulin et al., 2000). Consequently, fMRI measurements in this region may sometimes be blurred across opposite sides of a sulcus, mixing responses from the posterior bank (putative MT) and the anterior bank (putative MST). Precise segmentation and unfolding of the gray matter in this convoluted part of the cortex is difficult, which could introduce additional errors. In particular, we noted that manually refining the gray-matter segmentation in this region often yielded clearer retinotopic maps (see Materials and Methods), suggesting that at least some of the variability in our data could result from these technical difficulties. We also note that the retinotopically organized area that we have identified as MT is approximately an order of magnitude smaller than V1 (∼240 vs ∼2400 mm2), and corresponded to only ∼5 × 12 fMRI voxels. In light of the relatively small size of this area, the ability to discern any retinotopic organization is notable.
In addition to these technical issues, electrophysiological measurements in the macaque have revealed that the MT retinotopic map is not as orderly as in earlier visual areas like V1. Maunsell and Van Essen (1987) observed that: (1) the lower visual field was often over-represented in comparison with the upper visual field; (2) the angular component exhibited local discontinuities; (3) the same angular position could be represented in multiple distinct regions; and (4) retinotopic maps were variable across hemispheres. Given this variability and local representational disarray observed in macaque MT, one might not expect to observe an orderly retinotopic map in every human MT.
Maps of visual field eccentricity in the macaque yield a clearer picture, with more lateral/ventral neurons exhibiting central receptive fields and more medial/dorsal neurons exhibiting more peripheral receptive fields. We observed a similar organization in the responses to our central versus peripheral stimuli, with the response to central stimulation often lying at the ventral edge of MT or lying ventral to a region exhibiting a clear peripheral response.
The maps of visual field angle that we observed were consistent and reproducible within subjects. We observed similar retinotopic subregions in subjects A.R.W., A.C.H., and R.F.D. in scanning sessions performed >1 year before the data reported in this paper (Dougherty et al., 1999). The locations, orientations, sizes, and shapes of the retinotopic regions were similar within subjects across the two data sets, and in the hemispheres in which the retinotopic map was most orderly in both of the data sets (A.R.W., right and left), the precise organization of the angular map was also found to be in close correspondence. In these preliminary sessions, we used a conventional retinotopic mapping stimulus, a flickering checkerboard wedge, instead of the motion-defined wedge used in this study. The similarity of the maps we observed when using such different stimuli also demonstrates the robustness of the MT retinotopic maps we identified.
Possible homologies between human and macaque motion-sensitive areas
Our results are consistent with the existence of areas MT and MST in the human that are homologous to those in the macaque. This homology is supported by three main observations. First, macaque MT and MST are adjacent to one another, with MST lying anterior to MT on the opposite bank of the dorsal STS. We found human MT and MST to be immediately adjacent in seven of the eight hemispheres in which we confidently identified both areas. MT and MST typically lay on opposite sides of the same sulcus (the ITS), with MST anterior and/or dorsal to MT. Second, macaque MT exhibits a clearer retinotopic organization than macaque MST. In human MT, we observed clear maps of the angular component of the visual in field in 5 of 10 hemispheres, and we observed evidence for a distinction between central and peripheral parts of the visual field in 7 of 10 hemispheres. Third, neurons in macaque MST have larger receptive fields than corresponding neurons in MT representing the same eccentricity. We inferred that human MST has larger receptive fields than MT, based on responses to the rotating wedge (retinotopy) and ipsilateral stimuli.
Although our data are consistent with a proposed homology between human and macaque MT and MST, they are not conclusive. There are four adjacent, motion-sensitive areas in macaque STS (MT, MSTl, MSTd, and FST), whereas our measurements discerned only two areas within human MT+. We chose to concentrate on distinguishing two regions based on differences in retinotopy and receptive field size, because electrophysiologists often use receptive field size as a rule of thumb to distinguish macaque MT and MST. In addition, fMRI measurements of retinotopic organization are well established as a technique for subdividing larger regions of visual cortex (Engel et al., 1994, 1997;Sereno et al., 1995; DeYoe et al., 1996), including dorsal motion-responsive regions V3A, V3B, and V7 (Tootell et al., 1997; Smith et al., 1998; Press et al., 2001; Tootell and Hadjikhani, 2001).
Additional measurements of function within the macaque STS and the human ITS will shed further light on the proposed homologies between the monkey and human motion-sensitive areas. For example, most neurons in macaque MT respond only according to the local direction of translation of a moving stimulus (Dubner and Zeki, 1971; Maunsell and Van Essen, 1983; Albright, 1984), whereas many neurons in macaque MST also exhibit selectivity for particular components of optic flow (e.g., expansion/contraction or rotation) (Saito et al., 1986; Duffy and Wurtz, 1991b). In a human fMRI experiment, Morrone et al. (2000)compared MT+ responses to translation, expansion/contraction, and rotation. They observed stronger responses to translation in a dorsal and/or posterior portion of MT+ and stronger responses to expansion/contraction and rotation in a ventral and/or anterior part (although in two subjects this layout was reversed). However, their results do not appear to clearly align with the areas that we have identified as MT and MST.
In addition, neurons in macaque MST, but not in macaque MT, receive extraretinal eye movement signals, so that some MST neurons respond during smooth-pursuit eye movements in the absence of retinal motion (Newsome et al., 1988). Dukelow et al. (2001) reported activity in the most anterior portion of human MT+ when subjects performed “nonvisual” pursuit of a self-generated somatosensory target (their own finger moving back and forth) in darkness, and suggested that this region corresponded to the human homolog of MSTl. However, it is not known whether self-guided pursuit is mediated by the same cortical mechanisms that control normal pursuit eye movements.
The visual response properties of neurons in macaque FST have not been well studied. FST neurons are typically thought to exhibit weak and erratic visual responses (Komatsu and Wurtz, 1988a), although one study did observe direction-selective responses in some FST neurons (Erickson and Dow, 1989). If a human homolog of FST exists, it is unclear as to whether this region would respond strongly enough to visual motion to fall within our original definition of MT+. fMRI measurements in monkeys (Dubowitz et al., 1998; Stefanacci et al., 1998; Disbrow et al., 1999; Logothetis et al., 1999, 2001) could provide a standard against which to evaluate the measurements from human brains to further test the proposed homologies.
Another possibility, of course, is that not all of the macaque motion-sensitive areas are preserved in humans. For example, in the owl monkey, homologs to macaque MST and FST have not been unambiguously defined (Rosa et al., 1993). Regardless, because the subregions we identified exhibit differences in retinotopic organization and receptive field sizes, it would be prudent to analyze data from future fMRI experiments separately for each of these subregions rather than treating them as one larger area.
Footnotes
This research was supported by National Eye Institute Grant R01-EY12741. We thank W. Newsome, K. Britten, and B. Wandell for many helpful comments throughout the course of this work and A. Wade for software used for gray-matter segmentation and flattening (available athttp://white.stanford.edu/∼brian/mri/segmentunfold.htm).
Correspondence should be addressed to Alexander C. Huk at his present address: Department of Physiology and Biophysics, University of Washington, Box 357290, Health Sciences Building Room G-424, Seattle, WA 98195-7290. E-mail: huk@u.washington.edu.
REFERENCES
- 1.Albright TD. Direction and orientation selectivity of neurons in visual area MT of the macaque. J Neurophysiol. 1984;52:1106–1130. doi: 10.1152/jn.1984.52.6.1106. [DOI] [PubMed] [Google Scholar]
- 2.Albright TD, Desimone R. Local precision of visuotopic organization in the middle temporal area (MT) of the macaque. Exp Brain Res. 1987;65:582–592. doi: 10.1007/BF00235981. [DOI] [PubMed] [Google Scholar]
- 3.Albright TD, Desimone R, Gross CG. Columnar organization of directionally selective cells in visual area MT of the macaque. J Neurophysiol. 1984;51:16–31. doi: 10.1152/jn.1984.51.1.16. [DOI] [PubMed] [Google Scholar]
- 4.Allman JM, Kaas JH. A representation of the visual field in the caudal third of the middle temporal gyrus of the owl monkey (Aotus trivirgatus). Brain Res. 1971;31:85–105. doi: 10.1016/0006-8993(71)90635-4. [DOI] [PubMed] [Google Scholar]
- 5.Boussaoud D, Desimone R, Ungerleider LG. Subcortical connections of visual areas MST and FST in macaques. Vis Neurosci. 1992;9:291–302. doi: 10.1017/s0952523800010701. [DOI] [PubMed] [Google Scholar]
- 6.Britten KH, van Wezel RJ. Electrical microstimulation of cortical area MST biases heading perception in monkeys. Nat Neurosci. 1998;1:59–63. doi: 10.1038/259. [DOI] [PubMed] [Google Scholar]
- 7.Celebrini S, Newsome WT. Microstimulation of extrastriate area MST influences performance on a direction discrimination task. J Neurophysiol. 1995;73:437–448. doi: 10.1152/jn.1995.73.2.437. [DOI] [PubMed] [Google Scholar]
- 8.Desimone R, Ungerleider LG. Multiple visual areas in the caudal superior temporal sulcus of the macaque. J Comp Neurol. 1986;248:164–189. doi: 10.1002/cne.902480203. [DOI] [PubMed] [Google Scholar]
- 9.DeYoe EA, Carman GJ, Bandettini P, Glickman S, Wieser J, Cox R, Miller D, Neitz J. Mapping striate and extrastriate visual areas in human cerebral cortex. Proc Natl Acad Sci USA. 1996;93:2382–2386. doi: 10.1073/pnas.93.6.2382. [DOI] [PMC free article] [PubMed] [Google Scholar]
- 10.Disbrow E, Roberts TP, Slutsky D, Krubitzer L. The use of fMRI for determining the topographic organization of cortical fields in human and nonhuman primates. Brain Res. 1999;829:167–173. doi: 10.1016/s0006-8993(99)01297-4. [DOI] [PubMed] [Google Scholar]
- 11.Dougherty RF, Khan RM, Press WA, Wade AR, Baseler HA, Heeger DJ, Wandell BA. Retinotopy in the human MT complex. Soc Neurosci Abstr. 1999;25:274. [Google Scholar]
- 12.Dubner R, Zeki SM. Response properties and receptive fields of cells in an anatomically defined region of the superior temporal sulcus in the monkey. Brain Res. 1971;35:528–532. doi: 10.1016/0006-8993(71)90494-x. [DOI] [PubMed] [Google Scholar]
- 13.Dubowitz DJ, Chen DY, Atkinson DJ, Grieve KL, Gillikin B, Bradley WG, Jr, Andersen RA. Functional magnetic resonance imaging in macaque cortex. NeuroReport. 1998;9:2213–2218. doi: 10.1097/00001756-199807130-00012. [DOI] [PubMed] [Google Scholar]
- 14.Duffy CJ, Wurtz RH. Sensitivity of MST neurons to optic flow stimuli. II. Mechanisms of response selectivity revealed by small-field stimuli. J Neurophysiol. 1991a;65:1346–1359. doi: 10.1152/jn.1991.65.6.1346. [DOI] [PubMed] [Google Scholar]
- 15.Duffy CJ, Wurtz RH. Sensitivity of MST neurons to optic flow stimuli. I. A continuum of response selectivity to large-field stimuli. J Neurophysiol. 1991b;65:1329–1345. doi: 10.1152/jn.1991.65.6.1329. [DOI] [PubMed] [Google Scholar]
- 16.Dukelow SP, DeSouza JF, Culham JC, van den Berg AV, Menon RS, Vilis T. Distinguishing subregions of the human MT+ complex using visual fields and pursuit eye movements. J Neurophysiol. 2001;86:1991–2000. doi: 10.1152/jn.2001.86.4.1991. [DOI] [PubMed] [Google Scholar]
- 17.Dumoulin SO, Bittar RG, Kabani NJ, Baker CL, Jr, Le Goualher G, Bruce Pike G, Evans AC. A new anatomical landmark for reliable identification of human area V5/MT: a quantitative analysis of sulcal patterning. Cereb Cortex. 2000;10:454–463. doi: 10.1093/cercor/10.5.454. [DOI] [PubMed] [Google Scholar]
- 18.Dursteler MR, Wurtz RH. Pursuit and optokinetic deficits following chemical lesions of cortical areas MT and MST. J Neurophysiol. 1988;60:940–965. doi: 10.1152/jn.1988.60.3.940. [DOI] [PubMed] [Google Scholar]
- 19.Engel SA, Rumelhart DE, Wandell BA, Lee AT, Glover GH, Chichilnisky EJ, Shadlen MN. fMRI of human visual cortex. Nature. 1994;369:525. doi: 10.1038/369525a0. [DOI] [PubMed] [Google Scholar]
- 20.Engel SA, Glover GH, Wandell BA. Retinotopic organization in human visual cortex and the spatial precision of functional MRI. Cereb Cortex. 1997;7:181–192. doi: 10.1093/cercor/7.2.181. [DOI] [PubMed] [Google Scholar]
- 21.Erickson RG, Dow BM. Foveal tracking cells in the superior temporal sulcus of the macaque monkey. Exp Brain Res. 1989;78:113–131. doi: 10.1007/BF00230691. [DOI] [PubMed] [Google Scholar]
- 22.Gattass R, Gross CG. Visual topography of striate projection zone (MT) in posterior superior temporal sulcus of the macaque. J Neurophysiol. 1981;46:621–638. doi: 10.1152/jn.1981.46.3.621. [DOI] [PubMed] [Google Scholar]
- 23.Glover GH. Deconvolution of impulse response in event-related BOLD fMRI. NeuroImage. 1999;9:416–429. doi: 10.1006/nimg.1998.0419. [DOI] [PubMed] [Google Scholar]
- 24.Glover GH, Lai S. Self-navigated spiral fMRI: interleaved versus single-shot. Magn Reson Med. 1998;39:361–368. doi: 10.1002/mrm.1910390305. [DOI] [PubMed] [Google Scholar]
- 25.Heeger DJ, Boynton GM, Demb JB, Seidemann E, Newsome WT. Motion opponency in visual cortex. J Neurosci. 1999;19:7162–7174. doi: 10.1523/JNEUROSCI.19-16-07162.1999. [DOI] [PMC free article] [PubMed] [Google Scholar]
- 26.Huk AC, Heeger DJ. Pattern-motion responses in human visual cortex. Nat Neurosci. 2002;5:72–75. doi: 10.1038/nn774. [DOI] [PubMed] [Google Scholar]
- 27.Huk AC, Ress D, Heeger DJ. Neuronal basis of the motion aftereffect reconsidered. Neuron. 2001;32:161–172. doi: 10.1016/s0896-6273(01)00452-4. [DOI] [PubMed] [Google Scholar]
- 28.Khan RM, Dougherty RF, Wandell BA, Newsome WT, Heeger DJ. Functionally distinct motion areas in human visual cortex. Soc Neurosci Abstr. 1999;25:274. [Google Scholar]
- 29.Komatsu H, Wurtz RH. Relation of cortical areas MT and MST to pursuit eye movements. I. Localization and visual properties of neurons. J Neurophysiol. 1988a;60:580–603. doi: 10.1152/jn.1988.60.2.580. [DOI] [PubMed] [Google Scholar]
- 30.Komatsu H, Wurtz RH. Relation of cortical areas MT and MST to pursuit eye movements. III. Interaction with full-field visual stimulation. J Neurophysiol. 1988b;60:621–644. doi: 10.1152/jn.1988.60.2.621. [DOI] [PubMed] [Google Scholar]
- 31.Logothetis NK, Guggenberger H, Peled S, Pauls J. Functional imaging of the monkey brain. Nat Neurosci. 1999;2:555–562. doi: 10.1038/9210. [DOI] [PubMed] [Google Scholar]
- 32.Logothetis NK, Pauls J, Augath M, Trinath T, Oeltermann A. Neurophysiological investigation of the basis of the fMRI signal. Nature. 2001;412:150–157. doi: 10.1038/35084005. [DOI] [PubMed] [Google Scholar]
- 33.Maunsell JH, Van Essen DC. Functional properties of neurons in middle temporal visual area of the macaque monkey. I. Selectivity for stimulus direction, speed, and orientation. J Neurophysiol. 1983;49:1127–1147. doi: 10.1152/jn.1983.49.5.1127. [DOI] [PubMed] [Google Scholar]
- 34.Maunsell JH, Van Essen DC. Topographic organization of the middle temporal visual area in the macaque monkey: representational biases and the relationship to callosal connections and myeloarchitectonic boundaries. J Comp Neurol. 1987;266:535–555. doi: 10.1002/cne.902660407. [DOI] [PubMed] [Google Scholar]
- 35.Morrone MC, Tosetti M, Montanaro D, Fiorentini A, Cioni G, Burr DC. A cortical area that responds specifically to optic flow, revealed by fMRI. Nat Neurosci. 2000;3:1322–1328. doi: 10.1038/81860. [DOI] [PubMed] [Google Scholar]
- 36.Movshon JA, Adelson EH, Gizzi MS, Newsome WT. The analysis of moving visual patterns. Exp Brain Res. 1986;11:117–152. [Google Scholar]
- 37.Nestares O, Heeger DJ. Robust multiresolution alignment of MRI brain volumes. Magn Reson Med. 2000;43:705–715. doi: 10.1002/(sici)1522-2594(200005)43:5<705::aid-mrm13>3.0.co;2-r. [DOI] [PubMed] [Google Scholar]
- 38.Newsome W, Gizzi M, Movshon J. Spatial and temporal properties of neurons in macaque MT. Invest Ophthalmol Vis Sci [Suppl] 1983;24:106. [Google Scholar]
- 39.Newsome WT, Pare EB. A selective impairment of motion perception following lesions of the middle temporal visual area (MT). J Neurosci. 1988;8:2201–2211. doi: 10.1523/JNEUROSCI.08-06-02201.1988. [DOI] [PMC free article] [PubMed] [Google Scholar]
- 40.Newsome WT, Wurtz RH, Komatsu H. Relation of cortical areas MT and MST to pursuit eye movements. II. Differentiation of retinal from extraretinal inputs. J Neurophysiol. 1988;60:604–620. doi: 10.1152/jn.1988.60.2.604. [DOI] [PubMed] [Google Scholar]
- 41.Orban GA, Saunders RC, Vandenbussche E. Lesions of the superior temporal cortical motion areas impair speed discrimination in the macaque monkey. Eur J Neurosci. 1995;7:2261–2276. doi: 10.1111/j.1460-9568.1995.tb00647.x. [DOI] [PubMed] [Google Scholar]
- 42.Press WA, Brewer AA, Dougherty RF, Wade A, Wandell BA. Visual areas and spatial summation in human visual cortex. Vision Res. 2001;41:1321–1332. doi: 10.1016/s0042-6989(01)00074-8. [DOI] [PubMed] [Google Scholar]
- 43.Rosa MG, Soares JG, Fiorani M, Jr, Gattass R. Cortical afferents of visual area MT in the Cebus monkey: possible homologies between New and Old World monkeys. Vis Neurosci. 1993;10:827–855. doi: 10.1017/s0952523800006064. [DOI] [PubMed] [Google Scholar]
- 44.Saito H, Yukie M, Tanaka K, Hikosaka K, Fukada Y, Iwai E. Integration of direction signals of image motion in the superior temporal sulcus of the macaque monkey. J Neurosci. 1986;6:145–157. doi: 10.1523/JNEUROSCI.06-01-00145.1986. [DOI] [PMC free article] [PubMed] [Google Scholar]
- 45.Salzman CD, Murasugi CM, Britten KH, Newsome WT. Microstimulation in visual area MT: effects on direction discrimination performance. J Neurosci. 1992;12:2331–2355. doi: 10.1523/JNEUROSCI.12-06-02331.1992. [DOI] [PMC free article] [PubMed] [Google Scholar]
- 46.Sawyer-Glover AM, Glover GH (1998) fMRI of the motor cortex: comparison of EPI and spiral pulse sequences. Proceedings of the International Society for Magnetic Resonance in Medicine: Section for Magnetic Resonance Technologists. 6:69.
- 47.Sereno MI, Dale AM, Reppas JB, Kwong KK, Belliveau JW, Brady TJ, Rosen BR, Tootell RB. Borders of multiple visual areas in humans revealed by functional magnetic resonance imaging. Science. 1995;268:889–893. doi: 10.1126/science.7754376. [DOI] [PubMed] [Google Scholar]
- 48.Smith AM, Lewis BK, Ruttimann UE, Ye FQ, Sinnwell TM, Yang Y, Duyn JH, Frank JA. Investigation of low frequency drift in fMRI signal. NeuroImage. 1999;9:526–533. doi: 10.1006/nimg.1999.0435. [DOI] [PubMed] [Google Scholar]
- 49.Smith AT, Greenlee MW, Singh KD, Kraemer FM, Hennig J. The processing of first- and second-order motion in human visual cortex assessed by functional magnetic resonance imaging (fMRI). J Neurosci. 1998;18:3816–3830. doi: 10.1523/JNEUROSCI.18-10-03816.1998. [DOI] [PMC free article] [PubMed] [Google Scholar]
- 50.Stefanacci L, Reber P, Costanza J, Wong E, Buxton R, Zola S, Squire L, Albright T. fMRI of monkey visual cortex. Neuron. 1998;20:1051–1057. doi: 10.1016/s0896-6273(00)80485-7. [DOI] [PubMed] [Google Scholar]
- 51.Tanaka K, Saito H. Analysis of motion of the visual field by direction, expansion/contraction, and rotation cells clustered in the dorsal part of the medial superior temporal area of the macaque monkey. J Neurophysiol. 1989;62:626–641. doi: 10.1152/jn.1989.62.3.626. [DOI] [PubMed] [Google Scholar]
- 52.Teo PC, Sapiro G, Wandell BA. Creating connected representations of cortical gray matter for functional MRI visualization. IEEE Trans Med Imaging. 1997;16:852–863. doi: 10.1109/42.650881. [DOI] [PubMed] [Google Scholar]
- 53.Tootell RB, Hadjikhani N. Where is “dorsal V4” in human visual cortex? Retinotopic, topographic, and functional evidence. Cereb Cortex. 2001;11:298–311. doi: 10.1093/cercor/11.4.298. [DOI] [PubMed] [Google Scholar]
- 54.Tootell RB, Taylor JB. Anatomical evidence for MT and additional cortical visual areas in humans. Cereb Cortex. 1995;5:39–55. doi: 10.1093/cercor/5.1.39. [DOI] [PubMed] [Google Scholar]
- 55.Tootell RB, Reppas JB, Kwong KK, Malach R, Born RT, Brady TJ, Rosen BR, Belliveau JW. Functional analysis of human MT and related visual cortical areas using magnetic resonance imaging. J Neurosci. 1995;15:3215–3230. doi: 10.1523/JNEUROSCI.15-04-03215.1995. [DOI] [PMC free article] [PubMed] [Google Scholar]
- 56.Tootell RB, Mendola JD, Hadjikhani NK, Ledden PJ, Liu AK, Reppas JB, Sereno MI, Dale AM. Functional analysis of V3A and related areas in human visual cortex. J Neurosci. 1997;17:7060–7078. doi: 10.1523/JNEUROSCI.17-18-07060.1997. [DOI] [PMC free article] [PubMed] [Google Scholar]
- 57.Tootell RB, Mendola JD, Hadjikhani NK, Liu AK, Dale AM. The representation of the ipsilateral visual field in human. Cereb Cortex. Proc Natl Acad Sci USA. 1998;95:818–824. doi: 10.1073/pnas.95.3.818. [DOI] [PMC free article] [PubMed] [Google Scholar]
- 58.Ungerleider LG, Desimone R. Cortical connections of visual area MT in the macaque. J Comp Neurol. 1986;248:190–222. doi: 10.1002/cne.902480204. [DOI] [PubMed] [Google Scholar]
- 59.Van Essen DC, Maunsell JH, Bixby JL. The middle temporal visual area in the macaque: myeloarchitecture, connections, functional properties, and topographic organization. J Comp Neurol. 1981;199:293–326. doi: 10.1002/cne.901990302. [DOI] [PubMed] [Google Scholar]
- 60.Wandell BA, Chial S, Backus BT. Visualization and measurement of the cortical surface. J Cogn Neurosci. 2000;12:739–752. doi: 10.1162/089892900562561. [DOI] [PubMed] [Google Scholar]
- 61.Watson JD, Myers R, Frackowiak RS, Hajnal JV, Woods RP, Mazziotta JC, Shipp S, Zeki S. Area V5 of the human brain: evidence from a combined study using positron emission tomography and magnetic resonance imaging. Cereb Cortex. 1993;3:79–94. doi: 10.1093/cercor/3.2.79. [DOI] [PubMed] [Google Scholar]
- 62.Zeki S, Watson JD, Lueck CJ, Friston KJ, Kennard C, Frackowiak RS. A direct demonstration of functional specialization in human visual cortex. J Neurosci. 1991;11:641–649. doi: 10.1523/JNEUROSCI.11-03-00641.1991. [DOI] [PMC free article] [PubMed] [Google Scholar]
- 63.Zeki SM. Functional organization of a visual area in the posterior bank of the superior temporal sulcus of the rhesus monkey. J Physiol (Lond) 1974;236:549–573. doi: 10.1113/jphysiol.1974.sp010452. [DOI] [PMC free article] [PubMed] [Google Scholar]
- 64.Zilles K, Armstrong E, Moser KH, Schleicher A, Stephan H. Gyrification in the cerebral cortex of primates. Brain Behav Evol. 1989;34:143–150. doi: 10.1159/000116500. [DOI] [PubMed] [Google Scholar]