

Abstract
Structure-from-motion (SFM) is the perception of three-dimensional shape from motion cues. We used a bistable SFM stimulus, which can be perceived in one of two different ways, to study how neural activity in cortical areas V1 and MT is related to SFM perception. Monkeys performed a depth-order task, where they indicated in which direction the front surface of a rotating SFM cylinder display was moving. To prevent contamination of the neural data because of eye position effects, all experiments with significant effects of radius, vergence, and velocity were excluded. As expected, the activity of ∼50% of neurons in V1 and ∼80% of neurons in MT is affected by the stimulus. Furthermore, the activity of 20% of neurons in area V1 is modulated with the percept. This proportion is higher in MT, where the activity of >60% of neurons is modulated with the percept. In both areas, this perceptual modulation occurs only in neurons with activity that is also affected by the stimulus. The perceptual modulation is not correlated with neural tuning properties in area V1, but it is in area MT. Together, these results suggest that V1 is not directly involved in the generation of the SFM percept, whereas MT is. The perceptual modulation in V1 may be attributable to top-down feedback from MT.
Keywords: visual motion, visual perception, striate cortex, middle temporal, depth-order, rhesus
One of the most important functions of the visual system is to capture the three-dimensional (3D) structure of the visual environment using several visual cues (Gibson, 1979;Marr, 1982). Such cues include differences between the two retinal images (binocular disparity), the size of objects, perspective cues, and visual motion. Visual motion as a depth cue can be strikingly demonstrated by viewing structure-from-motion (SFM) stimuli, in which a two-dimensional moving pattern is perceived as a 3D rotating object (Wallach and O'Connell, 1953). Although the object appears stable and rotating in one direction, the direction of rotation is bistable. During prolonged viewing, or on different trials, the perceived direction of rotation differs, although the stimulus is identical (Nawrot and Blake, 1991a). It is this bistable nature of the SFM percept that is of particular interest in the present study.
SFM is a complex percept. Beyond the perceived direction of rotation, the SFM percept includes completion and interpolation effects (Treue et al., 1991), perception of the orientation of the rotations axis (Caudek and Domini, 1998), and object recognition (Dosher et al., 1989). Hence it is tempting to suggest that the SFM percept occurs at a very high level of visual processing. By constraining the present investigation to the perceived direction of rotation of a cylinder, many of these high-level effects can be bracketed and one can study where the signals that contribute to the perceived direction of rotation are located in the visual motion pathway. Thus previous research relating neural activity to perceived motion for simple percepts (Logothetis and Schall, 1989; Newsome et al., 1989) can be extended into a domain in which the percepts are more complex, while keeping the task relatively simple. The perceived direction of rotation is equivalent to the perceived depth-order. The perceived depth-order is a general mechanism that was investigated in the present study in the context of SFM stimuli. Given that the perceived direction is an important part of the SFM percept, these experiments address basic mechanisms of SFM perception.
In the present study, we investigate the neural responses to rotating cylinders and relate the neural responses on a trial-by-trial basis to the resulting percept. We have shown previously that, for identical stimuli, the neural activity of many middle temporal (MT) neurons is correlated with the animal's percept (Bradley et al., 1998). This finding was later confirmed by a different laboratory (Dodd et al., 2001). Here we report neural and behavioral data recorded from primary visual cortex (V1), using the same stimuli and tasks from our previous study, and show that although the activity of V1 neurons changes with the percept, these changes are not correlated with neural tuning preferences. Simple behavioral effects such as eye movements and feature-based attention are ruled out through careful controls and analyses. Some of these results have been published previously in abstract form (Grunewald et al., 1999).
MATERIALS AND METHODS
Animal preparation. Three male monkeys (Macaca mulatta) aged 4–8 years were used. No histology is available, because all of the animals are still being used in other experiments. All surgical procedures were approved by the Caltech Institutional Animal Care and Use Committee and were in accordance with National Institutes of Health guidelines. All surgeries were performed under sterile conditions using general anesthesia. In the first procedure, stainless-steel bone screws were implanted onto the skull and covered with methylmethacrylate to form a head cap. In the same procedure, a scleral search coil was implanted (Judge et al., 1980). A second procedure was performed after training; specifically, a craniotomy was performed and a recording chamber (15.7 mm inner diameter) was implanted, either over V1 (30° bevel; normal to skull; 15 mm lateral from midline; 12 mm above occipital ridge) or over MT (vertical; stereotaxic coordinates, 17 mm lateral, 5 mm posterior). In all monkeys a third procedure was performed to implant a second search coil, although some recordings were made before the second search coil was implanted.
During experimental sessions, the water intake of the animals was regulated. Water intake and weight were monitored on a weekly basis to ensure the health of the animals. Usually animals were used in experimental sessions during the week, and they had ad libitum access to water on the weekends.
Experimental apparatus. Eye position was measured using the scleral search coil technique. At least one eye position was monitored in all experiments. Both eye positions were monitored and saved in most V1 recordings, but only in animal N of the MT recordings. Thus the eye positions of animal L were only saved in the V1 experiments, but not the MT experiments. It is likely, however, that animal L behaved similarly in both the V1 and MT experiments. All experiments were performed in a dark room. Monkeys were always under supervision via an infrared camera.
Behavioral control and data collection were performed using a 486DX personal computer. In most V1 experiments, eye traces were digitized at a rate of 500 Hz. In all other experiments, eye traces were digitized at a rate of 100 Hz. Spike times were collected with 1 msec precision. Visual stimuli were displayed using a Pepper SGT graphics card (Number Nine Corp.) running on a 386 personal computer. Movies were loaded onto the graphics card and were shown when instructed by the behavioral control computer. The frame rate was 60 Hz, and updating of the stimuli was synchronized with the vertical refresh.
Visual stimuli. All visual displays consisted of moving dots on a black background. Moving dots had a diameter of 0.056° and appeared in yellow, red, or green. All displays were presented through Kodak (Rochester, NY) Wratten filters: a red filter was in front of the right eye (filter number 29) and a green filter was in front of the left eye (filter number 61) so that disparities could be generated using an anaglyph display. All luminances had been adjusted so that all dots had the same luminance when viewed through the filters (3 cd/m2), and cross talk between the two eyes (i.e., the luminance of red dots seen through the red filter, and analogously for green) was <10%. In addition, fixation points and saccade targets (0.112° diameter) were shown in yellow. All motion displays were presented as movies and lasted for 1 sec.
Three different sets of movies were used. Direction movies contained 64 yellow dots at zero disparity positioned within a 4° square of width, yielding a dot density of 4 points/deg2. However, only the dots within a circular area 4° in diameter were visible. Eight directions of motion were shown, spaced at 45°. The speed of the motion stimulus was 6°/sec. Disparity movies contained red and green dots shown at varying disparities (−0.8 to 0.8° in 0.2° steps) moving in the preferred direction. By convention, negative disparities refer to near dots, and positive disparities refer to far dots. Speed and binocularly fused dot density were the same as in the direction movies. Cylinder movies contained 150 dots that were shown either in yellow or in red and green, depending on their disparity within a square area spanning 7 × 7°. There were four sets of movies. In each set of movies a cylinder (and therefore the constituent dots) moved either vertically, horizontally, or along one of the two diagonals (Fig.1A). For each neuron, one set of movies was used such that the motion in the movie was most aligned with the preferred direction of the neuron, as determined using direction movies (see above). All cylinders were defined as the parallel projection of a true 3D cylinder, which was compressed by a factor (percentage disparity) in the depth dimension by decreasing the amount of disparity that was shown. A cylinder with disparity matching that of a true cylinder is referred to as a 100% disparity cylinder; the visual disparity of the nearest dots in such a cylinder is −0.26°, whereas the disparity of the farthest dots is 0.23°. A cylinder with one-half the thickness is referred to as a 50% cylinder and so on. A 0% cylinder is a cylinder for which all dots have a disparity of 0°. Only 0% cylinders constitute pure SFM, because all other cylinders have a disparity-defined structure. During the recording experiments the exact same movies were used for each cell, except that their orientation was adjusted. Thus during data collection there was an arbitrary mapping between the sign of a cylinder and the tuning of a neuron. During the analysis the sign of a cylinder was used to define in which direction the cylinder is rotating relative to the preferred cylinder, except in Figure 10, where the arbitrary relationship was maintained (see Analysis, below). For example, for a neuron that preferred rightward, near motion, a 100% cylinder has its front going right and its back going left (counter-clockwise rotation if the cylinder were viewed from above). For the same neuron, a −100% cylinder has its front going left and its back going right (clockwise rotation). Because the direction of rotation is ambiguous for the 0% cylinder, no sign is attributed to it. Thus nine cylinder stimuli were defined: −100, −50, −25, −12.5, 0, 12.5, 25, 50, and 100%. Figure 1B provides an illustration of the cylinder stimuli used. In some earlier experiments while recording in MT, only a subset of these stimuli was used. Note that all cylinders have (1) sharp boundaries at the edge of the cylinder, (2) speed gradients, (3) density gradients, and (4) oppositely moving dots. No attempt was made to isolate any of these cues.
Fig. 1.

A, The four possible alignments of the cylinder stimuli. For individual neurons, the rotation axis of the cylinders was made to be as orthogonal to the preferred direction as possible, thus aligning one of the cylinder rotation directions with the preferred direction. B, Top view of the family of cylinder stimuli used in the depth-order task. The magnitude of the percentage disparity denotes to what extent the visual disparity cues match the disparity of a true cylinder. The sign of percentage disparity denotes the direction of rotation: positive means the cylinder rotates in the preferred direction (i.e., gave the largest response); negative means it rotates in the opposite direction. Stimuli for which percentage disparity is 0 do not specify the direction of rotation; however, one of two rotation directions is always perceived (i.e., the stimulus is bistable). This stimulus corresponds to SFM.
Fig. 10.

Correlation between disparity difference and perceptual difference for the population of neurons with significant interaction (gray circles) or additive (black circles) effects in V1 (A;n = 12) and MT (B;n = 48). In this plot alone, positive disparity does not necessarily refer to the preferred disparity. Instead, a positive disparity is arbitrarily related to the stimulus. Hence there are neurons with a negative disparity difference. The data were plotted this way to avoid destroying the correlations through edge effects, which arise if all disparity differences are forced to be positive. Thediagonal dashed lines are the 45° lines.
Task requirements. Two different tasks were used in the present experiments. Both of these tasks are illustrated in Figure2. In the fixation task, the monkeys had to acquire the fixation point and hold fixation for 2.5–4 sec. While the monkeys were fixating, either direction or disparity movies were shown. In the V1 experiments, one movie was shown per trial, whereas two movies were shown per trial in MT experiments, separated by a 1 sec blank interval. When the animals completed this task, they were rewarded with a drop of water or juice. In this task, either direction or disparity movies were shown. In the depth-order task, the monkeys had to acquire fixation and continue fixation while a cylinder movie was presented. Then two target points appeared, at opposite sides of the cylinder. To be rewarded, the monkeys had to saccade to the target that was in the direction in which the front surface had been moving. For all but the 0% cylinder, this task was well defined. On trials with 0% cylinders, animals were rewarded randomly on 80% of trials. The depth-order task is designed so that the choice of the animal reflects the percept of the animal on any given trial. Thus, for the present purposes, the words choice and percept are used interchangeably. Whenever an animal failed to initiate or fixate as required on a trial, that trial was aborted. No data were saved in aborted trials. On average, 186 trials were collected per recording experiment. For each stimulus condition 19 trials were collected on average, except for 0% disparity, for which the average was 34 trials.
Fig. 2.

Two tasks used in the experiments.A, In the fixation task, the animal has to fixate while a movie is shown and then is rewarded. B, In the depth-order task, the animal has to fixate while a movie is shown, and then it has to indicate in which of two directions it saw the front surface moving. If the animal chooses the correct direction, it is rewarded. For cylinders with 0% disparity, the stimulus is SFM; hence the experimenter does not know which percept the animal is having on a given trial, making the task ill-defined. On such trials the animals are rewarded on 80% of the trials (chosen randomly). The small black dots indicate the fixation point, the curved arrow indicates the direction of cylinder rotation, and thelarge black arrow indicates the saccade.
Recording procedures. Single neuron action potentials were recorded using tungsten electrodes (Frederick Haer Co., Bowdoinham, ME) with 1–2 MΩ impedance at 1 kHz. Electrodes were either pushed through the dura or advanced through the dura inside a sharpened hypodermic tube, after which they were advanced into the cerebral cortex. V1 neurons were identified on the basis of physiological properties (receptive field size and topographic organization), as were MT neurons (receptive field size, topographic organization, and direction tuning).
Neurons were isolated using a time–voltage window discriminator [either BAK (Germantown, MD) or Tucker Davis Technologies (Gainesville, FL)]. Once a cell had been isolated, its receptive field was mapped using a bar or a random dot pattern, the location of which was controlled with a mouse. Next, we measured direction tuning. Then a disparity tuning curve was obtained using disparity movies in the preferred direction. Finally the animal performed the depth-order task while cylinder stimuli aligned with the preferred direction were shown.
Analysis. All analyses were performed based on data collected during the 1 sec stimulus presentation interval. For each trial, the firing rate R was calculated. In addition, when such data were available, the mean radial fixation error E, the mean horizontal vergence V, the mean horizontal speedX, and the mean vertical speed Y were determined. Any trial in which the radial fixation error was >1° or in which either of the speeds was >1°/sec at any time was excluded from additional analysis.
To analyze the tuning properties of neurons, two indices were used: the opposite index and the extreme index. The opposite index is defined as 1 − A/P, where P denotes the neural response to the preferred stimulus (i.e., the stimulus that elicited the highest response) and A refers to the neural response to the anti-preferred stimulus (i.e., the stimulus opposite to the preferred stimulus). The extreme index is defined as 1 −W/P, where P is as defined above and Wis the response to the weakest stimulus. In general these two indices are not the same. Because no baseline trials occurred in the depth-order task, whereas they did in the fixation task, and to maintain consistency between the indices, the baseline was not subtracted for any of the indices.
As is customary (Maunsell and Van Essen, 1983b; Albright, 1984; Snowden et al., 1991), the opposite index was used to quantify direction tuning. The extreme index was used to quantify disparity tuning and cylinder tuning (Bradley and Andersen, 1998; DeAngelis and Newsome, 1999). To statistically analyze the direction-tuning data, a bootstrap analysis was performed. In this analysis, direction tuning was estimated as the radius of the vector average of the motion direction vectors weighted by the corresponding firing rates. The bootstrap proceeded by randomly shuffling the firing rates and recalculating radii. Direction tuning was significant if the radius of the unshuffled data significantly exceeded the distribution of radii obtained from the shuffled data. To determine the disparity tuning, a one-way ANOVA across stimulus conditions was performed. Two types of analyses were performed to estimate cylinder tuning: a one-way ANOVA and a linear regression with percentage disparity as the independent variable. Both yielded similar results, so only the results of the regression are reported here. This regression was also used to determine the preferred percentage disparity. This agreed with the prediction based on direction and disparity tuning for two-thirds of the recorded cells. In the experiments there was no specific relationship between the sign of the stimulus and the preferred stimulus of the neurons. For ease of exposition, we have changed the sign of all disparities so that positive disparities refer to stimuli that go in the preferred direction of the cell for tuning to the cylinder. This procedure was applied throughout, except in Figure 10, where the disparity difference is related to the sign of the actual stimulus.
Data collected in the depth-order task were analyzed in more detail. First the psychophysical performance was estimated by fitting the following logistic function (Macmillan and Creelman, 1991):f(x) = 1/(1 +exp[−(mx + b)]).
The parameters b and m denote the offset and the slope of the logistic function, respectively. The bias is given byb/m. The transition is given by 2/m; it defines the region over which the logistic changes from 27 to 73%. Whenever the slope is shown, it is shown as percentage performance/percentage disparity (i.e., it is scaled by 100). The fit was performed using a maximum likelihood method. Significance of each fit was determined using the likelihood ratio test (Fox, 1997).
In addition, neural data were subjected to a regression analysis. In this analysis, the firing rate R on each trial was expressed as a linear function of cylinder disparity D, the perceptP, and an interaction term PD in the following equation: R = b0 +bDD +bPP +bIPD.
The cylinder disparity D varied from −100 to 100%, as defined above, and the percept P was 1 whenever the animal indicated that the front surface was rotating in the preferred direction of the neuron and −1 whenever the animal indicated that the front surface was rotating in the opposite direction. As indicated above, for each cell the cylinder could only be rotating in two possible directions (for example left vs right). Following the principle of marginality (Fox, 1997), for any neuron that showed no significant interaction (i.e., for whichbI was not significantly different from zero), a second regression was performed, now without an interaction term, as defined by the following equation:R = b0 +bDD +bPP.
An illustration of these regression analyses is shown in Figure3.
Fig. 3.

Illustration of the regression analysis used. Thex-axis denotes the stimuli, and they-axis denotes hypothetical firing rates.Symbols denote mean firing rates when animals perceived positive disparity (○) or negative disparity (*). Thelines denote the resulting regression fits.A, Regression with significant interaction between percentage disparity and the percept. B, Regression with no interaction but with significant additive effects of percentage disparity and percept.
Similar regression analyses were performed using the radial errorE, the horizontal vergence V, the horizontal eye speed X, and the vertical eye speed Y as dependent variables. Experiments that showed significant radial error effects, vergence effects, horizontal speed effects, or vertical speed main or interaction effects (collectively referred to as “eye effects”) were excluded from additional analysis, depending on whether effects were being tested in the additive or the interaction regression model of the neural activities. One of the advantages of using the same analyses to determine whether there is a neural effect in a given experiment, and to exclude experiments contaminated with eye position effects, is that both have the same power.
RESULTS
Database
A total of 246 experiments were performed in three monkeys. In these experiments the monkeys were performing the depth-order task, and at the same time neural activity was recorded. A total of 128 experiments were performed while neural activity was recorded in area V1, and 118 recordings were made in area MT. From monkey L, neurons were recorded in both areas V1 and MT, whereas in monkeys O and N only neurons from one area, V1 and MT, respectively, were recorded. For each area the data for two monkeys are pooled.
Behavioral measures
Figure 4 shows psychophysical data collected during two experiments, one while recordings were performed in area V1 and one while recordings were performed in area MT. Note that in both cases the animals are performing well. The performance was quantified by fitting a psychometric function to the data; whenever there was a significant slope (likelihood ratio test; p< 0.05) of the psychophysical data, the monkey was deemed to have performed the task. Experiments in which the slope was not significant indicated that the animal was not performing; those experiments were not used for additional analysis. In total, 13 experiments performed while recording in V1 and 10 experiments performed while recording in MT were excluded for this reason. Table 1provides a breakdown by animal and area in which recordings were made of all experiments and shows those excluded because of poor performance of the animals.
Fig. 4.

Example of psychometric functions from two experiments. The x-axis indicates the percentage disparity of the cylinders used. The y-axis indicates the percentage of trials for each condition where the animal reported perceiving a cylinder of positive percentage disparity. Also shown are fits to the data and the significance of those fits. Fitted parameters of the logistic function for A: slope, 11.8; bias, −11.7; transition, 16.9. Fitted parameters for B: slope, 5.0; bias, 8.32; transition, 40.2. Open circlesindicate data averages, the dotted horizontal line indicates change, and the vertical dotted line indicates 0% disparity.
Table 1.
Behavioral data and number of experiments included in the analysis
| Means | Area | |||||
|---|---|---|---|---|---|---|
| Bias Slope | V1 | MT | ||||
| % Disparity | % Performance/% disparity | Task | Percentage (%) | Task | Percentage (%) | |
| Animal | ||||||
| O | −13 | 8.4 | 78 (85) | 92 | ||
| L | −4 | 2.7 | 37 (43) | 86 | 67 (75) | 89 |
| N | 9 | 2.9 | 39 (43) | 91 | ||
| Overall | −4.6 | 4.7 | 115 (128) | 90 | 106 (118) | 90 |
Mean biases and slopes in behavioral performance for each animal are shown (see Fig. 5 for the overall distribution). For each animal, the table also shows in how many experiments it was performing the depth-order task, how many experiments were performed in total, and the proportion of experiments in which the animals were performing adequately.
Figure 4 illustrates several important points about the performance of the animals. First, the animal is performing the task. Second, the animal's behavior for the bistable stimulus (0% disparity) is a smooth continuation of the overall psychometric function, indicating that the animals were reporting their percepts for this stimulus as well. Third, because the psychometric function differs from a step function, there are sufficient “error” trials for additional analyses.
The performance of the animals was quantified using the two parameters of the logistic fit: the bias b/m and the slopem. The bias indicates the horizontal offset of the 50% point of the logistic function. The slope m is four times the slope of the logistic function at the 50% point. The distributions of these parameters across all experiments are shown in Figure5. Overall there were non-zero biases in individual experiments, but no overall biases (mean, −4.6% disparity; sign test; p > 0.5); in contrast, the slope tended to be positive and was on average ∼4.7% performance per percentage disparity (sign test; p < 0.001). The biases and the slopes did not differ significantly between the animals (two separate one-way ANOVAs; p > 0.1). The mean biases and slopes for each animal are shown in Table 1. Performance in many visual tasks gets worse as the stimulus is moved into the periphery. As expected, we found a negative correlation between stimulus eccentricity and slope (rs = −0.26; p < 0.001). However, there was no effect of the stimulus orientation on performance.
Fig. 5.

The distribution of the psychometric parameters across all experiments. A, Distribution of biases. A positive bias means that in an experiment the monkey's percept was biased in favor of the preferred cylinder of the neuron under study. Overall the biases are not distinct from zero (mean, −4.55; sign rank;p > 0.5). B, Distribution of slopes; these slopes tend to be positive (mean, 4.71; sign rank;p < 0.001), indicating that the animals were performing the task as required.
A similar study (Dodd et al., 2001) has reported significantly smaller thresholds than those in the present study. This difference may be attributable to a twice longer stimulus presentation in that study.
Adaptation
Previous studies have demonstrated that adaptation to SFM displays can bias subsequent viewing of similar displays (Nawrot and Blake, 1991a). Therefore we investigated to what extent previous trials could affect subsequent choices. This effect should be weak, given that each stimulus is only presented for 1 sec. Figure6A shows a “shifted” psychometric function that was obtained by plotting the percentage of the trials for which the positive disparity was perceived as a function of the stimulus in the previous trial (in contrast to the “unshifted” psychometric function shown in Fig. 4, for which percept and stimulus refer to the same trial). The logistic fit is significant, indicating that the previous stimulus is able to affect the present percept of the animal.
Fig. 6.

The effect of previous stimuli on subsequent percepts. A, Psychometric function. The performance on a given trial is plotted as a function of the stimulus in the previous trial. These data were collected in the same experiment as the (unshifted) psychometric function in Figure4B. The fitted parameters are as follows: slope, 0.7; bias, 28.9; transition, 281.7. There is a weak and significant effect of previous stimuli. B, Correlation between the slopes of unshifted slopes (x-axis) and shifted slopes (y-axis) across all experiments. There is a significant negative correlation between these slopes.C, Correlation coefficient between unshifted and shifted slopes for shifts going backward in time for up to nine experiments and forward by up to seven experiments. Negative shifts correspond to backward shifts (causal); positive shifts correspond to forward shifts (noncausal). *Significantly different from 0.
To better study this effect across all of our experiments, we correlated the slope of the unshifted psychometric function against the slope of the shifted psychometric function. However, no experiments were excluded in these analyses, because in a small number of experiments in which the unshifted slope was not significant, it was significant when shifting stimuli. A scatter plot illustrating this analysis is shown in Figure 6B. There is a significant negative correlation between the two slopes (rs = −0.24; p < 0.001). This is consistent with related results from a different laboratory (Dodd et al., 2001). We repeated this analysis by shifting all stimuli not only by one trial but also by more trials, and we recalculated the correlation. We also shifted in the opposite direction; in other words, we recalculated a psychometric function using present percept and future stimuli. The development of the correlation over time is shown in Figure 6C. Thex-axis indicates by how many trials the stimulus has been shifted with respect to the percept. Negative shifts indicate earlier stimuli, and positive shifts indicate future stimuli. There is a significant negative correlation between unshifted slope and the shifted slope for shifts of up to seven stimuli into the past, but there are no correlations with future stimuli, as expected. Thus, although the exposure to the stimuli is very brief in each trial, it does affect future percepts.
One possible explanation for this result may be a spurious correlation between subsequent stimuli, caused by imperfect randomness of the number generator. We tested this hypothesis by determining the correlation coefficient between subsequent stimuli, and found no significant correlation. Another explanation may be the monkey's strategy in the task, according to which an animal may be more likely to choose the same or the opposite direction on subsequent trials. We found a weak correlation between choices on subsequent trials, the sign of which varied from experiment to experiment. However, when this correlation was discounted, the effect on the slope remained. Thus, previous stimuli do affect subsequent percepts.
The shifted performance was not related to the eccentricity of the stimulus (which stayed constant throughout an experiment) but was affected by the cylinder orientation (ANOVA; p < 0.005), with horizontal cylinders (rotating about a vertical axis) most often yielding psychometric functions with a negative slope in contrast to the other orientations, which could have positive or negative slopes (multiple comparison; p < 0.05). Although the stimulus orientation tended to constrain the cylinder location, the special effect of horizontal orientation on the psychometric slope is not attributable to a systematic variation with stimulus eccentricity. Rather, with horizontal cylinders all animals tended to work more consistently (i.e., they aborted fewer trials). As a result fewer trials were excluded, which means there were more subsequent trials included in the analysis.
In summary, the monkeys were performing the depth-order task well. There were adaptation and eccentricity effects that are consistent with SFM perception (Nawrot and Blake, 1991a; Todd and Norman, 1991). Thus the depth-order task probes an important part of SFM perception.
Perceptual effects in neural responses
Having investigated the psychophysical performance of the animals, we turn to neural tuning properties. It is important to note that in the following analyses any experiments that showed corresponding eye position effects have been excluded. For more details, see below (Eye position effects). First we determined that cells in V1 and MT respond in a consistent manner for the cylinder stimuli used in this study. In both areas there are cells that change their firing rate as the cylinder stimuli are changed. There are neurons in V1 with a significant cylinder tuning (see Materials and Methods for definition; significance established using ANOVA), but across the population cylinder tuning tends to be weaker than in area MT (Mann–Whitney;p < 0.001). This analysis does not assert that there are neurons in V1 or MT that are specifically tuned for cylinders. Rather, this analysis demonstrates that the neural responses for cylinders are consistent and that they can be used for additional analyses in which not only the cylinder stimulus is varied but, in addition, trials are sorted according to the resulting percept.
There were neurons both in V1 and MT that displayed activity that was modulated with the percept. Figure 7shows the tuning curves of four such neurons, two from area V1 (Fig.7A,D) and two from area MT (Fig. 7B,C). In the plots in Figure 7, the firing rate is shown as a function of the stimulus and parameterized by the animal's percept. Note that in three of these cells (Fig. 7A–C), the curves corresponding to the “positive” percept (meaning that the animal reported seeing a cylinder of positive percentage disparity) differ from the curves corresponding to the “negative” percept.
Fig. 7.

Cylinder tuning curves separated out according to the percept for two V1 neurons (A, D) and two MT neurons (B, C). The neurons shown in A andB exhibited a significant interaction effect between percentage disparity and percept. The neuron in C had no interaction but did show additive effects of both percentage disparity and percept. The neuron in D exhibited neither interaction nor significant modulation with percept but was tuned for cylinder disparity. The x-axis denotes the percentage disparity of the cylinder, the y-axis denotes the firing rate, and the symbols indicate whether the animal perceived a positive cylinder (○) or a negative cylinder (*). Regression fits are also shown. Error bars denote SEs. Vertical dotted lines indicate 0% disparity.
As an initial analysis, we compared activity corresponding to the percentage disparity stimulus, separated according to the monkeys' percept. To do this, we performed t tests for firing rates. For this analysis, we also performed t tests for all eye position indicators, and only experiments in which there were no eye effects were used. Of the 47 V1 neurons remaining, only three showed a significant effect of percept, which is not more than the expected false positive (binomial test; p > 0.1). In MT neurons, 12 of 85 neurons showed a significant perceptual modulation, which is significantly above chance (p < 0.005). In addition, we also calculated the choice probability (Britten et al., 1996). This denotes the probability that an ideal observer would correctly predict the percept based on the neural activity. In V1, the mean choice probability was 0.48, which was not significantly different from chance (sign test; p > 0.3). In contrast, in MT the mean choice probability was 0.57, which was larger than chance (p < 0.05). This mean choice probability is similar to the previously reported mean choice probability of 0.56 using a slightly different stimulus (Britten et al., 1996) but significantly less (p < 0.05) than the previously reported mean choice probability of 0.67 using a more similar stimulus (Dodd et al., 2001). Given the latter authors' data showing that the perceptual effect increases over a trial (their Fig. 13), and because they integrate over the entire stimulus period in their analysis, our lower mean choice probability can be explained, at least in part, by the shorter duration of time that was used to calculate firing rates (1 sec as opposed to 2 sec). Together, all of these analyses show the existence of a perceptual modulation for the bistable stimulus in MT, but the power of these analyses is too weak to conclude with a high degree of confidence that there is no such effect in V1.
To increase the power of our analysis, we included all trials, including error trials in which the monkeys performed the task but indicated the “incorrect” percept. We quantified our data using linear regression for which the percentage disparity was one factor, the percept was a second factor, and the multiplicative interaction of the two was a third factor. In some cells the difference between the two percepts resulted in a significant interaction between the factors of disparity and percept. Two such examples are shown in Figure7A,B. In other cells, the difference of one curve with respect to the other resulted in a significant additive effect attributable to the monkey's percept, without a significant interaction. One such cell is shown in Figure 7C. Finally there are cells with a firing rate that was not affected by the percept, as shown in Figure 7D, while there was a significant effect of percentage disparity.
To determine the perceptual modulation across the population, each neuron was analyzed using the same regression analysis. We initially determined whether a neuron had a significant interaction. If it did, the neuron was considered to have an interaction effect, and the main effects were ignored in accordance with the principle of marginality, which states that main effects are not meaningful in the presence of interactions (Fox, 1997). If there was no effect of interaction, then the effects of percentage disparity and of percept were considered. Overall, 21% of V1 cells had a perceptual or interaction effect; this proportion was 63% for MT neurons. The effects of percept and percentage disparity could occur in isolation or together. In total, then, there are five specific categories: neurons that show an interaction effect, neurons that show a combined percentage disparity and perceptual modulation, neurons that show only a disparity effect, neurons that show only a perceptual modulation, and neurons that show no effect at all. Figure 8 shows the percentage of cells in each of those categories for both V1 and MT. The percentage of cells that has an interaction effect is significantly above chance in both areas (V1, 15%, p < 0.001; MT, 44%, p < 0.001). The percentage of cells that has both effects additively is not different from the expected false positive in area V1 (3%), but it is significant in area MT (14%;p < 0.001). In addition there are cells in both areas that show only an effect of percentage disparity (V1, 30%,p < 0.001; MT, 21%, p < 0.001). In neither area are there more cells than expected by chance that show an effect of only the percept (V1, 3%; MT, 4%). Finally, both areas contain many cells that show no effect at all, although the percentage in V1 is larger (48%) than in MT (19%). As shown in Table2, this pattern of results also holds when the data for each monkey are analyzed separately.
Fig. 8.

Results of regression analysis for the population of V1 neurons (A) and MT neurons (B). The percentage of cells in the five nonoverlapping categories are shown: cells with significant interaction effects (INTER), cells with significant additive effects of percentage disparity and percept (ADD), neurons exhibiting only percentage disparity effects (% DISP), neurons with effects of percept only (PERCEPT), and neurons with no effects (NONE). Each neuron is counted in exactly one category; hence all the bars add up to 100%.Asterisks denote the results of a binomial test comparing chance level against actual percentage (***p < 0.005). The horizontal dashed line indicates percentage of false positive at p < 0.05.
Table 2.
Consistency of effects in regression analysis across animals
| V1 | MT | |||||||
|---|---|---|---|---|---|---|---|---|
| I | A | D | P | I | A | D | P | |
| Animal | ||||||||
| O | 17% | 2% | 30% | 2% | ||||
| L | 9% | 6% | 31% | 6% | 43% | 16% | 18% | 5% |
| N | 47% | 9% | 30% | 4% | ||||
For each animal and for each set of neural data, the percentages in the four main categories resulting from the regression analysis are shown. The effect types are interaction (I), additive (A), percentage disparity (D), and percept (P).
Magnitude of perceptual effects
The regression analysis not only allows us to test the significance of individual factors but also yields estimates of the magnitude of the coefficients. The distributions of these coefficients across all experiments are shown in Figure9. Except for the constant term, which is shown in Figure 9A,B, the main purpose is to compare the coefficients. However, this is made difficult because the stimulus units are in percentage disparity, whereas the percept units are dummy coded (−1 and 1). Clearly these units differ in meaning. To accommodate for this difference, all coefficients that include the factor percentage disparity were scaled by the size of the transition region obtained from the psychometric function collected simultaneously with the neural data. As described above, the transition region is 2/m. As a result of this transformation, stepping from −1 to 1 on the scaled disparity dimension is equivalent to stepping from the psychophysical threshold for one percept (−1) to the other (+1). In other words, the scaling makes the two variables comparable. In the distributions shown in Figure 9, significant coefficients are highlighted. Across V1 and MT neurons, the scaled interaction coefficient did not differ from 0 (Wilcoxon test; p > 0.08), even when restricted to significant coefficients. The coefficient of scaled disparity differed significantly from 0 (p < 0.001), as did the coefficient of percept (V1, p < 0.05; MT, p < 0.001). Restricted to neurons with significant coefficients, scaled disparity reached significance in both areas (V1, p < 0.05; MT,p < 0.001), whereas the coefficient of percept reached significance only in MT (p < 0.001). In both areas the distributions of scaled disparity coefficients of all neurons were larger than the distribution of percept coefficients (p < 0.01). The coefficients of both scaled disparity and percept were significantly larger in MT than in V1 (p < 0.05). Overall the coefficients support the conclusion that disparity is represented in both V1 and MT and that the percept is only represented in MT. However, the coefficients of the interaction term are centered on zero and therefore are not conclusive. This is not surprising, given that the interaction coefficient is attributable to the multiplication of percentage disparity and percept, and therefore the overall effect on the regression depends on the other coefficients as well. For example, if the coefficients for percentage disparity and percept are both positive, the interaction coefficient would maintain that positive relationship if it was positive but could invert it if it was negative. In contrast, if the coefficients for percentage disparity and percept are both negative, then a positive interaction term could change the relationship and a negative term would maintain it. What then does the interaction effect mean?
Fig. 9.
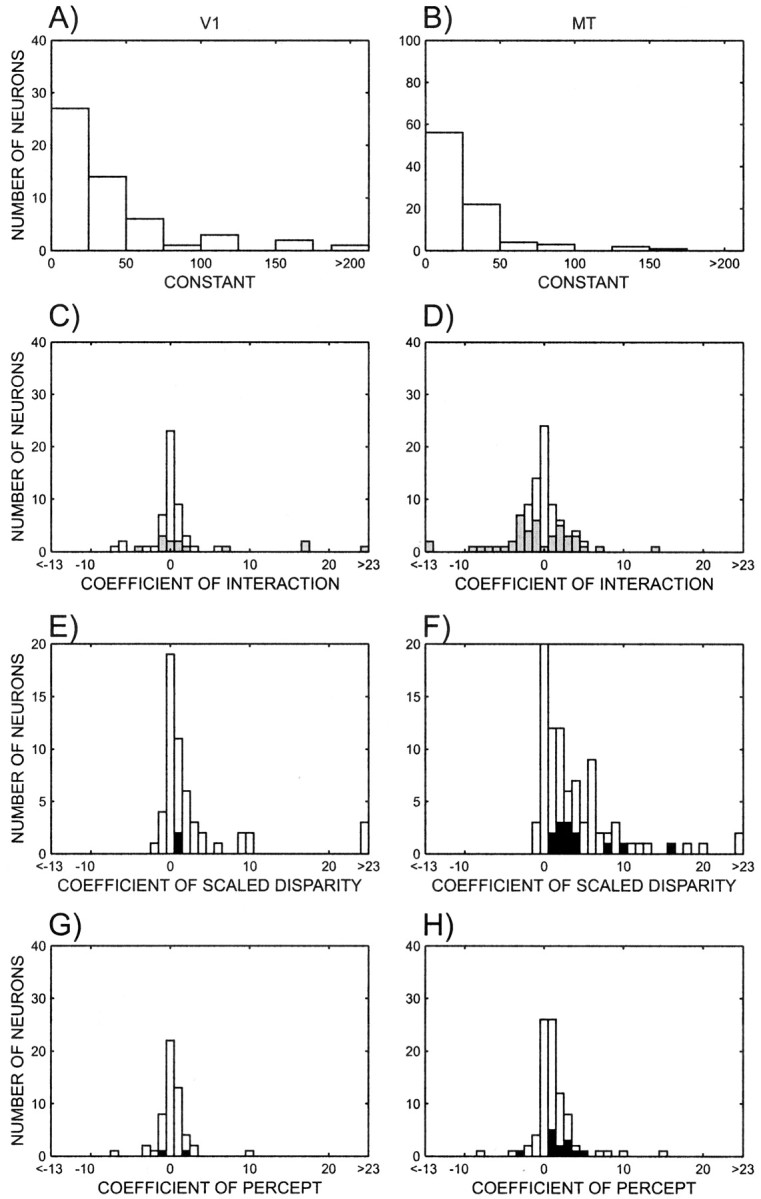
The distribution of coefficients of the regression analysis for neurons in V1 (left) and MT (right). A, B, Constant term. C, D, Interaction coefficient; neurons with significant interactions are shown in gray. E, F, Disparity coefficient; neurons with both significant disparity and percept effects are shown in black. G, H, Percept coefficient. The interaction and disparity coefficients were scaled such that a step from −1 to 1 in the scaled disparity variable is comparable with a step from −1 to 1 in the percept variable.
One way to interpret the interaction effect is as a result of the randomness of spike trains. It is known that with higher mean firing rates, the variance of the firing rates also increases (Snowden et al., 1992). Thus, with preferred stimuli the firing rates will tend to fluctuate more between trials, which in turn, if that neuron contributes to the percept, will bias the percept randomly from trial to trial. Thus, one might expect a stronger perceptual effect with higher firing rates, which would be detected as an interaction effect in our analyses. This would explain the pattern in Figure7B. Alternatively, if perceptual and visual signals converge at a single neuron and the perceptual effect has a mostly modulatory effect on the stimulus response, then this modulation may be the basis of the interaction. This would explain the pattern in Figure7A. Additional research will be necessary to elucidate these mechanisms.
Correlation between percept and neural tuning
The neurons that show an interaction effect and those that show both a disparity effect and a perceptual modulation merit additional study. This can be seen from Figure 7. Two of the cells shown have significant interaction effects (Fig. 7A,B) and one has a combined disparity and perceptual modulation (Fig. 7C). By definition these neurons respond more for cylinders with positive percentage disparities. Thus, if those cells participate in perception, one would expect that the firing rate should increase whenever the monkey has the positive percept. Conversely, the firing rate should decrease whenever the monkey has the negative percept. Looking at Figure 7, one sees that indeed, for these cells, higher firing rates co-occur with positive percepts. Neurons that exhibit this property are called correlated (Logothetis and Schall, 1989; Bradley et al., 1998), because the disparity tuning matches the perceptual modulation. Neurons for which the opposite is true are called anti-correlated cells. For cells that have no interaction effect, this can be analyzed on a cell-by-cell basis by comparing the slopes resulting from the regression. If the percentage disparity and perceptual slopes have the same sign for a given neuron, that cell is correlated as defined above. If the signs are opposite, the neuron is anti-correlated. There are too few neurons in our V1 sample that show additive effects without interaction to draw any conclusions about them. In MT, however, nearly all cells that had additive effects without interaction were correlated (12 of 13 cells; p < 0.005).
For cells that have a significant interaction term, the main factors are not valid individually according to the principle of marginality (Fox, 1997). For those cells, the regression coefficients cannot be used to study whether cells are correlated. Instead we devised two metrics: the disparity difference and the perceptual difference. The disparity difference measures the effect of the stimulus while ignoring the animal's percept. It is defined as the difference between the neural response corresponding to +100% disparity and −100% disparity without regard for the animal's percept. In this analysis, the disparity tuning curve is expressed in terms of the actual stimuli used, not in terms of the preferred disparity (i.e., the tuning curves are not flipped) (see Materials and Methods). Hence the disparity difference is related to the actual stimulus rather than to the preferred stimulus, and hence can attain negative values. For example, a neuron that prefers the front surface moving to the right over the front surface moving to the left will have a positive disparity difference. In contrast, a neuron that prefers the front surface moving to the left will have a negative disparity difference. Referring the disparity difference to the original movies is necessary, because if the disparity difference was always expressed in terms of the preferred disparity, the disparity differences for all neurons would be positive, while the perceptual difference can be positive or negative. Forcing one of these two differences to be positive destroys any correlation. The perceptual difference measures the perceptual modulation for the bistable stimulus. It is defined as the difference between the neural responses corresponding to positive and negative percepts for 0% stimuli. Figure 10 shows scatterplots of the disparity and the perceptual differences. Among the V1 neurons that showed an additive or interaction effect, the disparity difference and perceptual difference are not significantly correlated. For area MT, in contrast, there is a significant positive correlation between these differences (rs = 0.54;p < 0.001). From this it follows that firing rates of cells with interaction effects in V1 are not correlated with the percept, whereas they are in MT. This means that MT neurons that are strongly tuned for cylinders also tend to show stronger perceptual effects.
An inspection of Figure 10 shows that there is an outlier in the V1 data. After removal of this outlier, there is still no significant correlation in the V1 data. Although significance testing of the correlation coefficient takes the sample size into account, we wanted to be sure that the differing results for V1 and MT were not attributable to sample sizes. We performed a bootstrap analysis by randomly picking from the MT neuron sample the same number of neurons as in the V1 sample and determining the correlation coefficient. This procedure was repeated 1000 times. The mean correlation was 0.51 and was significantly larger than zero (p < 0.05). Thus picking fewer neurons did not affect the correlation. This shows that the V1 sample size would have been large enough to detect a correlation, had there been one.
Having established that there are correlated perceptual modulations in cortical area MT, it is important to determine how the cells that show these effects differ from other cells. To do this we compared the direction, disparity, and cylinder indices of all cells with the indices of those cells that had both perceptual and percentage disparity effects and with those that had an interaction effect. For both V1 and MT there were no significant differences between neurons that had both perceptual and percentage disparity effects and the population of neurons as a whole, or the subpopulation that was tuned. Similarly, there were no differences when the indices of the neurons with an interaction effect compared with the population as a whole. However, V1 neurons with a significant interaction effect had weaker direction indices than directionally tuned cells. This was not the case in MT. Disparity indices for neurons with an interaction effect were lower than the disparity indices for disparity-tuned neurons in both V1 and MT (Wilcoxon test; V1, p < 0.05; MT,p < 0.001). This finding is difficult to understand and requires additional investigation. There was no significant difference between the cylinder indices of cylinder-tuned neurons and those that showed an interaction effect. The distributions of indices for tuned neurons and those for neurons with interaction effects are shown in Figure 11.
Fig. 11.

Histograms of direction, disparity, and cylinder indices for V1 (left) and MT (right) neurons. White bars denote neurons with significant tuning. Gray bars denote neurons with significant interaction effects between percentage disparity and percept.
Possible attentional explanations
Allocation of attention to spatial locations has been shown to modulate the response of V1 neurons (Watanabe et al., 1998; Ito and Gilbert, 1999) and MT neurons (Treue and Maunsell, 1996), and attention to the feature of motion direction also modulates MT activity (Treue and Martinez Trujillo, 1999). However, attention directed only to the direction or only to the depth of a stimulus cannot explain the correlation of the percept with neural activity using the SFM display (Fig. 10B), because this effect is reliant on both direction and depth. For instance, attending to the near surface will enhance activity for the two populations of near cells selective for the two directions of motion in the display and will not produce a correlation between activity and the perceived direction of rotation of the cylinder.
A more complicated model is one in which the animal allocates its attention differently on different trials and the allocation is related to the choice of the animal. For example, the animal may attend to different depths (i.e., front or back surface) on different trials. Attending to the near surface will increase activity for a stimulus matching the preferred direction of a near-tuned cell. If the animal routinely saccades to the target in the direction of motion of the front surface, then the animal's choice and the increase in neural activity will be correlated. For a far-tuned neuron, one would also expect an increase of neural activity when the animal attends to the back surface. However, if the animal is performing the task correctly, it should saccade in the opposite direction to the direction of motion of the back surface. This particular example predicts that near-tuned neurons should be correlated, whereas far-tuned neurons should be anti-correlated. More generally, the animal can attend to either surface on a particular trial but must choose the same direction when attending to one surface and the opposite direction when attending to the other, a behavior that seems very unlikely.
The above scenario would still work if the neurons in our sample that show the perceptual effect were all near-tuned. We tested this possibility by looking at the distribution of preferred disparities for V1 and MT neurons, which is shown in Figure12. For V1 neurons with an interaction effect, the preferred disparities (obtained using disparity movies) are not biased toward near or far cells (binomial test; p> 0.3). For the MT cells, the preferred disparities are biased toward near cells, but there is no significant difference between this bias and the bias across all cells, or those cells that were used in cylinder experiments (Wilcoxon test; p > 0.7). Similarly, for cells that exhibited significant effects of percentage disparity and percept, there were no significant deviations from the population as a whole (p > 0.5). Thus, the preferred disparity is not related to the existence of an interaction or additive effect. For MT neurons we can test directly whether there was an association between the preferred disparity and whether the perceptual effect of a neuron was correlated with the tuning properties. We tested whether the proportion of MT cells that were near tuned and correlated and those that were far tuned and anti-correlated exceeded the chance level, which it did not (48%; binomial test;p > 0.2). In contrast, the proportions of neurons that were correlated for both far- and near-tuned cells (67%) did exceed chance (binomial test; p < 0.05). In sum, a systematic relationship between where spatial attention is allocated and the choice of the animal does not appear to explain our results. A similar argument can be applied to a systematic relationship between attention to the direction of motion and choice.
Fig. 12.

Histograms of preferred disparity of the populations of neurons in V1 (A) and MT (B). White bars indicate all neurons for which the cylinder analysis was performed. Gray bars indicate all neurons for which there was a significant interaction effect between percentage disparity and percept.
It is possible that a more high-level attentional effect could explain our findings. If attention is directed to the direction of rotation of the cylinder, then such an effect cannot be distinguished from one that is related to the perception of a rotating cylinder (Dodd et al., 2001). Consistent with this, visual search experiments suggest that attention can be directed to a surface, even if the surface is slanted (He and Nakayama, 1995).
Eye position effects
Some of the effects that were discussed above could have arisen because of eye position effects (Ringach et al., 1996). Eye position effects refer to systematic changes of radial error, vergence, horizontal speed, or vertical speed. Hence, additional linear regressions were performed to detect any eye movement artifacts that may be present. Either the mean radial error, the mean vergence error, the mean horizontal speed, or the mean vertical speed were taken as the dependent variable and were expressed as a linear function of stimulus disparity, the animal's percept, or an interaction. Few experiments showed such effects. Figure 13illustrates the proportion of experiments that showed the various effects. The proportions are overlapping (i.e., a given experiment may have been counted several times). The number of significant eye position effects is close to the expected false-positive level for each test. This suggests that the monkeys did not vary their eye position systematically in the experiments. Nevertheless, experiments that showed a significant effect on radial error, vergence, horizontal speed, or vertical speed because of an effect of interaction, disparity, or percept were excluded, depending on whether effects were being tested in the additive or in the interaction regression model of the neural activities. Given that at least four tests were performed on each experiment (effect of interaction, disparity, or percept on radial error, vergence, or horizontal or vertical speed), and using a significance level of αI for each individual test, the overall false positive rate αT is given by the following equation: αT = 1 − (1 − αI)4.
Fig. 13.

Percentage of experiments in which there were eye position effects. Those experiments were excluded from additional analysis and are shown here only to demonstrate that these amounted to a small proportion of all experiments. The x-axis denotes the categories in which a given experiment exhibited a significant effect using the same regression analysis that was also used to analyze firing rates. The categories are as follows: interaction (INTER), percentage disparity (% DISP), and perceptual modulation (PERCEPT) for radial error (A), vergence error (B), horizontal speed (C), and vertical speed (D). Individual experiments can appear in several categories. Error bars denote SDs.
With the significance level for each individual test being 0.05, the resulting overall false positive rate is 0.19. In other words, the probability of showing a significant effect on at least one of the tests was high, and therefore in our analysis we likely erred by excluding too many neurons because of possible eye position effects. Thus the criteria we used to exclude cells are conservative. This argues strongly against a systematic variation of the eye position as a factor in the remaining experiments. Of the 128 experiments performed while recording in V1, 106 remained after exclusion of experiments in which the animals were not working or in which eye effects were detected. Of the 118 experiments performed while recording in MT, 101 remained after exclusion.
We also analyzed the regression coefficients of eye position effects and correlated them for each animal separately with the corresponding neural activity effects to detect any overall trends. In total this yields 36 correlations (three animals × three coefficient types × four eye position coefficients). Of these correlations, not one was significant (Spearman-rank correlation coefficient;p > 0.1), further suggesting that a systematic deviation of eye position could not account for the observed perceptual effects.
DISCUSSION
The present experiments show that the activity of many cells in areas V1 and MT changes with the percept while monkeys view a bistable SFM display. The proportion of cells that show a perceptual modulation in MT is approximately three times as large as the proportion in V1. Both in V1 and MT, the perceptual modulations co-occur with stimulus-specific effects. Thus, neither area contained cells that were exclusively modulated with the percept. The perceptual modulations of many neurons in MT match the effect one would predict based on the tuning properties of those neurons, but this is not the case for V1 neurons.
Our results suggest that V1 activity is only indirectly related to SFM perception, which is consistent with single-unit recording experiments that show that neural activity in V1 is related to absolute visual disparity, not perceived depth, which is based on relative visual disparity (Cumming and Parker, 2000). Furthermore, our results suggest that MT activity is closely related to SFM perception, which is consistent with microstimulation experiments showing an effect on perceived depth (DeAngelis et al., 1998) and with single-unit recoding experiments showing a depth-order effect (Bradley et al., 1998; Dodd et al., 2001) in area MT.
Controls
Several behavioral confounds could explain the perceptual modulations. First, animals may have systematically deviated their eye position; as a result the eye-centered receptive field would have moved, which in turn could affect neural responses. If this were correct, then there should be a correlation between percentage disparity and percept, but the sign of the correlation should have an equal likelihood of being positive or negative. However, as shown in Figure 10, the correlation is positive in MT, arguing against this explanation. Furthermore, the identical analysis that was used to analyze firing rates was also used to analyze mean radial error, mean vergence, mean horizontal speed, and mean vertical speed as dependent variables. As shown in Results, few experiments showed significant effects, and those that did were excluded from additional analysis. Thus, it is unlikely that eye movements caused the perceptual modulations.
Alternatively, the perceptual modulations might be attributable to differential allocation of feature-based attention to one or the other direction of moving dots. This would cause a systematic change in firing rate but would not explain why most MT neurons show a correlation between tuning properties and perceptual effects. However, a high-level attentional effect that is directed to a specific surface (He and Nakayama, 1995) cannot be ruled out by our data. Such a high-level effect would also constitute an abstract level of processing. The distinction between a perceptual effect and a high-level attentional effect may be difficult to tease apart. In any event, our data do show high level processing in MT but not in V1.
SFM perception
In the present study, monkeys were trained to perform a depth-order task. Although this task only probes one specific aspect of the entire SFM percept, the direction of rotation, adaptation, and eccentricity effects are consistent with an SFM percept (Nawrot and Blake, 1991a; Todd and Norman, 1991). The perceived depth-order is an important feature of the SFM percept (Nawrot and Blake, 1991a), but it is likely to be a more general process than SFM. For example, displays with two overlapping populations of dots that move linearly (without speed gradients) are also perceived with a depth-order, without a SFM percept. Thus, although the present experiments do not demonstrate that the entire SFM percept is generated in area MT, the data suggest that the depth-order of the SFM percept is represented there. Because the V1 perceptual signals are not correlated with the V1 tuning properties, it is not clear whether these V1 signals are early stages of the depth-order process or whether feedback from MT gives rise to these signals.
One could argue that only an area that includes all aspects of SFM percepts is truly related to its perception. However, this is a very difficult position to maintain, because such an area may not exist. Indeed, SFM can be the basis for object recognition (Dosher et al., 1989), believed to be performed in the ventral stream (Ungerleider and Mishkin, 1982; Goodale and Milner, 1992), as well as spatial perception (Caudek and Domini, 1998), believed to be performed in the dorsal stream (Ungerleider and Mishkin, 1982; Goodale and Milner, 1992). Thus, different areas may process SFM for different purposes, without all SFM-related signals converging at one site.
Neural correlates of perception
Several groups of researchers have related neural activity to the simultaneous percept. This requires a dissociation between stimulus and percept. One way to achieve such a dissociation is by using ambiguous stimuli, which contain no visual information about the perceptual choice to be made, nor is the percept biased in one way or another. Rather, for ambiguous stimuli, the animal is guessing. To ensure that the animal performs, there are similar stimuli in which the choice is determined by the stimulus. For example, Newsome et al. (1989) reduced the amount of coherent motion signal among random motion. Such experiments provided an important advance, demonstrating that for single trials neural activity in MT weakly covaries with the perceptual choice (Britten et al., 1996). Using ambiguous stimuli allows characterization of the psychophysical performance of the animal, because an entire family of stimuli can be readily generated. However, one of the difficulties of using ambiguous stimuli is that at the point of maximum uncertainty there is no definitive percept.
Bistable stimuli provide an alternative approach, because they can be perceived in one of two possible ways. Bistable stimuli elicit a strong percept, although the percept varies from trial to trial. SFM is such a situation. Another example is binocular rivalry, where two different stimuli are shown to the two eyes but only one is perceived (Blake, 1989). Binocular rivalry experiments demonstrated that neural signals in V1/V2 are only poorly correlated with the visual percept, and that this correlation increases in higher visual areas such as area V4 and inferotemporal cortex (Leopold and Logothetis, 1996; Sheinberg and Logothetis, 1997).
Interestingly, in MT the perceptual choice can be weakly predicted based on single neuron activity for ambiguous random dot stimuli (Britten et al., 1996) but not for bistable binocular rivalry stimuli (Logothetis and Schall, 1989). This difference may arise because in binocular rivalry it is difficult to parametrically vary the stimulus such that the psychophysical performance changes, without changing fundamental stimulus properties. In the present study we reconcile the difference between those studies by showing that even for bistable percepts MT activity is correlated with the percept, whereas this is not the case for V1 neurons. We demonstrate this using a parametric family of stimuli of which the bistable stimulus (SFM) is a natural part.
Underlying mechanisms
The analysis proceeded by treating the animal's percept as an independent variable that affects neural responses. However, this is only an analytical tool to detect systematic changes in neural firing rates while the stimulus is being perceived. In fact, the analysis is equally consistent with the interpretation that the change of neural firing rates caused the resulting percept and therefore choice.
Previous work suggests that SFM is the result of inhibitory neural interactions (Nawrot and Blake, 1991b). According to this scheme, neurons of opposite direction preference at the same depth inhibit each other, as do neurons of same direction preference at different depths (near vs far). When presented with stimuli that contain two directions of motion, such a system has two stable states. In both of these states, the two directions of motion are represented by neurons at different depths. For example, when the stimulus contains horizontally moving dots, one state corresponds to rightward-moving dots being represented by neurons preferring near depths, whereas leftward-moving dots are represented by neurons preferring far depths, and the other state is the reverse.
Very few neurons in area V1 show these specific inhibitory interactions as postulated by the model (Snowden et al., 1991; Qian and Andersen, 1994, 1995; Qian et al., 1994). The weakness of these interactions predicts that V1 neurons should not be perceptually correlated, which we find confirmed in the present study. In contrast, in area MT inhibitory interactions between directions of motion and changes of directional inhibition across depths are well documented (Snowden et al., 1991; Qian and Andersen, 1994; Bradley et al., 1995; Bradley and Andersen, 1998) and are consistent with modeling and psychophysics results (Grunewald and Lankheet, 1996). Because we find MT neurons to be perceptually correlated, the present findings support the model of SFM based on inhibitory interactions. Although V1 activity is not perceptually correlated, in some neurons it does change with the percept. This effect may arise because of nonspecific feedback onto tuned V1 neurons or because of specific feedback onto poorly tuned V1 neurons (Fig. 11). This feedback could come from MT, or from higher perceptual centers. Indeed, there are strong feedback projections from area MT to V1 (Maunsell and Van Essen, 1983a; Ungerleider and Desimone, 1986; Hupe et al., 1998).
Footnotes
This work was supported by the McDonnell-Pew Program in Cognitive Neuroscience and by the National Institutes of Health (National Eye Institute). We thank Greg de Angelis for help in the choice probability analysis.
Correspondence should be addressed to Dr. Richard Andersen, Division of Biology, California Institute of Technology, Mail Code 216-76, Pasadena, CA 91125. E-mail: andersen@vis.caltech.edu.
A. Grunewald's present address: Departments of Psychology and Physiology, University of Wisconsin-Madison, 1202 West Johnson Street, Madison, WI 53706.
David Bradley's present address: Department of Psychology, University of Chicago, 5848 South University Avenue, Green Hall, Room 314, Chicago, IL 69637.
REFERENCES
- 1.Albright TD. Direction and orientation selectivity of neurons in visual area MT of the macaque. J Neurophysiol. 1984;52:1106–1130. doi: 10.1152/jn.1984.52.6.1106. [DOI] [PubMed] [Google Scholar]
- 2.Blake R. A neural theory of binocular rivalry. Psychol Rev. 1989;96:145–167. doi: 10.1037/0033-295x.96.1.145. [DOI] [PubMed] [Google Scholar]
- 3.Bradley DC, Andersen RA. Center-surround antagonism based on disparity in primate area MT. J Neurosci. 1998;18:7552–7565. doi: 10.1523/JNEUROSCI.18-18-07552.1998. [DOI] [PMC free article] [PubMed] [Google Scholar]
- 4.Bradley DC, Qian N, Andersen RA. Integration of motion and stereopsis in middle temporal cortical area of macaques. Nature. 1995;373:609–611. doi: 10.1038/373609a0. [DOI] [PubMed] [Google Scholar]
- 5.Bradley DC, Chang GC, Andersen RA. Encoding of three-dimensional structure-from-motion by primate area MT neurons. Nature. 1998;392:714–717. doi: 10.1038/33688. [DOI] [PubMed] [Google Scholar]
- 6.Britten KH, Newsome WT, Shadlen MN, Celebrini S, Movshon JA. A relationship between behavioral choice and the visual responses of neurons in macaque MT. Vis Neurosci. 1996;13:87–100. doi: 10.1017/s095252380000715x. [DOI] [PubMed] [Google Scholar]
- 7.Caudek C, Domini F. Perceived orientation of axis of rotation in structure-from-motion. J Exp Psychol Hum Percept Perform. 1998;24:609–621. doi: 10.1037//0096-1523.24.2.609. [DOI] [PubMed] [Google Scholar]
- 8.Cumming BG, Parker AJ. Local disparity not perceived depth is signaled by binocular neurons in cortical area V1 of the macaque. J Neurosci. 2000;20:4758–4767. doi: 10.1523/JNEUROSCI.20-12-04758.2000. [DOI] [PMC free article] [PubMed] [Google Scholar]
- 9.DeAngelis GC, Newsome WT. Organization of disparity-selective neurons in macaque area MT. J Neurosci. 1999;19:1398–1415. doi: 10.1523/JNEUROSCI.19-04-01398.1999. [DOI] [PMC free article] [PubMed] [Google Scholar]
- 10.DeAngelis GC, Cumming BG, Newsome WT. Cortical area MT and the perception of stereoscopic depth. Nature. 1998;394:677–680. doi: 10.1038/29299. [DOI] [PubMed] [Google Scholar]
- 11.Dodd JV, Krug K, Cumming BG, Parker AJ. Perceptually bistable three-dimensional figures evoke high choice probabilities in cortical area MT. J Neurosci. 2001;21:4809–4821. doi: 10.1523/JNEUROSCI.21-13-04809.2001. [DOI] [PMC free article] [PubMed] [Google Scholar]
- 12.Dosher BA, Landy MS, Sperling G. Kinetic depth effect and optic flow. I. 3D shape from Fourier motion. Vision Res. 1989;29:1789–1813. doi: 10.1016/0042-6989(89)90161-2. [DOI] [PubMed] [Google Scholar]
- 13.Fox J. Applied regression analysis, linear models, and related methods. Sage Publications, Inc; Thousand Oaks, CA: 1997. [Google Scholar]
- 14.Gibson JJ. The ecological approach to visual perception. Houghton Mifflin; Boston: 1979. [Google Scholar]
- 15.Goodale MA, Milner AD. Separate visual pathways for perception and action. Trends Neurosci. 1992;15:20–25. doi: 10.1016/0166-2236(92)90344-8. [DOI] [PubMed] [Google Scholar]
- 16.Grunewald A, Lankheet MJ. Orthogonal motion after-effect illusion predicted by a model of cortical motion processing. Nature. 1996;384:358–360. doi: 10.1038/384358a0. [DOI] [PubMed] [Google Scholar]
- 17.Grunewald A, Bradley DC, Andersen RA. Neural correlates of depth-order motion perception in areas V1 and MT of macaque monkey. Soc Neurosci Abstr. 1999;25:3. [Google Scholar]
- 18.He ZJ, Nakayama K. Visual attention to surfaces in three-dimensional space. Proc Natl Acad Sci USA. 1995;92:11155–11159. doi: 10.1073/pnas.92.24.11155. [DOI] [PMC free article] [PubMed] [Google Scholar]
- 19.Hupe JM, James AC, Payne BR, Lomber SG, Girard P, Bullier J. Cortical feedback improves discrimination between figure and background by V1, V2, and V3 neurons. Nature. 1998;394:784–787. doi: 10.1038/29537. [DOI] [PubMed] [Google Scholar]
- 20.Ito M, Gilbert CD. Attention modulates contextual influences in the primary visual cortex of alert monkeys. Neuron. 1999;22:593–604. doi: 10.1016/s0896-6273(00)80713-8. [DOI] [PubMed] [Google Scholar]
- 21.Judge SJ, Richmond BJ, Chu FC. Implantation of magnetic search coils for measurement of eye position: an improved method. Vision Res. 1980;20:535–538. doi: 10.1016/0042-6989(80)90128-5. [DOI] [PubMed] [Google Scholar]
- 22.Leopold DA, Logothetis NK. Activity changes in early visual cortex reflect monkeys' percepts during binocular rivalry. Nature. 1996;379:549–553. doi: 10.1038/379549a0. [DOI] [PubMed] [Google Scholar]
- 23.Logothetis NK, Schall JD. Neuronal correlates of subjective visual perception. Science. 1989;245:761–763. doi: 10.1126/science.2772635. [DOI] [PubMed] [Google Scholar]
- 24.Macmillan NA, Creelman CD. Detection theory: a user's guide. Cambridge UP; New York: 1991. [Google Scholar]
- 25.Marr D. Vision. Freeman; New York: 1982. [Google Scholar]
- 26.Maunsell JH, Van Essen DC. The connections of the middle temporal visual area (MT) and their relationship to a cortical hierarchy in the macaque monkey. J Neurosci. 1983a;3:2563–2586. doi: 10.1523/JNEUROSCI.03-12-02563.1983. [DOI] [PMC free article] [PubMed] [Google Scholar]
- 27.Maunsell JH, Van Essen DC. Functional properties of neurons in middle temporal visual area of the macaque monkey. I. Selectivity for stimulus direction, speed, and orientation. J Neurophysiol. 1983b;49:1127–1147. doi: 10.1152/jn.1983.49.5.1127. [DOI] [PubMed] [Google Scholar]
- 28.Nawrot M, Blake R. The interplay between stereopsis and structure from motion. Percept Psychophys. 1991a;49:230–244. doi: 10.3758/bf03214308. [DOI] [PubMed] [Google Scholar]
- 29.Nawrot M, Blake R. A neural network model of kinetic depth. Vis Neurosci. 1991b;6:219–227. doi: 10.1017/s0952523800006234. [DOI] [PubMed] [Google Scholar]
- 30.Newsome WT, Britten KH, Movshon JA. Neuronal correlates of a perceptual decision. Nature. 1989;341:52–54. doi: 10.1038/341052a0. [DOI] [PubMed] [Google Scholar]
- 31.Qian N, Andersen RA. Transparent motion perception as detection of unbalanced motion signals. II. Physiology. J Neurosci. 1994;14:7367–7380. doi: 10.1523/JNEUROSCI.14-12-07367.1994. [DOI] [PMC free article] [PubMed] [Google Scholar]
- 32.Qian N, Andersen RA. V1 responses to transparent and nontransparent motions. Exp Brain Res. 1995;103:41–50. doi: 10.1007/BF00241963. [DOI] [PubMed] [Google Scholar]
- 33.Qian N, Andersen RA, Adelson EH. Transparent motion perception as detection of unbalanced motion signals. I. Psychophysics. J Neurosci. 1994;14:7357–7366. doi: 10.1523/JNEUROSCI.14-12-07357.1994. [DOI] [PMC free article] [PubMed] [Google Scholar]
- 34.Ringach DL, Hawken MJ, Shapley R. Binocular eye movements caused by the perception of three-dimensional structure from motion. Vision Res. 1996;36:1479–1492. doi: 10.1016/0042-6989(95)00285-5. [DOI] [PubMed] [Google Scholar]
- 35.Sheinberg DL, Logothetis NK. The role of temporal cortical areas in perceptual organization. Proc Natl Acad Sci USA. 1997;94:3408–3413. doi: 10.1073/pnas.94.7.3408. [DOI] [PMC free article] [PubMed] [Google Scholar]
- 36.Snowden RJ, Treue S, Erickson RG, Andersen RA. The response of area MT and V1 neurons to transparent motion. J Neurosci. 1991;11:2768–2785. doi: 10.1523/JNEUROSCI.11-09-02768.1991. [DOI] [PMC free article] [PubMed] [Google Scholar]
- 37.Snowden RJ, Treue S, Andersen RA. The response of neurons in areas V1 and MT of the alert rhesus monkey to moving random dot patterns. Exp Brain Res. 1992;88:389–400. doi: 10.1007/BF02259114. [DOI] [PubMed] [Google Scholar]
- 38.Todd JT, Norman JF. The visual perception of smoothly curved surfaces from minimal apparent motion sequences. Percept Psychophys. 1991;50:509–523. doi: 10.3758/bf03207535. [DOI] [PubMed] [Google Scholar]
- 39.Treue S, Martinez Trujillo JC. Feature-based attention influences motion processing gain in macaque visual cortex. Nature. 1999;399:575–579. doi: 10.1038/21176. [DOI] [PubMed] [Google Scholar]
- 40.Treue S, Maunsell JH. Attentional modulation of visual motion processing in cortical areas MT and MST. Nature. 1996;382:539–541. doi: 10.1038/382539a0. [DOI] [PubMed] [Google Scholar]
- 41.Treue S, Husain M, Andersen RA. Human perception of structure from motion. Vision Res. 1991;31:59–75. doi: 10.1016/0042-6989(91)90074-f. [DOI] [PubMed] [Google Scholar]
- 42.Ungerleider LG, Desimone R. Cortical connections of visual area MT in the macaque. J Comp Neurol. 1986;248:190–222. doi: 10.1002/cne.902480204. [DOI] [PubMed] [Google Scholar]
- 43.Ungerleider LG, Mishkin M. Two cortical visual systems. In: Ingle DJ, Goodale MA, Mansfiled RJW, editors. Analysis of visual behavior. MIT; Cambridge, MA: 1982. pp. 549–586. [Google Scholar]
- 44.Wallach H, O'Connell DN. The kinetic depth effect. J Exp Psychol. 1953;45:205–217. doi: 10.1037/h0056880. [DOI] [PubMed] [Google Scholar]
- 45.Watanabe T, Sasaki Y, Miyauchi S, Putz B, Fujimaki N, Nielsen M, Takino R, Miyakawa S. Attention-regulated activity in human primary visual cortex. J Neurophysiol. 1998;79:2218–2221. doi: 10.1152/jn.1998.79.4.2218. [DOI] [PubMed] [Google Scholar]